- +1-315-215-1633
- sales@thebrainyinsights.com

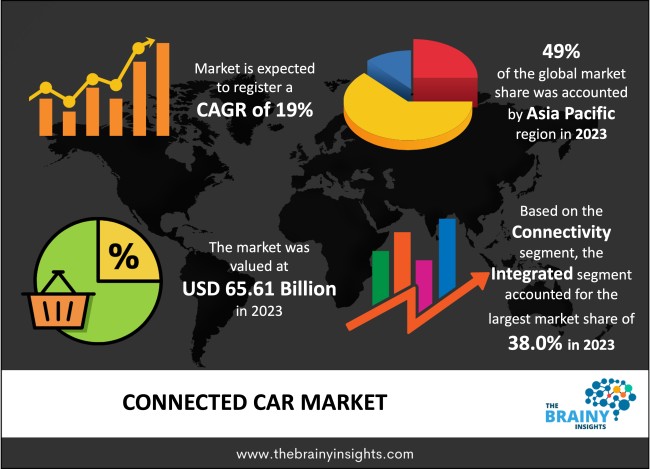
The global connected car market is expected to reach USD 373.63 billion by 2033, at a CAGR of 19% during the forecast period 2024 to 2033. North America is expected to grow the fastest during the forecast period. Connected car technologies can enable advanced features such as adaptive cruise control, and automated emergency braking, making driving easier and reducing the chances of accidents.
The connected car allows wheel connectivity by providing comfort, performance, convenience, security, safety, and sophisticated network technologies. This allows the driver to connect to web networks, allowing real-time communication. The important drivers that contribute to the growth of the globally connected car market are an increase in consumer demand for connection solutions, an increase in the necessity for constant connectivity, an increase in reliance on technology, and an increase in the tech-savvy population. Various connectivity options, such as the machine-to-machine (M2M) communication platform, have been created throughout time by automobile manufacturers and service providers. The vehicle is outfitted with sensors and computers that provide the driver with accurate and real-time information. This, in turn, stimulates the adoption of global connected cars worldwide, contributing to the market's growth. Technological developments, increased vehicle manufacturing, and increased demand for luxury and comfort in automobiles will likely enhance industry expansion. However, the rise in demand for lightweight suspension systems and the development of innovative suspension systems are projected to create a better chance for market growth. Connected cars can also manage traffic. They can communicate with traffic infrastructure and other cars to prevent accidents and reduce traffic congestion. They can also manage fuel consumption and improve vehicle efficiency. Connected cars monitor driving behaviour and provide feedback to the driver to manage fuel efficiency. Connected cars allow users to connect their smart devices to their cars and operate them. By connecting smart devices like smartphones and smart home devices, users can easily access services like communication, navigation, and entertainment.
Get an overview of this study by requesting a free sample
Rising Adoption of Cellphones- The definition of connectedness has changed because of cell phones. People desire to stay connected to the outside world even when travelling. Because connectivity is increasingly required, automakers are putting connectivity technologies into their vehicles to enhance sales. Customers want their cars to perform functions similar to cell phones and computers. Automobile makers are currently focusing on incorporating networking capabilities into their automobiles. Modern autos employ several networking technologies that require an internet connection to function. Embedded, integrated, or tethered connection options can all be used to enable connectivity in a car. One of these connectivity choices gives the driver and any passengers in the vehicle internet access.
Hacking- The main security problem is that the hacker can access the car's computer system and the data it collects and saves. As a result, cyber threats against connected cars are projected to stifle market expansion.
Rising Safety Standards- In safety, telecommunications and automotive technologies are merged to improve vehicle efficiency, reduce fuel and maintenance costs, improve security and safety features, and improve drivers' driving experience. The driver assistance system, which assists the driver in picking the optimal route to their destination, is another function of linked autos. It also notifies users of the availability of parking spaces and traffic congestion. These linked automotive features provide intelligent transportation solutions that improve the driving experience.
High Maintenance Cost- Improvements in global vehicle regulations and the high maintenance cost of modern suspension systems are expected to stymie the expansion of the connected car market.
The regions analyzed for the market include North America, Europe, South America, Asia Pacific, the Middle East, and Africa. Asia Pacific emerged as the most significant global connected car market, with a 49% market revenue share in 2023.
Asia Pacific dominates the connected car market, with a 49% market revenue share in 2023. The largest market is China, followed by India and South Korea. Because of the increased connectivity options in new automobile models, China will lead the Asia Pacific connected car market. With expanding technological advantages in ICT, data processing and platform services, secure industrial investment, and a very devoted industrial strategy and support from the central government, China's home market will shape the future related vehicle industry. The National Development and Reform Commission, China's influential planning agency, predicts that by 2021, one out of every two new automobiles sold will be outfitted with smart autonomous functions.
North America is expected to witness the fastest growth during the forecast period. The global connected car market study has been investigated in North America, which comprises the United States, Canada, and Mexico. Because of the expansion of the connected car network, the North American connected car market is expected to increase significantly. Furthermore, key telecommunications firms are investing in developing linked car capabilities. Increased vehicle production and sales in North America have resulted in the expansion of linked car services.
Asia Pacific Region Connected Car Market Share in 2023 - 49%
www.thebrainyinsights.com
Check the geographical analysis of this market by requesting a free sample
The technology segment is divided into 2G/3G, 4G/LTE, and 5G. The 5G segment dominated the market, with a market share of around 40% in 2023. The connected car market is still in charge. Several automakers are transitioning to 5 G-equipped connected car solutions that, depending on the situation, also provide 3G/4G service. Although 5G-enabled connected automobile devices and services are more expensive than other devices, their market is expanding due to the faster data transfer speed and more extensive bandwidth provided. On the other hand, a car with a 5G connection can provide various valuable services such as telematics, GPS tracking, infotainment, remote control access, and others. These 5G technologies are simple to use, inexpensive, and allow for remote diagnostics of a car, giving it a competitive advantage in the market.
The connectivity segment is divided into integrated, embedded, and tethered. The integrated segment dominated the market, with a market share of around 38.0% in 2023. Leading producers of connected car devices are getting accreditation from the organizations that control the automobile industry's safety functions. For example, Harman International, a subsidiary of Samsung Electronics Co., Ltd., is focused on connected car technologies that have received the required certificate commissioned by a certification business, TüV SüD, for meeting international automobile safety standards. This company's linked automobile software employs connected, integrated mobile devices that are secure across all platforms.
The end-user segment is divided into aftermarket and OEM. The OEM segment dominated the market, with a share of around 59% in 2023. Because of the rising usage of connected car services, EMs are gaining traction in the linked car market. Furthermore, technological advancements have enabled customers to select the connected car service in their automobiles, resulting in the rise of the globally connected car market.
| Attribute | Description |
|---|---|
| Market Size | Revenue (USD Billion) |
| Market size value in 2023 | USD 65.61 billion |
| Market size value in 2033 | USD 373.63 billion |
| CAGR (2024 to 2033) | 19% |
| Historical data | 2020-2022 |
| Base Year | 2023 |
| Forecast | 2024-2033 |
| Regional Segments | North America, Asia Pacific, Europe, Latin America, Middle East and Africa |
| Segments | Technology, Connectivity, End-User |
As per The Brainy Insights, the size of the connected car market was valued at USD 65.61 billion in 2023 to USD 373.63 billion by 2033.
The global connected car market is growing at a CAGR of 19% during the forecast period 2024-2033.
Asia Pacific emerged as the largest connected car market.
1. Introduction
1.1. Objectives of the Study
1.2. Market Definition
1.3. Research Scope
1.4. Currency
1.5. Key Target Audience
2. Research Methodology and Assumptions
3. Executive Summary
4. Premium Insights
4.1. Porter’s Five Forces Analysis
4.2. Value Chain Analysis
4.3. Top Investment Pockets
4.3.1. Market Attractiveness Analysis by Technology
4.3.2. Market Attractiveness Analysis by Connectivity
4.3.3. Market Attractiveness Analysis by End-User
4.3.4. Market Attractiveness Analysis by Region
4.4. Industry Trends
5. Market Dynamics
5.1. Market Evaluation
5.2. Drivers
5.2.1. Rising Adoption of Cellphones
5.3. Restraints
5.3.1. Hacking
5.4. Opportunities
5.4.1. Rising safety Standards
5.5. Challenges
5.5.1. High Maintenance Cost
6. Global Connected Car Market Analysis and Forecast, By Technology
6.1. Segment Overview
6.2. 2G/3G
6.3. 4G/LTE
6.4. 5G
7. Global Connected Car Market Analysis and Forecast, By Connectivity
7.1. Segment Overview
7.2. Integrated
7.3. Embedded
7.4. Tethered
8. Global Connected Car Market Analysis and Forecast, By End-User
8.1. Segment Overview
8.2. Aftermarket
8.3. OEM
9. Global Connected Car Market Analysis and Forecast, By Regional Analysis
9.1. Segment Overview
9.2. North America
9.2.1. U.S.
9.2.2. Canada
9.2.3. Mexico
9.3. Europe
9.3.1. Germany
9.3.2. France
9.3.3. U.K.
9.3.4. Italy
9.3.5. Spain
9.4. Asia-Pacific
9.4.1. Japan
9.4.2. China
9.4.3. India
9.5. South America
9.5.1. Brazil
9.6. Middle East and Africa
9.6.1. UAE
9.6.2. South Africa
10. Global Connected Car Market-Competitive Landscape
10.1. Overview
10.2. Market Share of Key Players in Global Connected Car Market
10.2.1. Global Company Market Share
10.2.2. North America Company Market Share
10.2.3. Europe Company Market Share
10.2.4. APAC Company Market Share
10.3. Competitive Situations and Trends
10.3.1. Product Launches and Developments
10.3.2. Partnerships, Collaborations, and Agreements
10.3.3. Mergers & Acquisitions
10.3.4. Expansions
11. Company Profiles
11.1. Airbiquity Inc.
11.1.1. Business Overview
11.1.2. Company Snapshot
11.1.3. Company Market Share Analysis
11.1.4. Company Product Portfolio
11.1.5. Recent Developments
11.1.6. SWOT Analysis
11.2. Continental AG
11.2.1. Business Overview
11.2.2. Company Snapshot
11.2.3. Company Market Share Analysis
11.2.4. Company Product Portfolio
11.2.5. Recent Developments
11.2.6. SWOT Analysis
11.3. Qualcomm Technologies, Inc.
11.3.1. Business Overview
11.3.2. Company Snapshot
11.3.3. Company Market Share Analysis
11.3.4. Company Product Portfolio
11.3.5. Recent Developments
11.3.6. SWOT Analysis
11.4. Robert Bosch GmbH
11.4.1. Business Overview
11.4.2. Company Snapshot
11.4.3. Company Market Share Analysis
11.4.4. Company Product Portfolio
11.4.5. Recent Developments
11.4.6. SWOT Analysis
11.5. Sierra Wireless
11.5.1. Business Overview
11.5.2. Company Snapshot
11.5.3. Company Market Share Analysis
11.5.4. Company Product Portfolio
11.5.5. Recent Developments
11.5.6. SWOT Analysis
11.6. Tesla
11.6.1. Business Overview
11.6.2. Company Snapshot
11.6.3. Company Market Share Analysis
11.6.4. Company Product Portfolio
11.6.5. Recent Developments
11.6.6. SWOT Analysis
11.7. AT&T
11.7.1. Business Overview
11.7.2. Company Snapshot
11.7.3. Company Market Share Analysis
11.7.4. Company Product Portfolio
11.7.5. Recent Developments
11.7.6. SWOT Analysis
11.8. Audi AG
11.8.1. Business Overview
11.8.2. Company Snapshot
11.8.3. Company Market Share Analysis
11.8.4. Company Product Portfolio
11.8.5. Recent Developments
11.8.6. SWOT Analysis
11.9. Daimler AG
11.9.1. Business Overview
11.9.2. Company Snapshot
11.9.3. Company Market Share Analysis
11.9.4. Company Product Portfolio
11.9.5. Recent Developments
11.9.6. SWOT Analysis
11.10. Ford Motor Company
11.10.1. Business Overview
11.10.2. Company Snapshot
11.10.3. Company Market Share Analysis
11.10.4. Company Product Portfolio
11.10.5. Recent Developments
11.10.6. SWOT Analysis
11.11. Samsung Electronics
11.11.1. Business Overview
11.11.2. Company Snapshot
11.11.3. Company Market Share Analysis
11.11.4. Company Product Portfolio
11.11.5. Recent Developments
11.11.6. SWOT Analysis
11.12. TomTom International
11.12.1. Business Overview
11.12.2. Company Snapshot
11.12.3. Company Market Share Analysis
11.12.4. Company Product Portfolio
11.12.5. Recent Developments
11.12.6. SWOT Analysis
11.13. Verizon Communications
11.13.1. Business Overview
11.13.2. Company Snapshot
11.13.3. Company Market Share Analysis
11.13.4. Company Product Portfolio
11.13.5. Recent Developments
11.13.6. SWOT Analysis
11.14. Vodafone Group Plc
11.14.1. Business Overview
11.14.2. Company Snapshot
11.14.3. Company Market Share Analysis
11.14.4. Company Product Portfolio
11.14.5. Recent Developments
11.14.6. SWOT Analysis
List of Table
1. Global Connected Car Market, By Technology, 2020-2033 (USD Billion)
2. Global 2G/3G, Connected Car Market, By Region, 2020-2033 (USD Billion)
3. Global 4G/LTE, Connected Car Market, By Region, 2020-2033 (USD Billion)
4. Global 5G, Connected Car Market, By Region, 2020-2033 (USD Billion)
5. Global Connected Car Market, By Connectivity, 2020-2033 (USD Billion)
6. Global Integrated, Connected Car Market, By Region, 2020-2033 (USD Billion)
7. Global Embedded, Connected Car Market, By Region, 2020-2033 (USD Billion)
8. Global Tethered, Connected Car Market, By Region, 2020-2033 (USD Billion)
9. Global Connected Car Market, By End-User, 2020-2033 (USD Billion)
10. Global Aftermarket, Connected Car Market, By Region, 2020-2033 (USD Billion)
11. Global OEM, Connected Car Market, By Region, 2020-2033 (USD Billion)
12. North America Connected Car Market, By Technology, 2020-2033 (USD Billion)
13. North America Connected Car Market, By Connectivity, 2020-2033 (USD Billion)
14. North America Connected Car Market, By End-User, 2020-2033 (USD Billion)
15. U.S. Connected Car Market, By Technology, 2020-2033 (USD Billion)
16. U.S. Connected Car Market, By Connectivity, 2020-2033 (USD Billion)
17. U.S. Connected Car Market, By End-User, 2020-2033 (USD Billion)
18. Canada Connected Car Market, By Technology, 2020-2033 (USD Billion)
19. Canada Connected Car Market, By Connectivity, 2020-2033 (USD Billion)
20. Canada Connected Car Market, By End-User, 2020-2033 (USD Billion)
21. Mexico Connected Car Market, By Technology, 2020-2033 (USD Billion)
22. Mexico Connected Car Market, By Connectivity, 2020-2033 (USD Billion)
23. Mexico Connected Car Market, By End-User, 2020-2033 (USD Billion)
24. Europe Connected Car Market, By Technology, 2020-2033 (USD Billion)
25. Europe Connected Car Market, By Connectivity, 2020-2033 (USD Billion)
26. Europe Connected Car Market, By End-User, 2020-2033 (USD Billion)
27. Germany Connected Car Market, By Technology, 2020-2033 (USD Billion)
28. Germany Connected Car Market, By Connectivity, 2020-2033 (USD Billion)
29. Germany Connected Car Market, By End-User, 2020-2033 (USD Billion)
30. France Connected Car Market, By Technology, 2020-2033 (USD Billion)
31. France Connected Car Market, By Connectivity, 2020-2033 (USD Billion)
32. France Connected Car Market, By End-User, 2020-2033 (USD Billion)
33. U.K. Connected Car Market, By Technology, 2020-2033 (USD Billion)
34. U.K. Connected Car Market, By Connectivity, 2020-2033 (USD Billion)
35. U.K. Connected Car Market, By End-User, 2020-2033 (USD Billion)
36. Italy Connected Car Market, By Technology, 2020-2033 (USD Billion)
37. Italy Connected Car Market, By Connectivity, 2020-2033 (USD Billion)
38. Italy Connected Car Market, By End-User, 2020-2033 (USD Billion)
39. Spain Connected Car Market, By Technology, 2020-2033 (USD Billion)
40. Spain Connected Car Market, By Connectivity, 2020-2033 (USD Billion)
41. Spain Connected Car Market, By End-User, 2020-2033 (USD Billion)
42. Asia Pacific Connected Car Market, By Technology, 2020-2033 (USD Billion)
43. Asia Pacific Connected Car Market, By Connectivity, 2020-2033 (USD Billion)
44. Asia Pacific Connected Car Market, By End-User, 2020-2033 (USD Billion)
45. Japan Connected Car Market, By Technology, 2020-2033 (USD Billion)
46. Japan Connected Car Market, By Connectivity, 2020-2033 (USD Billion)
47. Japan Connected Car Market, By End-User, 2020-2033 (USD Billion)
48. China Connected Car Market, By Technology, 2020-2033 (USD Billion)
49. China Connected Car Market, By Connectivity, 2020-2033 (USD Billion)
50. China Connected Car Market, By End-User, 2020-2033 (USD Billion)
51. India Connected Car Market, By Technology, 2020-2033 (USD Billion)
52. India Connected Car Market, By Connectivity, 2020-2033 (USD Billion)
53. India Connected Car Market, By End-User, 2020-2033 (USD Billion)
54. South America Connected Car Market, By Technology, 2020-2033 (USD Billion)
55. South America Connected Car Market, By Connectivity, 2020-2033 (USD Billion)
56. South America Connected Car Market, By End-User, 2020-2033 (USD Billion)
57. Brazil Connected Car Market, By Technology, 2020-2033 (USD Billion)
58. Brazil Connected Car Market, By Connectivity, 2020-2033 (USD Billion)
59. Brazil Connected Car Market, By End-User, 2020-2033 (USD Billion)
60. Middle East and Africa Connected Car Market, By Technology, 2020-2033 (USD Billion)
61. Middle East and Africa Connected Car Market, By Connectivity, 2020-2033 (USD Billion)
62. Middle East and Africa Connected Car Market, By End-User, 2020-2033 (USD Billion)
63. UAE Connected Car Market, By Technology, 2020-2033 (USD Billion)
64. UAE Connected Car Market, By Connectivity, 2020-2033 (USD Billion)
65. UAE Connected Car Market, By End-User, 2020-2033 (USD Billion)
66. South Africa Connected Car Market, By Technology, 2020-2033 (USD Billion)
67. South Africa Connected Car Market, By Connectivity, 2020-2033 (USD Billion)
68. South Africa Connected Car Market, By End-User, 2020-2033 (USD Billion)
List of Figures
1. Global Connected Car Market Segmentation
2. Global Connected Car Market: Research Methodology
3. Market Size Estimation Methodology: Bottom-Up Approach
4. Market Size Estimation Methodology: Top-Down Approach
5. Data Triangulation
6. Porter’s Five Forces Analysis
7. Value Chain Analysis
8. Global Connected Car Market Attractiveness Analysis by Technology
9. Global Connected Car Market Attractiveness Analysis by Connectivity
10. Global Connected Car Market Attractiveness Analysis by End-User
11. Global Connected Car Market Attractiveness Analysis by Region
12. Global Connected Car Market: Dynamics
13. Global Connected Car Market Share by Technology (2023 & 2033)
14. Global Connected Car Market Share by Connectivity (2023 & 2033)
15. Global Connected Car Market Share by End-User (2023 & 2033)
16. Global Connected Car Market Share by Regions (2023 & 2033)
17. Global Connected Car Market Share by Company (2023)
This study forecasts global, regional, and country revenue from 2020 to 2033. The Brainy Insights has segmented the global connected car market based on the below-mentioned segments:
Global Connected Car Market By Technology:
Global Connected Car Market By Connectivity:
Global Connected Car Market By End-User:
Global Connected Car Market By Region:
Research has its special purpose to undertake marketing efficiently. In this competitive scenario, businesses need information across all industry verticals; the information about customer wants, market demand, competition, industry trends, distribution channels etc. This information needs to be updated regularly because businesses operate in a dynamic environment. Our organization, The Brainy Insights incorporates scientific and systematic research procedures in order to get proper market insights and industry analysis for overall business success. The analysis consists of studying the market from a miniscule level wherein we implement statistical tools which helps us in examining the data with accuracy and precision.
Our research reports feature both; quantitative and qualitative aspects for any market. Qualitative information for any market research process are fundamental because they reveal the customer needs and wants, usage and consumption for any product/service related to a specific industry. This in turn aids the marketers/investors in knowing certain perceptions of the customers. Qualitative research can enlighten about the different product concepts and designs along with unique service offering that in turn, helps define marketing problems and generate opportunities. On the other hand, quantitative research engages with the data collection process through interviews, e-mail interactions, surveys and pilot studies. Quantitative aspects for the market research are useful to validate the hypotheses generated during qualitative research method, explore empirical patterns in the data with the help of statistical tools, and finally make the market estimations.
The Brainy Insights offers comprehensive research and analysis, based on a wide assortment of factual insights gained through interviews with CXOs and global experts and secondary data from reliable sources. Our analysts and industry specialist assume vital roles in building up statistical tools and analysis models, which are used to analyse the data and arrive at accurate insights with exceedingly informative research discoveries. The data provided by our organization have proven precious to a diverse range of companies, facilitating them to address issues such as determining which products/services are the most appealing, whether or not customers use the product in the manner anticipated, the purchasing intentions of the market and many others.
Our research methodology encompasses an idyllic combination of primary and secondary initiatives. Key phases involved in this process are listed below:

The phase involves the gathering and collecting of market data and its related information with the help of different sources & research procedures.

The data procurement stage involves in data gathering and collecting through various data sources.
This stage involves in extensive research. These data sources includes:
Purchased Database: Purchased databases play a crucial role in estimating the market sizes irrespective of the domain. Our purchased database includes:
Primary Research: The Brainy Insights interacts with leading companies and experts of the concerned domain to develop the analyst team’s market understanding and expertise. It improves and substantiates every single data presented in the market reports. Primary research mainly involves in telephonic interviews, E-mail interactions and face-to-face interviews with the raw material providers, manufacturers/producers, distributors, & independent consultants. The interviews that we conduct provides valuable data on market size and industry growth trends prevailing in the market. Our organization also conducts surveys with the various industry experts in order to gain overall insights of the industry/market. For instance, in healthcare industry we conduct surveys with the pharmacists, doctors, surgeons and nurses in order to gain insights and key information of a medical product/device/equipment which the customers are going to usage. Surveys are conducted in the form of questionnaire designed by our own analyst team. Surveys plays an important role in primary research because surveys helps us to identify the key target audiences of the market. Additionally, surveys helps to identify the key target audience engaged with the market. Our survey team conducts the survey by targeting the key audience, thus gaining insights from them. Based on the perspectives of the customers, this information is utilized to formulate market strategies. Moreover, market surveys helps us to understand the current competitive situation of the industry. To be precise, our survey process typically involve with the 360 analysis of the market. This analytical process begins by identifying the prospective customers for a product or service related to the market/industry to obtain data on how a product/service could fit into customers’ lives.

Secondary Research: The secondary data sources includes information published by the on-profit organizations such as World bank, WHO, company fillings, investor presentations, annual reports, national government documents, statistical databases, blogs, articles, white papers and others. From the annual report, we analyse a company’s revenue to understand the key segment and market share of that organization in a particular region. We analyse the company websites and adopt the product mapping technique which is important for deriving the segment revenue. In the product mapping method, we select and categorize the products offered by the companies catering to domain specific market, deduce the product revenue for each of the companies so as to get overall estimation of the market size. We also source data and analyses trends based on information received from supply side and demand side intermediaries in the value chain. The supply side denotes the data gathered from supplier, distributor, wholesaler and the demand side illustrates the data gathered from the end customers for respective market domain.

The supply side for a domain specific market is analysed by:
The demand side for the market is estimated through:
In-house Library: Apart from these third-party sources, we have our in-house library of qualitative and quantitative information. Our in-house database includes market data for various industry and domains. These data are updated on regular basis as per the changing market scenario. Our library includes, historic databases, internal audit reports and archives.
Sometimes there are instances where there is no metadata or raw data available for any domain specific market. For those cases, we use our expertise to forecast and estimate the market size in order to generate comprehensive data sets. Our analyst team adopt a robust research technique in order to produce the estimates:
Data Synthesis: This stage involves the analysis & mapping of all the information obtained from the previous step. It also involves in scrutinizing the data for any discrepancy observed while data gathering related to the market. The data is collected with consideration to the heterogeneity of sources. Robust scientific techniques are in place for synthesizing disparate data sets and provide the essential contextual information that can orient market strategies. The Brainy Insights has extensive experience in data synthesis where the data passes through various stages:


Market Deduction & Formulation: The final stage comprises of assigning data points at appropriate market spaces so as to deduce feasible conclusions. Analyst perspective & subject matter expert based holistic form of market sizing coupled with industry analysis also plays a crucial role in this stage.
This stage involves in finalization of the market size and numbers that we have collected from data integration step. With data interpolation, it is made sure that there is no gap in the market data. Successful trend analysis is done by our analysts using extrapolation techniques, which provide the best possible forecasts for the market.
Data Validation & Market Feedback: Validation is the most important step in the process. Validation & re-validation via an intricately designed process helps us finalize data-points to be used for final calculations.

The Brainy Insights interacts with leading companies and experts of the concerned domain to develop the analyst team’s market understanding and expertise. It improves and substantiates every single data presented in the market reports. The data validation interview and discussion panels are typically composed of the most experienced industry members. The participants include, however, are not limited to:
Moreover, we always validate our data and findings through primary respondents from all the major regions we are working on.


Free Customization
Fortune 500 Clients
Free Yearly Update On Purchase Of Multi/Corporate License
Companies Served Till Date