- +1-315-215-1633
- sales@thebrainyinsights.com

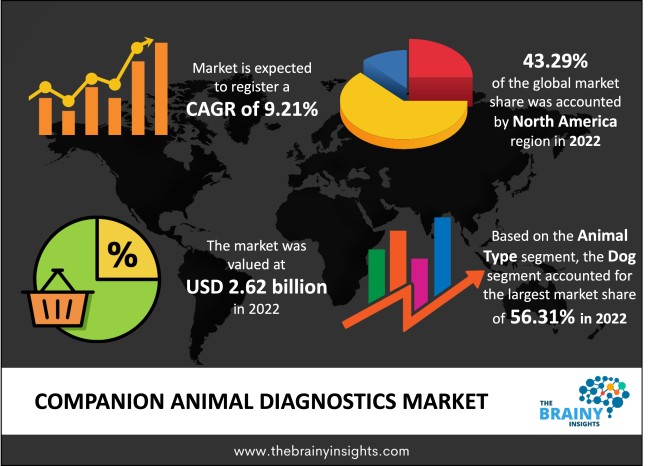
The global companion animal diagnostics market was valued at USD 2.62 Billion in 2022 and grew at a CAGR of 9.21% from 2023 to 2032. The market is expected to reach USD 6.32 Billion by 2032. The demand for disease control and prevention, as well as a better understanding of companion animals, is driving an increase in the use of veterinary diagnostics. A minor outbreak may threaten an entire animal community; thus, proper diagnosis is crucial.
Due to their diminutive size and erratic sickness symptoms, the companion animals need more attention from the veterinarian. The veterinarian must diagnose any ailments these animals may have. Animals having signs that could point to many illnesses or conditions are occasionally seen by veterinarians. In this instance, a differential diagnosis outlines the options and a strategy for identifying the issue through more testing. Animal health depends on veterinary diagnostics, which can spot health problems before they can be treated and speed up diagnosis and treatment planning. Veterinary diagnostics, which can identify health issues before they can be treated and expedite diagnosis and treatment planning, are essential to maintaining animal health.
Get an overview of this study by requesting a free sample
Increasing adoption of companion animals: Over half a billion dogs and cats are owned by families in the U.S., Brazil, EU, and China alone and it is believed that more than half of people worldwide have a pet at home. Owners can benefit from having pets in various therapeutic, physical, psychological, and psychosocial ways. These benefits include reduced blood pressure, lower risk of heart attacks, more physical activity, more sensory stimulation, and emotional support. The requirement for veterinary care will increase as the number of pets increases. The good effects of companion animals are becoming more widely recognized and appreciated, bringing animal health concerns to the forefront. Additionally, there is a substantial correlation between pet ownership and lower healthcare costs in the United States, which results in fewer medical visits and better overall health.
Lack of infrastructure: Companion animal diagnostics products can be expensive depending on the pet. The two main costs are initial costs and healthcare costs. The diagnostic cost can be higher for exotic breeds and in case of deeper wounds. The diagnostic cost is the most expensive aspect for pet owners. According to different studies, the average vet visit ranges from $50 to $400. Thus, these costs limit the adoption of pets among middle-income consumers.
Investment in technological development of diagnostics software: The development of technology has greatly benefited the medical industry. The size of the diagnostic, monitoring, and treatment tools has decreased due to more intelligent decision-making and widespread utilization capabilities. Recently, portable diagnostic kits have been available on the market, enabling the practical application of this well-liked technique. Several sectors of veterinary that did not previously use advanced diagnostics methods are likely to do so in the future due to the development of portable diagnostic kits. To diagnose anomalies in photographs, AI systems are currently being researched. Deep learning measurement approaches are employed in companion animal diagnostics analysis software. Equally versatile software is required for viewing, manipulating, and interpreting the diagnostics images.
The regions analyzed for the market include North America, Europe, South America, Asia Pacific, the Middle East, and Africa. North America emerged as the most significant companion animal diagnostics market, with a 43.29% market revenue share in 2022.
North America region will account for the largest market share with revenue growth. Nations such as the U.S., Canada and Mexico have a tremendous demand for companion animal diagnostics due to several factors such as the rising number of pet owners, increasing urbanization, growing prevalence of animal infectious diseases and many companies investing in the development of portable diagnostic kit technology that can be used for quick and effective diagnosis at home.
North America region Companion Animal Diagnostics Market Share in 2022 - 43.29%
www.thebrainyinsights.com
Check the geographical analysis of this market by requesting a free sample
The animal type segment is divided into cat, horse, dog and others. The dog segment dominated the market, with a share of around 56.31% in 2022. According to several reports, most of the dog population suffers from obesity. Obesity has increased diabetes, cancer and joint problems among dogs, especially in developing regions.
The technology segment is divided into hematology, clinical biochemistry, immunodiagnostics, urinalysis, molecular diagnostics and others. The clinical biochemistry segment dominated the market, with a share of around 42.11% in 2022. To diagnose and detect the progression of a zoology disease, clinical biochemistry analyzes blood plasma for several chemicals, including substrates, hormones, enzymes, etc.
The application method segment is divided into bacteriology, clinical pathology, virology, parasitology, and others. The clinical pathology segment dominated the market, with a share of around 45.20% in 2022. Clinical pathology focuses primarily on in-life characteristics, in contrast to anatomic pathology. Clinical pathology helps examine the diagnosis of several zoological diseases and detect their progression in stages.
The end-user segment is divided into diagnostics laboratories, veterinary clinics and hospitals, research institutes and home care settings. The diagnostics laboratories segment dominated the market, with a share of around 49.31% in 2022. A diagnostic facility conducts several tests to identify the companion animal source. Animal diagnostics laboratories are specialized centres that provide effective diagnostic procedures for different types of species.
| Attribute | Description |
|---|---|
| Market Size | Revenue (USD Billion) |
| Market size value in 2022 | USD 2.62 Billion |
| Market size value in 2032 | USD 6.32 Billion |
| CAGR (2023 to 2032) | 9.21% |
| Historical data | 2019-2021 |
| Base Year | 2022 |
| Forecast | 2023-2032 |
| Region | The regions analyzed for the market are Asia Pacific, Europe, South America, North America, and Middle East & Africa. Furthermore, the regions are further analyzed at the country level. |
| Segments | Animal Type, Technology, Application and End-users |
As per The Brainy Insights, the size of the companion animal diagnostics market was valued USD 2.62 billion in 2022 to USD 6.32 billion by 2032.
Global companion animal diagnostics market is growing at a CAGR of 9.21% during the forecast period 2023-2032.
North America region emerged as the largest market for the companion animal diagnostics.
The market's growth will be influenced by the rising adoption of companion animals.
The high cost of diagnostic procedure can hamper the market growth.
The rising investment in technological advancement is providing huge opportunities to the market.
1. Introduction
1.1. Objectives of the Study
1.2. Market Definition
1.3. Research Scope
1.4. Currency
1.5. Key Target Audience
2. Research Methodology and Assumptions
3. Executive Summary
4. Premium Insights
4.1. Porter’s Five Forces Analysis
4.2. Value Chain Analysis
4.3. Top Investment Pockets
4.3.1. Market Attractiveness Analysis by Animal Type
4.3.2. Market Attractiveness Analysis by Technology
4.3.3. Market Attractiveness Analysis by Application
4.3.4. Market Attractiveness Analysis by End-users
4.3.5. Market Attractiveness Analysis by Region
4.4. Industry Trends
5. Market Dynamics
5.1. Market Evaluation
5.2. Drivers
5.2.1. Increasing adoption of companion animal
5.3. Restraints
5.3.1. High cost of diagnostic procedures
5.4. Opportunities
5.4.1. Increasing technological advancement in the procedure
5.5. Challenges
5.5.1. Stringent regulations
6. Global Companion Animal Diagnostics Market Analysis and Forecast, By Animal Type
6.1. Segment Overview
6.2. Cat
6.3. Horse
6.4. Dog
6.5. Others
7. Global Companion Animal Diagnostics Market Analysis and Forecast, By Technology
7.1. Segment Overview
7.2. Hematology
7.3. Clinical Biochemistry
7.4. Immunodiagnostics
7.5. Urinalysis
7.6. Molecular Diagnostics
7.7. Others
8. Global Companion Animal Diagnostics Market Analysis and Forecast, By Application
8.1. Segment Overview
8.2. Bacteriology
8.3. Clinical Pathology
8.4. Virology
8.5. Parasitology
8.6. Others
9. Global Companion Animal Diagnostics Market Analysis and Forecast, By End-users
9.1. Segment Overview
9.2. Diagnostics Laboratories
9.3. Veterinary Clinics and Hospitals
9.4. Research Institutes
9.5. Home Care Settings
10. Global Companion Animal Diagnostics Market Analysis and Forecast, By Regional Analysis
10.1. Segment Overview
10.2. North America
10.2.1. U.S.
10.2.2. Canada
10.2.3. Mexico
10.3. Europe
10.3.1. Germany
10.3.2. France
10.3.3. U.K.
10.3.4. Italy
10.3.5. Spain
10.4. Asia-Pacific
10.4.1. Japan
10.4.2. China
10.4.3. India
10.5. South America
10.5.1. Brazil
10.6. Middle East and Africa
10.6.1. UAE
10.6.2. South Africa
11. Global Companion Animal Diagnostics Market-Competitive Landscape
11.1. Overview
11.2. Market Share of Key Players in the Companion Animal Diagnostics Market
11.2.1. Global Company Market Share
11.2.2. North America Company Market Share
11.2.3. Europe Company Market Share
11.2.4. APAC Company Market Share
11.3. Competitive Situations and Trends
11.3.1. Product Launches and Developments
11.3.2. Partnerships, Collaborations, and Agreements
11.3.3. Mergers & Acquisitions
11.3.4. Expansions
12. Company Profiles
12.1. Virbac
12.1.1. Business Overview
12.1.2. Company Snapshot
12.1.3. Company Market Share Analysis
12.1.4. Company Product Portfolio
12.1.5. Recent Developments
12.1.6. SWOT Analysis
12.2. Zoetis, Inc
12.2.1. Business Overview
12.2.2. Company Snapshot
12.2.3. Company Market Share Analysis
12.2.4. Company Product Portfolio
12.2.5. Recent Developments
12.2.6. SWOT Analysis
12.3. Fujifilm Holdings Corporation
12.3.1. Business Overview
12.3.2. Company Snapshot
12.3.3. Company Market Share Analysis
12.3.4. Company Product Portfolio
12.3.5. Recent Developments
12.3.6. SWOT Analysis
12.4. Thermo Fisher Scientific, Inc
12.4.1. Business Overview
12.4.2. Company Snapshot
12.4.3. Company Market Share Analysis
12.4.4. Company Product Portfolio
12.4.5. Recent Developments
12.4.6. SWOT Analysis
12.5. Indical Bioscience Gmbh
12.5.1. Business Overview
12.5.2. Company Snapshot
12.5.3. Company Market Share Analysis
12.5.4. Company Product Portfolio
12.5.5. Recent Developments
12.5.6. SWOT Analysis
12.6. Triviumvet
12.6.1. Business Overview
12.6.2. Company Snapshot
12.6.3. Company Market Share Analysis
12.6.4. Company Product Portfolio
12.6.5. Recent Developments
12.6.6. SWOT Analysis
12.7. BioNote Inc
12.7.1. Business Overview
12.7.2. Company Snapshot
12.7.3. Company Market Share Analysis
12.7.4. Company Product Portfolio
12.7.5. Recent Developments
12.7.6. SWOT Analysis
12.8. IDvet
12.8.1. Business Overview
12.8.2. Company Snapshot
12.8.3. Company Market Share Analysis
12.8.4. Company Product Portfolio
12.8.5. Recent Developments
12.8.6. SWOT Analysis
12.9. Shenzhen Mindray Animal Medical Technology Co. Ltd
12.9.1. Business Overview
12.9.2. Company Snapshot
12.9.3. Company Market Share Analysis
12.9.4. Company Product Portfolio
12.9.5. Recent Developments
12.9.6. SWOT Analysis
12.10. HyTest Ltd
12.10.1. Business Overview
12.10.2. Company Snapshot
12.10.3. Company Market Share Analysis
12.10.4. Company Product Portfolio
12.10.5. Recent Developments
12.10.6. SWOT Analysis
12.11. Randox Laboratories Ltd
12.11.1. Business Overview
12.11.2. Company Snapshot
12.11.3. Company Market Share Analysis
12.11.4. Company Product Portfolio
12.11.5. Recent Developments
12.11.6. SWOT Analysis
12.12. Creative Diagnostics
12.12.1. Business Overview
12.12.2. Company Snapshot
12.12.3. Company Market Share Analysis
12.12.4. Company Product Portfolio
12.12.5. Recent Developments
12.12.6. SWOT Analysis
12.13. Agrolabo SPA
12.13.1. Business Overview
12.13.2. Company Snapshot
12.13.3. Company Market Share Analysis
12.13.4. Company Product Portfolio
12.13.5. Recent Developments
12.13.6. SWOT Analysis
12.14. Biomerieux SA
12.14.1. Business Overview
12.14.2. Company Snapshot
12.14.3. Company Market Share Analysis
12.14.4. Company Product Portfolio
12.14.5. Recent Developments
12.14.6. SWOT Analysis
12.15. Heska Corporation
12.15.1. Business Overview
12.15.2. Company Snapshot
12.15.3. Company Market Share Analysis
12.15.4. Company Product Portfolio
12.15.5. Recent Developments
12.15.6. SWOT Analysis
12.16. Idexx Laboratories Inc.
12.16.1. Business Overview
12.16.2. Company Snapshot
12.16.3. Company Market Share Analysis
12.16.4. Company Product Portfolio
12.16.5. Recent Developments
12.16.6. SWOT Analysis
12.17. Neogen Corporation
12.17.1. Business Overview
12.17.2. Company Snapshot
12.17.3. Company Market Share Analysis
12.17.4. Company Product Portfolio
12.17.5. Recent Developments
12.17.6. SWOT Analysis
List of Table
1. Global Companion Animal Diagnostics Market, By Animal Type, 2019-2032 (USD Billion)
2. Global Cat, Companion Animal Diagnostics Market, By Region, 2019-2032 (USD Billion)
3. Global Horse, Companion Animal Diagnostics Market, By Region, 2019-2032 (USD Billion)
4. Global Dog, Companion Animal Diagnostics Market, By Region, 2019-2032 (USD Billion)
5. Global Others, Companion Animal Diagnostics Market, By Region, 2019-2032 (USD Billion)
6. Global Companion Animal Diagnostics Market, By Technology, 2019-2032 (USD Billion)
7. Global Hematology, Companion Animal Diagnostics Market, By Region, 2019-2032 (USD Billion)
8. Global Clinical Biochemistry, Companion Animal Diagnostics Market, By Region, 2019-2032 (USD Billion)
9. Global Immunodiagnostics, Companion Animal Diagnostics Market, By Region, 2019-2032 (USD Billion)
10. Global Urinalysis, Companion Animal Diagnostics Market, By Region, 2019-2032 (USD Billion)
11. Global Molecular Diagnostics, Companion Animal Diagnostics Market, By Region, 2019-2032 (USD Billion)
12. Global Others, Companion Animal Diagnostics Market, By Region, 2019-2032 (USD Billion)
13. Global Companion Animal Diagnostics Market, By Application, 2019-2032 (USD Billion)
14. Global Bacteriology, Companion Animal Diagnostics Market, By Region, 2019-2032 (USD Billion)
15. Global Clinical Pathology, Companion Animal Diagnostics Market, By Region, 2019-2032 (USD Billion)
16. Global Virology, Companion Animal Diagnostics Market, By Region, 2019-2032 (USD Billion)
17. Global Parasitology, Companion Animal Diagnostics Market, By Region, 2019-2032 (USD Billion)
18. Global Others, Companion Animal Diagnostics Market, By Region, 2019-2032 (USD Billion)
19. Global Companion Animal Diagnostics Market, By End-users, 2019-2032 (USD Billion)
20. Global Diagnostics Laboratories, Companion Animal Diagnostics Market, By Region, 2019-2032 (USD Billion)
21. Global Veterinary Clinics and Hospitals, Companion Animal Diagnostics Market, By Region, 2019-2032 (USD Billion)
22. Global Research Institutes, Companion Animal Diagnostics Market, By Region, 2019-2032 (USD Billion)
23. Global Home Care Settings, Companion Animal Diagnostics Market, By Region, 2019-2032 (USD Billion)
24. Global Companion Animal Diagnostics Market, By Region, 2019-2032 (USD Billion)
25. North America Companion Animal Diagnostics Market, By Animal Type, 2019-2032 (USD Billion)
26. North America Companion Animal Diagnostics Market, By Technology, 2019-2032 (USD Billion)
27. North America Companion Animal Diagnostics Market, By Application, 2019-2032 (USD Billion)
28. North America Companion Animal Diagnostics Market, By End-users, 2019-2032 (USD Billion)
29. U.S. Companion Animal Diagnostics Market, By Animal Type, 2019-2032 (USD Billion)
30. U.S. Companion Animal Diagnostics Market, By Technology, 2019-2032 (USD Billion)
31. U.S. Companion Animal Diagnostics Market, By Application, 2019-2032 (USD Billion)
32. U.S. Companion Animal Diagnostics Market, By End-users, 2019-2032 (USD Billion)
33. Canada Companion Animal Diagnostics Market, By Animal Type, 2019-2032 (USD Billion)
34. Canada Companion Animal Diagnostics Market, By Technology, 2019-2032 (USD Billion)
35. Canada Companion Animal Diagnostics Market, By Application, 2019-2032 (USD Billion)
36. Canada Companion Animal Diagnostics Market, By End-users, 2019-2032 (USD Billion)
37. Mexico Companion Animal Diagnostics Market, By Animal Type, 2019-2032 (USD Billion)
38. Mexico Companion Animal Diagnostics Market, By Technology, 2019-2032 (USD Billion)
39. Mexico Companion Animal Diagnostics Market, By Application, 2019-2032 (USD Billion)
40. Mexico Companion Animal Diagnostics Market, By End-users, 2019-2032 (USD Billion)
41. Europe Companion Animal Diagnostics Market, By Animal Type, 2019-2032 (USD Billion)
42. Europe Companion Animal Diagnostics Market, By Technology, 2019-2032 (USD Billion)
43. Europe Companion Animal Diagnostics Market, By Application, 2019-2032 (USD Billion)
44. Europe Companion Animal Diagnostics Market, By End-users, 2019-2032 (USD Billion)
45. Germany Companion Animal Diagnostics Market, By Animal Type, 2019-2032 (USD Billion)
46. Germany Companion Animal Diagnostics Market, By Technology, 2019-2032 (USD Billion)
47. Germany Companion Animal Diagnostics Market, By Application, 2019-2032 (USD Billion)
48. Germany Companion Animal Diagnostics Market, By End-users, 2019-2032 (USD Billion)
49. France Companion Animal Diagnostics Market, By Animal Type, 2019-2032 (USD Billion)
50. France Companion Animal Diagnostics Market, By Technology, 2019-2032 (USD Billion)
51. France Companion Animal Diagnostics Market, By Application, 2019-2032 (USD Billion)
52. France Companion Animal Diagnostics Market, By End-users, 2019-2032 (USD Billion)
53. U.K. Companion Animal Diagnostics Market, By Animal Type, 2019-2032 (USD Billion)
54. U.K. Companion Animal Diagnostics Market, By Technology, 2019-2032 (USD Billion)
55. U.K. Companion Animal Diagnostics Market, By Application, 2019-2032 (USD Billion)
56. U.K. Companion Animal Diagnostics Market, By End-users, 2019-2032 (USD Billion)
57. Italy Companion Animal Diagnostics Market, By Animal Type, 2019-2032 (USD Billion)
58. Italy Companion Animal Diagnostics Market, By Technology, 2019-2032 (USD Billion)
59. Italy Companion Animal Diagnostics Market, By Application, 2019-2032 (USD Billion)
60. Italy Companion Animal Diagnostics Market, By End-users, 2019-2032 (USD Billion)
61. Spain Companion Animal Diagnostics Market, By Animal Type, 2019-2032 (USD Billion)
62. Spain Companion Animal Diagnostics Market, By Technology, 2019-2032 (USD Billion)
63. Spain Companion Animal Diagnostics Market, By Application, 2019-2032 (USD Billion)
64. Spain Companion Animal Diagnostics Market, By End-users, 2019-2032 (USD Billion)
65. Asia Pacific Companion Animal Diagnostics Market, By Animal Type, 2019-2032 (USD Billion)
66. Asia Pacific Companion Animal Diagnostics Market, By Technology, 2019-2032 (USD Billion)
67. Asia Pacific Companion Animal Diagnostics Market, By Application, 2019-2032 (USD Billion)
68. Asia Pacific Companion Animal Diagnostics Market, By End-users, 2019-2032 (USD Billion)
69. Japan Companion Animal Diagnostics Market, By Animal Type, 2019-2032 (USD Billion)
70. Japan Companion Animal Diagnostics Market, By Technology, 2019-2032 (USD Billion)
71. Japan Companion Animal Diagnostics Market, By Application, 2019-2032 (USD Billion)
72. Japan Companion Animal Diagnostics Market, By End-users, 2019-2032 (USD Billion)
73. China Companion Animal Diagnostics Market, By Animal Type, 2019-2032 (USD Billion)
74. China Companion Animal Diagnostics Market, By Technology, 2019-2032 (USD Billion)
75. China Companion Animal Diagnostics Market, By Application, 2019-2032 (USD Billion)
76. China Companion Animal Diagnostics Market, By End-users, 2019-2032 (USD Billion)
77. India Companion Animal Diagnostics Market, By Animal Type, 2019-2032 (USD Billion)
78. India Companion Animal Diagnostics Market, By Technology, 2019-2032 (USD Billion)
79. India Companion Animal Diagnostics Market, By Application, 2019-2032 (USD Billion)
80. India Companion Animal Diagnostics Market, By End-users, 2019-2032 (USD Billion)
81. South America Companion Animal Diagnostics Market, By Animal Type, 2019-2032 (USD Billion)
82. South America Companion Animal Diagnostics Market, By Technology, 2019-2032 (USD Billion)
83. South America Companion Animal Diagnostics Market, By Application, 2019-2032 (USD Billion)
84. South America Companion Animal Diagnostics Market, By End-users, 2019-2032 (USD Billion)
85. Brazil Companion Animal Diagnostics Market, By Animal Type, 2019-2032 (USD Billion)
86. Brazil Companion Animal Diagnostics Market, By Technology, 2019-2032 (USD Billion)
87. Brazil Companion Animal Diagnostics Market, By Application, 2019-2032 (USD Billion)
88. BrazilCompanion Animal Diagnostics Market, By End-users, 2019-2032 (USD Billion)
89. Middle East and Africa Companion Animal Diagnostics Market, By Animal Type, 2019-2032 (USD Billion)
90. Middle East and Africa Companion Animal Diagnostics Market, By Technology, 2019-2032 (USD Billion)
91. Middle East and Africa Companion Animal Diagnostics Market, By Application, 2019-2032 (USD Billion)
92. Middle East and Africa Companion Animal Diagnostics Market, By End-users, 2019-2032 (USD Billion)
93. UAE Companion Animal Diagnostics Market, By Animal Type, 2019-2032 (USD Billion)
94. UAE Companion Animal Diagnostics Market, By Technology, 2019-2032 (USD Billion)
95. UAE Companion Animal Diagnostics Market, By Application, 2019-2032 (USD Billion)
96. UAE Companion Animal Diagnostics Market, By End-users, 2019-2032 (USD Billion)
97. South Africa Companion Animal Diagnostics Market, By Animal Type, 2019-2032 (USD Billion)
98. South Africa Companion Animal Diagnostics Market, By Technology, 2019-2032 (USD Billion)
99. South Africa Companion Animal Diagnostics Market, By Application, 2019-2032 (USD Billion)
100. South Africa Companion Animal Diagnostics Market, By End-users, 2019-2032 (USD Billion)
List of Figures
1. Global Companion Animal Diagnostics Market Segmentation
2. Companion Animal Diagnostics Market: Research Methodology
3. Market Size Estimation Methodology: Bottom-Up Approach
4. Market Size Estimation Methodology: Top-Down Approach
5. Data Triangulation
6. Porter’s Five Forces Analysis
7. Value Chain Analysis
8. Global Companion Animal Diagnostics Market Attractiveness Analysis by Animal Type
9. Global Companion Animal Diagnostics Market Attractiveness Analysis by Technology
10. Global Companion Animal Diagnostics Market Attractiveness Analysis by Application
11. Global Companion Animal Diagnostics Market Attractiveness Analysis by End-users
12. Global Companion Animal Diagnostics Market Attractiveness Analysis by Region
13. Global Companion Animal Diagnostics Market: Dynamics
14. Global Companion Animal Diagnostics Market Share by Animal Type (2022 & 2032)
15. Global Companion Animal Diagnostics Market Share by Technology (2022 & 2032)
16. Global Companion Animal Diagnostics Market Share by Application (2022 & 2032)
17. Global Companion Animal Diagnostics Market Share by End-users (2022 & 2032)
18. Global Companion Animal Diagnostics Market Share by Regions (2022 & 2032)
19. Global Companion Animal Diagnostics Market Share by Company (2022)
This study forecasts revenue at global, regional, and country levels from 2019 to 2032. The Brainy Insights has segmented the global companion animal diagnostics market based on below mentioned segments:
Global Companion Animal Diagnostics Market by Animal Type:
Global Companion Animal Diagnostics Market by Technology:
Global Companion Animal Diagnostics Market by Application:
Global Companion Animal Diagnostics Market by End-users:
Global Companion Animal Diagnostics Market by Region:
Research has its special purpose to undertake marketing efficiently. In this competitive scenario, businesses need information across all industry verticals; the information about customer wants, market demand, competition, industry trends, distribution channels etc. This information needs to be updated regularly because businesses operate in a dynamic environment. Our organization, The Brainy Insights incorporates scientific and systematic research procedures in order to get proper market insights and industry analysis for overall business success. The analysis consists of studying the market from a miniscule level wherein we implement statistical tools which helps us in examining the data with accuracy and precision.
Our research reports feature both; quantitative and qualitative aspects for any market. Qualitative information for any market research process are fundamental because they reveal the customer needs and wants, usage and consumption for any product/service related to a specific industry. This in turn aids the marketers/investors in knowing certain perceptions of the customers. Qualitative research can enlighten about the different product concepts and designs along with unique service offering that in turn, helps define marketing problems and generate opportunities. On the other hand, quantitative research engages with the data collection process through interviews, e-mail interactions, surveys and pilot studies. Quantitative aspects for the market research are useful to validate the hypotheses generated during qualitative research method, explore empirical patterns in the data with the help of statistical tools, and finally make the market estimations.
The Brainy Insights offers comprehensive research and analysis, based on a wide assortment of factual insights gained through interviews with CXOs and global experts and secondary data from reliable sources. Our analysts and industry specialist assume vital roles in building up statistical tools and analysis models, which are used to analyse the data and arrive at accurate insights with exceedingly informative research discoveries. The data provided by our organization have proven precious to a diverse range of companies, facilitating them to address issues such as determining which products/services are the most appealing, whether or not customers use the product in the manner anticipated, the purchasing intentions of the market and many others.
Our research methodology encompasses an idyllic combination of primary and secondary initiatives. Key phases involved in this process are listed below:

The phase involves the gathering and collecting of market data and its related information with the help of different sources & research procedures.

The data procurement stage involves in data gathering and collecting through various data sources.
This stage involves in extensive research. These data sources includes:
Purchased Database: Purchased databases play a crucial role in estimating the market sizes irrespective of the domain. Our purchased database includes:
Primary Research: The Brainy Insights interacts with leading companies and experts of the concerned domain to develop the analyst team’s market understanding and expertise. It improves and substantiates every single data presented in the market reports. Primary research mainly involves in telephonic interviews, E-mail interactions and face-to-face interviews with the raw material providers, manufacturers/producers, distributors, & independent consultants. The interviews that we conduct provides valuable data on market size and industry growth trends prevailing in the market. Our organization also conducts surveys with the various industry experts in order to gain overall insights of the industry/market. For instance, in healthcare industry we conduct surveys with the pharmacists, doctors, surgeons and nurses in order to gain insights and key information of a medical product/device/equipment which the customers are going to usage. Surveys are conducted in the form of questionnaire designed by our own analyst team. Surveys plays an important role in primary research because surveys helps us to identify the key target audiences of the market. Additionally, surveys helps to identify the key target audience engaged with the market. Our survey team conducts the survey by targeting the key audience, thus gaining insights from them. Based on the perspectives of the customers, this information is utilized to formulate market strategies. Moreover, market surveys helps us to understand the current competitive situation of the industry. To be precise, our survey process typically involve with the 360 analysis of the market. This analytical process begins by identifying the prospective customers for a product or service related to the market/industry to obtain data on how a product/service could fit into customers’ lives.

Secondary Research: The secondary data sources includes information published by the on-profit organizations such as World bank, WHO, company fillings, investor presentations, annual reports, national government documents, statistical databases, blogs, articles, white papers and others. From the annual report, we analyse a company’s revenue to understand the key segment and market share of that organization in a particular region. We analyse the company websites and adopt the product mapping technique which is important for deriving the segment revenue. In the product mapping method, we select and categorize the products offered by the companies catering to domain specific market, deduce the product revenue for each of the companies so as to get overall estimation of the market size. We also source data and analyses trends based on information received from supply side and demand side intermediaries in the value chain. The supply side denotes the data gathered from supplier, distributor, wholesaler and the demand side illustrates the data gathered from the end customers for respective market domain.

The supply side for a domain specific market is analysed by:
The demand side for the market is estimated through:
In-house Library: Apart from these third-party sources, we have our in-house library of qualitative and quantitative information. Our in-house database includes market data for various industry and domains. These data are updated on regular basis as per the changing market scenario. Our library includes, historic databases, internal audit reports and archives.
Sometimes there are instances where there is no metadata or raw data available for any domain specific market. For those cases, we use our expertise to forecast and estimate the market size in order to generate comprehensive data sets. Our analyst team adopt a robust research technique in order to produce the estimates:
Data Synthesis: This stage involves the analysis & mapping of all the information obtained from the previous step. It also involves in scrutinizing the data for any discrepancy observed while data gathering related to the market. The data is collected with consideration to the heterogeneity of sources. Robust scientific techniques are in place for synthesizing disparate data sets and provide the essential contextual information that can orient market strategies. The Brainy Insights has extensive experience in data synthesis where the data passes through various stages:


Market Deduction & Formulation: The final stage comprises of assigning data points at appropriate market spaces so as to deduce feasible conclusions. Analyst perspective & subject matter expert based holistic form of market sizing coupled with industry analysis also plays a crucial role in this stage.
This stage involves in finalization of the market size and numbers that we have collected from data integration step. With data interpolation, it is made sure that there is no gap in the market data. Successful trend analysis is done by our analysts using extrapolation techniques, which provide the best possible forecasts for the market.
Data Validation & Market Feedback: Validation is the most important step in the process. Validation & re-validation via an intricately designed process helps us finalize data-points to be used for final calculations.

The Brainy Insights interacts with leading companies and experts of the concerned domain to develop the analyst team’s market understanding and expertise. It improves and substantiates every single data presented in the market reports. The data validation interview and discussion panels are typically composed of the most experienced industry members. The participants include, however, are not limited to:
Moreover, we always validate our data and findings through primary respondents from all the major regions we are working on.


Free Customization
Fortune 500 Clients
Free Yearly Update On Purchase Of Multi/Corporate License
Companies Served Till Date