- +1-315-215-1633
- sales@thebrainyinsights.com

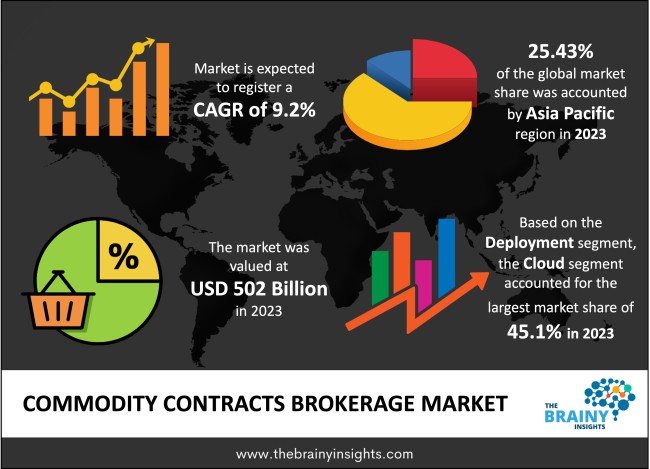
The global Commodity Contracts Brokerage market was valued at USD 502 billion in 2023 and growing at a CAGR of 9.2% from 2024 to 2033. The market is expected to reach USD 1210.4 billion by 2033. Rising digitalization of trading and increasing ESG (Environmental, Social, and Governance) investing in the global market are the major factors driving the growth of the Commodity Contracts Brokerage Market. Whereas, rising geopolitical tensions in the global market and the Development of advanced Execution Algorithms may propel the growth of the Commodity Contracts Brokerage Market in the period forecasted.
Commodity Contracts Brokerage is a business wherein the commodities buy and sell the commodity contracts on behalf of the clients. The companies transact specific commodities (quantity and quality) on future dates. The commodities include various domains: Agricultural products, energy resources, metals, and financial commodities.
The commodity contractors act as a middleman between the buyers and sellers. Thus, Commodities contracts brokerage via Cloud, In-Premise for Large and SMEs. The Commodity Contracts Brokerage is available for varied End-User Industries, such as Banks, Brokerage Firms, and Investment Management Firms among others.
Get an overview of this study by requesting a free sample
Rising digitalization of trading activities – Rising digitalization of trading is one major factor that boosts the growth of the Commodities Contracts Brokerage Market. In the current scenario, almost all the brokerage firms went towards online transactions for buying/selling of stocks, shares, ETFs, Mutual funds, and others. Further, whilst trading in the commodities market, the buyers/sellers also get advice and solutions for their products. This in turn also fuels the growth of the Commodities Contracts Brokerage in the market in the period forecasted.
High risk of bankruptcy of the brokerage firms –Higher risk of bankruptcy is one major factor that poses a significant threat in the Commodities Brokerage Market. Owing to its potential to disrupt financial stability and degrade the trust-ability of the market. Various factors may contribute to its potential risks, such as market volatility, economic instability, and lack of risk management by the brokerage firms among others.
Rising geopolitical tensions in the global market– Rising geopolitical tensions may boost the growth of the Commodities Contracts Brokerage Market. Geopolitical tensions include political uncertainties, rivalries between the countries, disputes, and pitfalls among intra-nations and international and others. Thus businesses seek the help of these brokerage firms to adapt to changing trade scenarios, diversify portfolios, and other major regulatory changes. This leads to fueling up the growth of the Commodities Contracts Brokerage Market in the long run.
The regions analyzed for the market include North America, Europe, South America, Asia Pacific, the Middle East, and Africa. North America dominated the global Commodity Contracts Brokerage market, accounting for 34% of the total market. Owing to the settlement of well-established players in the region, financial market innovations and readiness to adapt towards regulatory changes in the North American market. Whereas, Asia Pacific is the fastest growing region post North America, owing to increasing numbers of customers in India, China, Japan, and other Asia Pacific countries.
Asia Pacific Region Commodity Contracts Brokerage Market Share in 2023 - 25.43%
www.thebrainyinsights.com
Check the geographical analysis of this market by requesting a free sample
The dominant sector in the market is the Cloud, securing a substantial 45.1% share in 2023. This is attributed to the growing utilization of cloud services for storing and managing commodities market updates. It is also recognized as the fastest-growing segment, primarily propelled by the rising adoption of commodities trading among large-scale businesses worldwide. The increasing awareness of the importance of secure and safe transactions, coupled with the trend of migrating updates to the cloud, significantly contributes to the Cloud segment's rapid expansion.
The Enterprise Segment is led by the dominance of Large Enterprises, securing approximately 45.76% of the market share. This leadership position is attributed to the substantial investments and capital at their disposal. The significant financial resources enable large enterprises to have a higher risk-taking capacity, influencing the likelihood of both profits and losses. The prevalence of large enterprises in this segment is a result of the escalating number of these entities making substantial investments, thereby establishing their supremacy in the Enterprise Size category. Whereas, Small and Medium-sized Enterprises (SMEs) represent the fastest-growing segment in the market. This growth is fueled by factors such as globalization, supportive government policies, heightened awareness and adoption of technology, and an increasing willingness among SMEs to take on more significant risks.
The End-User Industry is predominantly led by brokerage firms, commanding a substantial 43.12% of the market share. This segment is also witnessing rapid growth, primarily driven by the dual role played by brokerage firms as both suppliers of tools and advisers to other firms. These brokerage entities not only offer advice to investment firms regarding commodities but also provide comprehensive analyses encompassing charts, graphs, trends, and forecasts based on the performance of various commodities.
| Attribute | Description |
|---|---|
| Market Size | Revenue (USD Billion) |
| Market size value in 2023 | USD 502 Billion |
| Market size value in 2033 | USD 1210.4 Billion |
| CAGR (2024 to 2033) | 9.2% |
| Historical data | 2020-2022 |
| Base Year | 2023 |
| Forecast | 2024-2033 |
| Region | The regions analyzed for the market are Asia Pacific, Europe, South America, North America, and Middle East & Africa. Furthermore, the regions are further analyzed at the country level. |
| Segments | Deployment, Enterprise Size, End-User Industry |
As per The Brainy Insights, the size of the commodities contracts brokerage market was valued at USD 502 billion in 2023 to USD 1210.4 billion by 2033.
The global commodities contracts brokerage market is growing at a CAGR of 9.2% during the forecast period 2023-2033.
The Asia Pacific region emerged as the largest market for the commodities contracts brokerage.
The rising digitalization of trading activities will influence the market's growth.
1. Introduction
1.1. Objectives of the Study
1.2. Market Definition
1.3. Research Scope
1.4. Currency
1.5. Key Target Audience
2. Research Methodology and Assumptions
3. Executive Summary
4. Premium Insights
4.1. Porter’s Five Forces Analysis
4.2. Value Chain Analysis
4.3. Top Investment Pockets
4.3.1. Market Attractiveness Analysis by Deployment
4.3.2. Market Attractiveness Analysis by Enterprise Size
4.3.3. Market Attractiveness Analysis by End-User Industry
4.3.4. Market Attractiveness Analysis by Region
4.4. Industry Trends
5. Market Dynamics
5.1. Market Evaluation
5.2. Drivers
5.2.1. Rising digitalization of trading activities
5.2.2. Increasing ESG (Environmental, Social, and Governance) investing in the global market
5.3. Restraints
5.3.1. High risk of bankruptcy of the brokerage firms
5.4. Opportunities
5.4.1. Rising geopolitical tensions in the global market
5.4.2. Development of advanced Execution Algorithms
5.5. Challenges
5.5.1. Price volatility and cost-trade off
6. Global Commodity Contracts Brokerage Market Analysis and Forecast, By Deployment
6.1. Segment Overview
6.2. Cloud
6.3. On-Premise
7. Global Commodity Contracts Brokerage Market Analysis and Forecast, By Enterprise Size
7.1. Segment Overview
7.2. Large Enterprises
7.3. Small Medium Enterprises (SMEs)
8. Global Commodity Contracts Brokerage Market Analysis and Forecast, By End-User Industry
8.1. Segment Overview
8.2. Banks
8.3. Brokerage Firms
8.4. Investment Management Firms
8.5. Trading Exchange Firms
8.6. Others
9. Global Commodity Contracts Brokerage Market Analysis and Forecast, By Regional Analysis
9.1. Segment Overview
9.2. North America
9.2.1. U.S.
9.2.2. Canada
9.2.3. Mexico
9.3. Europe
9.3.1. Germany
9.3.2. France
9.3.3. U.K.
9.3.4. Italy
9.3.5. Spain
9.4. Asia-Pacific
9.4.1. Japan
9.4.2. China
9.4.3. India
9.5. South America
9.5.1. Brazil
9.6. Middle East and Africa
9.6.1. UAE
9.6.2. South Africa
10. Global Commodity Contracts Brokerage Market-Competitive Landscape
10.1. Overview
10.2. Market Share of Key Players in Global Commodity Contracts Brokerage Market
10.2.1. Global Company Market Share
10.2.2. North America Company Market Share
10.2.3. Europe Company Market Share
10.2.4. APAC Company Market Share
10.3. Competitive Situations and Trends
10.3.1. Product Launches and Developments
10.3.2. Partnerships, Collaborations, and Agreements
10.3.3. Mergers & Acquisitions
10.3.4. Expansions
11. Company Profiles
11.1. TD Ameritrade
11.1.1. Business Overview
11.1.2. Company Snapshot
11.1.3. Company Market Share Analysis
11.1.4. Company Product Portfolio
11.1.5. Recent Developments
11.1.6. SWOT Analysis
11.2. Interactive Brokers LLC
11.2.1. Business Overview
11.2.2. Company Snapshot
11.2.3. Company Market Share Analysis
11.2.4. Company Product Portfolio
11.2.5. Recent Developments
11.2.6. SWOT Analysis
11.3. Zerodha Broking Ltd
11.3.1. Business Overview
11.3.2. Company Snapshot
11.3.3. Company Market Share Analysis
11.3.4. Company Product Portfolio
11.3.5. Recent Developments
11.3.6. SWOT Analysis
11.4. The Vanguard Group
11.4.1. Business Overview
11.4.2. Company Snapshot
11.4.3. Company Market Share Analysis
11.4.4. Company Product Portfolio
11.4.5. Recent Developments
11.4.6. SWOT Analysis
11.5. Revolut Ltd
11.5.1. Business Overview
11.5.2. Company Snapshot
11.5.3. Company Market Share Analysis
11.5.4. Company Product Portfolio
11.5.5. Recent Developments
11.5.6. SWOT Analysis
11.6. Fidelity Investments Inc
11.6.1. Business Overview
11.6.2. Company Snapshot
11.6.3. Company Market Share Analysis
11.6.4. Company Product Portfolio
11.6.5. Recent Developments
11.6.6. SWOT Analysis
11.7. The Charles Schwab Corporation
11.7.1. Business Overview
11.7.2. Company Snapshot
11.7.3. Company Market Share Analysis
11.7.4. Company Product Portfolio
11.7.5. Recent Developments
11.7.6. SWOT Analysis
11.8. Degiro
11.8.1. Business Overview
11.8.2. Company Snapshot
11.8.3. Company Market Share Analysis
11.8.4. Company Product Portfolio
11.8.5. Recent Developments
11.8.6. SWOT Analysis
11.9. E-Trade Financial Corporation
11.9.1. Business Overview
11.9.2. Company Snapshot
11.9.3. Company Market Share Analysis
11.9.4. Company Product Portfolio
11.9.5. Recent Developments
11.9.6. SWOT Analysis
11.10. E-Trade Financial Corporation
11.10.1. Business Overview
11.10.2. Company Snapshot
11.10.3. Company Market Share Analysis
11.10.4. Company Product Portfolio
11.10.5. Recent Developments
11.10.6. SWOT Analysis
List of Table
1. Global Commodity Contracts Brokerage Market, By Deployment, 2020-2033(USD Billion)
2. Global Cloud, Commodity Contracts Brokerage Market, By Region, 2020-2033(USD Billion)
3. Global On-Premises, Commodity Contracts Brokerage Market, By Region, 2020-2033(USD Billion)
4. Global Commodity Contracts Brokerage Market, By Enterprise Size, 2020-2033(USD Billion)
5. Global Large Enterprises, Commodity Contracts Brokerage Market, By Region, 2020-2033(USD Billion)
6. Global Small Medium Enterprises (SMEs), Commodity Contracts Brokerage Market, By Region, 2020-2033(USD Billion)
7. Global Commodity Contracts Brokerage Market, By End-User Industry, 2020-2033(USD Billion)
8. Global Banks, Commodity Contracts Brokerage Market, By Region, 2020-2033(USD Billion)
9. Global Brokerage Firms, Commodity Contracts Brokerage Market, By Region, 2020-2033(USD Billion)
10. Global Investment Management Firms, Commodity Contracts Brokerage Market, By Region, 2020-2033(USD Billion)
11. Global Trading Exchange Firms, Commodity Contracts Brokerage Market, By Region, 2020-2033(USD Billion)
12. Global Others, Commodity Contracts Brokerage Market, By Region, 2020-2033(USD Billion)
13. North America Commodity Contracts Brokerage Market, By Deployment, 2020-2033(USD Billion)
14. North America Commodity Contracts Brokerage Market, By Enterprise Size, 2020-2033(USD Billion)
15. North America Commodity Contracts Brokerage Market, By End-User Industry, 2020-2033(USD Billion)
16. U.S. Commodity Contracts Brokerage Market, By Deployment, 2020-2033(USD Billion)
17. U.S. Commodity Contracts Brokerage Market, By Enterprise Size, 2020-2033(USD Billion)
18. U.S. Commodity Contracts Brokerage Market, By End-User Industry, 2020-2033(USD Billion)
19. Canada Commodity Contracts Brokerage Market, By Deployment, 2020-2033(USD Billion)
20. Canada Commodity Contracts Brokerage Market, By Enterprise Size, 2020-2033(USD Billion)
21. Canada Commodity Contracts Brokerage Market, By End-User Industry, 2020-2033(USD Billion)
22. Mexico Commodity Contracts Brokerage Market, By Deployment, 2020-2033(USD Billion)
23. Mexico Commodity Contracts Brokerage Market, By Enterprise Size, 2020-2033(USD Billion)
24. Mexico Commodity Contracts Brokerage Market, By End-User Industry, 2020-2033(USD Billion)
25. Europe Commodity Contracts Brokerage Market, By Deployment, 2020-2033(USD Billion)
26. Europe Commodity Contracts Brokerage Market, By Enterprise Size, 2020-2033(USD Billion)
27. Europe Commodity Contracts Brokerage Market, By End-User Industry, 2020-2033(USD Billion)
28. Germany Commodity Contracts Brokerage Market, By Deployment, 2020-2033(USD Billion)
29. Germany Commodity Contracts Brokerage Market, By Enterprise Size, 2020-2033(USD Billion)
30. Germany Commodity Contracts Brokerage Market, By End-User Industry, 2020-2033(USD Billion)
31. France Commodity Contracts Brokerage Market, By Deployment, 2020-2033(USD Billion)
32. France Commodity Contracts Brokerage Market, By Enterprise Size, 2020-2033(USD Billion)
33. France Commodity Contracts Brokerage Market, By End-User Industry, 2020-2033(USD Billion)
34. U.K. Commodity Contracts Brokerage Market, By Deployment, 2020-2033(USD Billion)
35. U.K. Commodity Contracts Brokerage Market, By Enterprise Size, 2020-2033(USD Billion)
36. U.K. Commodity Contracts Brokerage Market, By End-User Industry, 2020-2033(USD Billion)
37. Italy Commodity Contracts Brokerage Market, By Deployment, 2020-2033(USD Billion)
38. Italy Commodity Contracts Brokerage Market, By Enterprise Size, 2020-2033(USD Billion)
39. Italy Commodity Contracts Brokerage Market, By End-User Industry, 2020-2033(USD Billion)
40. Spain Commodity Contracts Brokerage Market, By Deployment, 2020-2033(USD Billion)
41. Spain Commodity Contracts Brokerage Market, By Enterprise Size, 2020-2033(USD Billion)
42. Spain Commodity Contracts Brokerage Market, By End-User Industry, 2020-2033(USD Billion)
43. Asia Pacific Commodity Contracts Brokerage Market, By Deployment, 2020-2033(USD Billion)
44. Asia Pacific Commodity Contracts Brokerage Market, By Enterprise Size, 2020-2033(USD Billion)
45. Asia Pacific Commodity Contracts Brokerage Market, By End-User Industry, 2020-2033(USD Billion)
46. Japan Commodity Contracts Brokerage Market, By Deployment, 2020-2033(USD Billion)
47. Japan Commodity Contracts Brokerage Market, By Enterprise Size, 2020-2033(USD Billion)
48. Japan Commodity Contracts Brokerage Market, By End-User Industry, 2020-2033(USD Billion)
49. China Commodity Contracts Brokerage Market, By Deployment, 2020-2033(USD Billion)
50. China Commodity Contracts Brokerage Market, By Enterprise Size, 2020-2033(USD Billion)
51. China Commodity Contracts Brokerage Market, By End-User Industry, 2020-2033(USD Billion)
52. India Commodity Contracts Brokerage Market, By Deployment, 2020-2033(USD Billion)
53. India Commodity Contracts Brokerage Market, By Enterprise Size, 2020-2033(USD Billion)
54. India Commodity Contracts Brokerage Market, By End-User Industry, 2020-2033(USD Billion)
55. South America Commodity Contracts Brokerage Market, By Deployment, 2020-2033(USD Billion)
56. South America Commodity Contracts Brokerage Market, By Enterprise Size, 2020-2033(USD Billion)
57. South America Commodity Contracts Brokerage Market, By End-User Industry, 2020-2033(USD Billion)
58. Brazil Commodity Contracts Brokerage Market, By Deployment, 2020-2033(USD Billion)
59. Brazil Commodity Contracts Brokerage Market, By Enterprise Size, 2020-2033(USD Billion)
60. Brazil Commodity Contracts Brokerage Market, By End-User Industry, 2020-2033(USD Billion)
61. Middle East and Africa Commodity Contracts Brokerage Market, By Deployment, 2020-2033(USD Billion)
62. Middle East and Africa Commodity Contracts Brokerage Market, By Enterprise Size, 2020-2033(USD Billion)
63. Middle East and Africa Commodity Contracts Brokerage Market, By End-User Industry, 2020-2033(USD Billion)
64. UAE Commodity Contracts Brokerage Market, By Deployment, 2020-2033(USD Billion)
65. UAE Commodity Contracts Brokerage Market, By Enterprise Size, 2020-2033(USD Billion)
66. UAE Commodity Contracts Brokerage Market, By End-User Industry, 2020-2033(USD Billion)
67. South Africa Commodity Contracts Brokerage Market, By Deployment, 2020-2033(USD Billion)
68. South Africa Commodity Contracts Brokerage Market, By Enterprise Size, 2020-2033(USD Billion)
69. South Africa Commodity Contracts Brokerage Market, By End-User Industry, 2020-2033(USD Billion)
List of Figures
1. Global Commodity Contracts Brokerage Market Segmentation
2. Global Commodity Contracts Brokerage Market: Research Methodology
3. Market Size Estimation Methodology: Bottom-Up Approach
4. Market Size Estimation Methodology: Top-Down Approach
5. Data Triangulation
6. Porter’s Five Forces Analysis
7. Value Chain Analysis
8. Global Commodity Contracts Brokerage Market Attractiveness Analysis by Deployment
9. Global Commodity Contracts Brokerage Market Attractiveness Analysis by Enterprise Size
10. Global Commodity Contracts Brokerage Market Attractiveness Analysis by Region
11. Global Commodity Contracts Brokerage Market: Dynamics
12. Global Commodity Contracts Brokerage Market Share by Deployment (2024 & 2033)
13. Global Commodity Contracts Brokerage Market Share by Enterprise Size (2024 & 2033)
14. Global Commodity Contracts Brokerage Market Share by Regions (2024 & 2033)
15. Global Commodity Contracts Brokerage Market Share by Company (2023)
This study forecasts revenue at global, regional, and country levels from 2020 to 2033. The Brainy Insights has segmented the global commodities contracts brokerage market based on below-mentioned segments:
Global Commodities Contracts Brokerage Market by Deployment:
Global Commodities Contracts Brokerage Market by Enterprise Size:
Global Commodities Contracts Brokerage Market by End-User Industry:
Global Commodities Contracts Brokerage Market by Region:
Research has its special purpose to undertake marketing efficiently. In this competitive scenario, businesses need information across all industry verticals; the information about customer wants, market demand, competition, industry trends, distribution channels etc. This information needs to be updated regularly because businesses operate in a dynamic environment. Our organization, The Brainy Insights incorporates scientific and systematic research procedures in order to get proper market insights and industry analysis for overall business success. The analysis consists of studying the market from a miniscule level wherein we implement statistical tools which helps us in examining the data with accuracy and precision.
Our research reports feature both; quantitative and qualitative aspects for any market. Qualitative information for any market research process are fundamental because they reveal the customer needs and wants, usage and consumption for any product/service related to a specific industry. This in turn aids the marketers/investors in knowing certain perceptions of the customers. Qualitative research can enlighten about the different product concepts and designs along with unique service offering that in turn, helps define marketing problems and generate opportunities. On the other hand, quantitative research engages with the data collection process through interviews, e-mail interactions, surveys and pilot studies. Quantitative aspects for the market research are useful to validate the hypotheses generated during qualitative research method, explore empirical patterns in the data with the help of statistical tools, and finally make the market estimations.
The Brainy Insights offers comprehensive research and analysis, based on a wide assortment of factual insights gained through interviews with CXOs and global experts and secondary data from reliable sources. Our analysts and industry specialist assume vital roles in building up statistical tools and analysis models, which are used to analyse the data and arrive at accurate insights with exceedingly informative research discoveries. The data provided by our organization have proven precious to a diverse range of companies, facilitating them to address issues such as determining which products/services are the most appealing, whether or not customers use the product in the manner anticipated, the purchasing intentions of the market and many others.
Our research methodology encompasses an idyllic combination of primary and secondary initiatives. Key phases involved in this process are listed below:

The phase involves the gathering and collecting of market data and its related information with the help of different sources & research procedures.

The data procurement stage involves in data gathering and collecting through various data sources.
This stage involves in extensive research. These data sources includes:
Purchased Database: Purchased databases play a crucial role in estimating the market sizes irrespective of the domain. Our purchased database includes:
Primary Research: The Brainy Insights interacts with leading companies and experts of the concerned domain to develop the analyst team’s market understanding and expertise. It improves and substantiates every single data presented in the market reports. Primary research mainly involves in telephonic interviews, E-mail interactions and face-to-face interviews with the raw material providers, manufacturers/producers, distributors, & independent consultants. The interviews that we conduct provides valuable data on market size and industry growth trends prevailing in the market. Our organization also conducts surveys with the various industry experts in order to gain overall insights of the industry/market. For instance, in healthcare industry we conduct surveys with the pharmacists, doctors, surgeons and nurses in order to gain insights and key information of a medical product/device/equipment which the customers are going to usage. Surveys are conducted in the form of questionnaire designed by our own analyst team. Surveys plays an important role in primary research because surveys helps us to identify the key target audiences of the market. Additionally, surveys helps to identify the key target audience engaged with the market. Our survey team conducts the survey by targeting the key audience, thus gaining insights from them. Based on the perspectives of the customers, this information is utilized to formulate market strategies. Moreover, market surveys helps us to understand the current competitive situation of the industry. To be precise, our survey process typically involve with the 360 analysis of the market. This analytical process begins by identifying the prospective customers for a product or service related to the market/industry to obtain data on how a product/service could fit into customers’ lives.

Secondary Research: The secondary data sources includes information published by the on-profit organizations such as World bank, WHO, company fillings, investor presentations, annual reports, national government documents, statistical databases, blogs, articles, white papers and others. From the annual report, we analyse a company’s revenue to understand the key segment and market share of that organization in a particular region. We analyse the company websites and adopt the product mapping technique which is important for deriving the segment revenue. In the product mapping method, we select and categorize the products offered by the companies catering to domain specific market, deduce the product revenue for each of the companies so as to get overall estimation of the market size. We also source data and analyses trends based on information received from supply side and demand side intermediaries in the value chain. The supply side denotes the data gathered from supplier, distributor, wholesaler and the demand side illustrates the data gathered from the end customers for respective market domain.

The supply side for a domain specific market is analysed by:
The demand side for the market is estimated through:
In-house Library: Apart from these third-party sources, we have our in-house library of qualitative and quantitative information. Our in-house database includes market data for various industry and domains. These data are updated on regular basis as per the changing market scenario. Our library includes, historic databases, internal audit reports and archives.
Sometimes there are instances where there is no metadata or raw data available for any domain specific market. For those cases, we use our expertise to forecast and estimate the market size in order to generate comprehensive data sets. Our analyst team adopt a robust research technique in order to produce the estimates:
Data Synthesis: This stage involves the analysis & mapping of all the information obtained from the previous step. It also involves in scrutinizing the data for any discrepancy observed while data gathering related to the market. The data is collected with consideration to the heterogeneity of sources. Robust scientific techniques are in place for synthesizing disparate data sets and provide the essential contextual information that can orient market strategies. The Brainy Insights has extensive experience in data synthesis where the data passes through various stages:


Market Deduction & Formulation: The final stage comprises of assigning data points at appropriate market spaces so as to deduce feasible conclusions. Analyst perspective & subject matter expert based holistic form of market sizing coupled with industry analysis also plays a crucial role in this stage.
This stage involves in finalization of the market size and numbers that we have collected from data integration step. With data interpolation, it is made sure that there is no gap in the market data. Successful trend analysis is done by our analysts using extrapolation techniques, which provide the best possible forecasts for the market.
Data Validation & Market Feedback: Validation is the most important step in the process. Validation & re-validation via an intricately designed process helps us finalize data-points to be used for final calculations.

The Brainy Insights interacts with leading companies and experts of the concerned domain to develop the analyst team’s market understanding and expertise. It improves and substantiates every single data presented in the market reports. The data validation interview and discussion panels are typically composed of the most experienced industry members. The participants include, however, are not limited to:
Moreover, we always validate our data and findings through primary respondents from all the major regions we are working on.


Free Customization
Fortune 500 Clients
Free Yearly Update On Purchase Of Multi/Corporate License
Companies Served Till Date