- +1-315-215-1633
- sales@thebrainyinsights.com

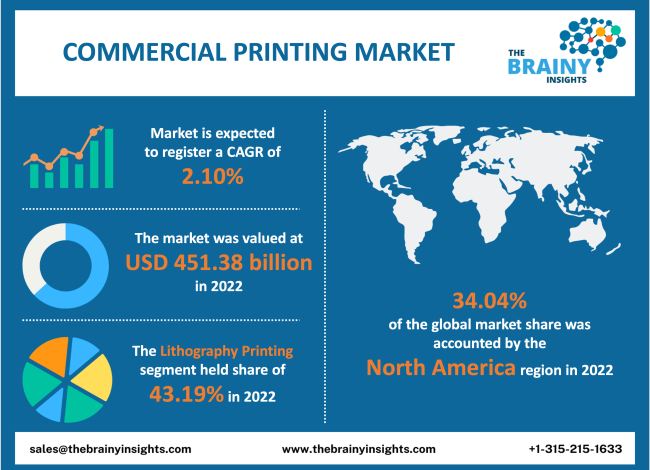
The global commercial printing market is expected to grow from USD 451.38 billion in 2022 to USD 555.65 billion by 2032, at a CAGR of 2.10% during the forecast period 2023-2032. The North American region dominated the market in 2022.
Commercial printing refers to producing printed items for companies, such as postcards, periodicals, and catalogs. It is referred to as commercial printing because the procedure typically involves enormous quantities of products. Commercial printing refers to the printing of business materials like brochures and flyers. Books, catalogs, posters, periodicals, packaging, transactional statements, and direct mail marketing materials are just a few examples of miscellaneous printed items produced by the commercial printing sector. A retail printing business might provide integrated services, including reporting, graphics, and direct ordering. Offices can print any document internally at a high page per minute without compromising print quality using a commercial printing device. A business multifunction printer offers quick, dependable, and high-quality printing services. Commercial printing comes in a wide variety suited for different applications. High-quality printing leaves a lasting impression and increases the trustworthiness of the user’s clients.
Get an overview of this study by requesting a free sample
Numerous benefits of commercial printing: Commercial printing is a crucial piece of equipment that enables companies to prepare high-quality marketing and advertising documents which helps in client retention. Using in-house printers’ restraints the constant color supply and the color options for printing, whereas commercial printing provides them with ample possibilities. Thus, the user can't choose the colors with the standard in-house printers. The commercial printing utilized by reputable printing businesses gives them vivid patterns and different options of color for their usage.
Lack of quality control systems– The quality control measures that local printers have in place are frequently absent from large commercial printers. They probably won't take the same safety measures as a locally owned business that has built strong relationships with its clients and takes pride in the goods it creates, and they might not be as willing to refund or reprint a defective order.
The increasing number of commercial businesses- Small technological companies are today experiencing fierce competition in a fast-paced business climate, where a successful commercialization strategy can ensure a company's survival and give crucial benefits such as increased turnover, earnings, and market share. However, to achieve the economic potential and value of a new product, technological companies must be able to develop an appropriate business model for its commercialization. As a result, it's critical to broaden their understanding of the business models used in high-tech industries and their involvement in new product commercialization and innovation management. Thus, most companies are willing to adapt to digital printing technologies, which can help them build their brand. Many companies are opting for commercial printing to gain a competitive edge. Therefore, this factor will provide a lucrative opportunity to the market.
Costly for mid-scale and small-scale companies - Outsourcing fees might be astronomical compared to the freedom and control of having the in-house printer. The commercial printer is usually expensive for less amount of printing, and most of the small-scale and mid-scale companies are not able to afford it. Thus, any agreement with a commercial printing company will keep the client organization liable for the standard rate and the unanticipated expenses that can occur during the printing process.
The regions analyzed for the market include North America, Europe, South America, Asia Pacific, the Middle East, and Africa. The North American region emerged as the most significant global commercial printing market, with a revenue share of 34.04% in 2022. The region has a high market growth rate due to an increasing number of commercial organizations. The North American market will be driven by investment in the marketing and advertising sector to support the commercial printing market. The growing need for high-quality printing among advertising organizations has promoted the outsourcing of commercial printing. The Asia-Pacific region is anticipated to grow lucratively during the forecast period. The market is witnessing a lucrative growth rate due to the increasing advancement in commercial printing and investment in the digital printing technological industry in countries like Japan and China. Further, the rise in end-user industries propels the market growth.
North America region Commercial Printing Market Share in 2022 - 34.04%
www.thebrainyinsights.com
Check the geographical analysis of this market by requesting a free sample
The printing segment is divided into lithography printing, digital printing, screen printing, flexographic, gravure printing, and others. The lithography printing segment dominated the market with a revenue share of 43.19% in 2022. The lithography printing segment is growing due to the rise in demand for packaging applications. There are various advantages of lithography printing, such as high-quality images and consistency in printing.
The application segment includes advertising, packaging, and publishing. The publishing segment further includes magazines, books, newspapers, and others. The packaging segment dominated the market with a revenue share of 47.10% in 2022. Packaging applications are used in diverse industries, due to which the demand for commercial printing has increased drastically. Commercial printing technology develops high-quality images and thus helps customers to level up their marketing.
The print type segment includes painting, image, printing, and others. The printing segment dominated the market with a revenue share of 41.22% in 2022. Printing is used across vast industries for promotions and advertising purposes. High-quality printing is necessary to gain attention from the target consumer base.
| Attribute | Description |
|---|---|
| Market Size | Revenue (USD Billion) |
| Market size value in 2022 | USD 451.38 Billion |
| Market size value in 2032 | USD 555.65 Billion |
| CAGR (2022 to 2032) | 2.10% |
| Historical data | 2019-2021 |
| Base Year | 2022 |
| Forecast | 2023-2032 |
| Regional Segments | The regions examined for the market are Europe, Asia Pacific, North America, South America, and Middle East & Africa. |
| Segments | The research segment is based on printing, application, and print type. |
As per The Brainy Insights, the size of the commercial printing market was valued 451.38 billion in 2022 to USD 555.65 billion by 2032.
Global commercial printing market is growing at a CAGR of 2.10% during the forecast period 2023-2032.
North America region emerged as the largest market for the commercial printing.
The market's growth will be influenced by the growing use of commercial printing in marketing and advertising applications.
The lack of quality systems could hamper the market growth.
The increasing investment by end-user industries is providing huge opportunities to the market.
1. Introduction
1.1. Objectives of the Study
1.2. Market Definition
1.3. Research Scope
1.4. Currency
1.5. Key Target Audience
2. Research Methodology and Assumptions
3. Executive Summary
4. Premium Insights
4.1. Porter’s Five Forces Analysis
4.2. Value Chain Analysis
4.3. Top Investment Pockets
4.3.1. Market Attractiveness Analysis By Printing
4.3.2. Market Attractiveness Analysis By Application
4.3.3. Market Attractiveness Analysis By Print Type
4.3.4. Market Attractiveness Analysis By Region
4.4. Industry Trends
5. Market Dynamics
5.1. Market Evaluation
5.2. Drivers
5.2.1. Increasing use of commercial printing in marketing applications
5.3. Restraints
5.3.1. Quality control issues
5.4. Opportunities
5.4.1. Increasing investment by end-user industries
5.5. Challenges
5.5.1. Less investment in developing countries
6. Global Commercial Printing Market Analysis and Forecast, By Printing
6.1. Segment Overview
6.2. Lithography Printing
6.3. Digital Printing
6.4. Screen Printing
6.5. Flexographic
6.6. Gravure Printing
6.7. Others
7. Global Commercial Printing Market Analysis and Forecast, By Application
7.1. Segment Overview
7.2. Advertising
7.3. Packaging
7.4. Publishing
7.4.1. Magazines
7.4.2. Books
7.4.3. Newspapers
7.4.4. Others
8. Global Commercial Printing Market Analysis and Forecast, By Print Type
8.1. Segment Overview
8.2. Painting
8.3. Image
8.4. Printing
8.5. Others
9. Global Commercial Printing Market Analysis and Forecast, By Regional Analysis
9.1. Segment Overview
9.2. North America
9.2.1. U.S.
9.2.2. Canada
9.2.3. Mexico
9.3. Europe
9.3.1. Germany
9.3.2. France
9.3.3. U.K.
9.3.4. Italy
9.3.5. Spain
9.4. Asia-Pacific
9.4.1. Japan
9.4.2. China
9.4.3. India
9.5. South America
9.5.1. Brazil
9.6. Middle East and Africa
9.6.1. UAE
9.6.2. South Africa
10. Global Commercial Printing Market-Competitive Landscape
10.1. Overview
10.2. Market Share of Key Players in the Commercial Printing Market
10.2.1. Global Company Market Share
10.2.2. North America Company Market Share
10.2.3. Europe Company Market Share
10.2.4. APAC Company Market Share
10.3. Competitive Situations and Trends
10.3.1. Product Launches and Developments
10.3.2. Partnerships, Collaborations, and Agreements
10.3.3. Mergers & Acquisitions
10.3.4. Expansions
11. Company Profiles
11.1. Acme Printing
11.1.1. Business Overview
11.1.2. Company Snapshot
11.1.3. Company Market Share Analysis
11.1.4. Company Product Portfolio
11.1.5. Recent Developments
11.1.6. SWOT Analysis
11.2. Quad/Graphics Inc.
11.2.1. Business Overview
11.2.2. Company Snapshot
11.2.3. Company Market Share Analysis
11.2.4. Company Product Portfolio
11.2.5. Recent Developments
11.2.6. SWOT Analysis
11.3. Cenveo
11.3.1. Business Overview
11.3.2. Company Snapshot
11.3.3. Company Market Share Analysis
11.3.4. Company Product Portfolio
11.3.5. Recent Developments
11.3.6. SWOT Analysis
11.4. RR Donnelley
11.4.1. Business Overview
11.4.2. Company Snapshot
11.4.3. Company Market Share Analysis
11.4.4. Company Product Portfolio
11.4.5. Recent Developments
11.4.6. SWOT Analysis
11.5. Transcontinental Inc.
11.5.1. Business Overview
11.5.2. Company Snapshot
11.5.3. Company Market Share Analysis
11.5.4. Company Product Portfolio
11.5.5. Recent Developments
11.5.6. SWOT Analysis
11.6. LSC Communications US LLC.
11.6.1. Business Overview
11.6.2. Company Snapshot
11.6.3. Company Market Share Analysis
11.6.4. Company Product Portfolio
11.6.5. Recent Developments
11.6.6. SWOT Analysis
11.7. Gorham Printing, Inc.
11.7.1. Business Overview
11.7.2. Company Snapshot
11.7.3. Company Market Share Analysis
11.7.4. Company Product Portfolio
11.7.5. Recent Developments
11.7.6. SWOT Analysis
11.8. Dai Nippon Printing
1.1.1. Business Overview
1.1.2. Company Snapshot
1.1.3. Company Market Share Analysis
1.1.4. Company Product Portfolio
1.1.5. Recent Developments
1.1.6. SWOT Analysis
11.9. The Magazine Printing Company
11.9.1. Business Overview
11.9.2. Company Snapshot
11.9.3. Company Market Share Analysis
11.9.4. Company Product Portfolio
11.9.5. Recent Developments
11.9.6. SWOT Analysis
11.10. Cimpress plc
11.10.1. Business Overview
11.10.2. Company Snapshot
11.10.3. Company Market Share Analysis
11.10.4. Company Product Portfolio
11.10.5. Recent Developments
11.10.6. SWOT Analysis
11.11. Quebecor World Inc
11.11.1. Business Overview
11.11.2. Company Snapshot
11.11.3. Company Market Share Analysis
11.11.4. Company Product Portfolio
11.11.5. Recent Developments
11.11.6. SWOT Analysis
11.12. HH Global
11.12.1. Business Overview
11.12.2. Company Snapshot
11.12.3. Company Market Share Analysis
11.12.4. Company Product Portfolio
11.12.5. Recent Developments
11.12.6. SWOT Analysis
List of Table
1. Global Commercial Printing Market, By Printing, 2019-2032 (USD Billion)
2. Global Lithography Printing, Commercial Printing Market, By Region, 2019-2032 (USD Billion)
3. Global Digital Printing, Commercial Printing Market, By Region, 2019-2032 (USD Billion)
4. Global Screen Printing, Commercial Printing Market, By Region, 2019-2032 (USD Billion)
5. Global Flexographic, Commercial Printing Market, By Region, 2019-2032 (USD Billion)
6. Global Gravure Printing, Commercial Printing Market, By Region, 2019-2032 (USD Billion)
7. Global Others, Commercial Printing Market, By Region, 2019-2032 (USD Billion)
8. Global Commercial Printing Market, By Application, 2019-2032 (USD Billion)
9. Global Advertising, Commercial Printing Market, By Region, 2019-2032 (USD Billion)
10. Global Packaging, Commercial Printing Market, By Region, 2019-2032 (USD Billion)
11. Global Publishing, Commercial Printing Market, By Region, 2019-2032 (USD Billion)
12. Global Commercial Printing Market, By Print Type, 2019-2032 (USD Billion)
13. Global Painting, Commercial Printing Market, By Region, 2019-2032 (USD Billion)
14. Global Image, Commercial Printing Market, By Region, 2019-2032 (USD Billion)
15. Global Printing, Commercial Printing Market, By Region, 2019-2032 (USD Billion)
16. Global Others, Commercial Printing Market, By Region, 2019-2032 (USD Billion)
17. Global Commercial Printing Market, By Region, 2019-2032 (USD Billion)
18. North America Commercial Printing Market, By Printing, 2019-2032 (USD Billion)
19. North America Commercial Printing Market, By Application, 2019-2032 (USD Billion)
20. North America Commercial Printing Market, By Print Type, 2019-2032 (USD Billion)
21. U.S. Commercial Printing Market, By Printing, 2019-2032 (USD Billion)
22. U.S. Commercial Printing Market, By Application, 2019-2032 (USD Billion)
23. U.S. Commercial Printing Market, By Print Type, 2019-2032 (USD Billion)
24. Canada Commercial Printing Market, By Printing, 2019-2032 (USD Billion)
25. Canada Commercial Printing Market, By Application, 2019-2032 (USD Billion)
26. Canada Commercial Printing Market, By Print Type, 2019-2032 (USD Billion)
27. Mexico Commercial Printing Market, By Printing, 2019-2032 (USD Billion)
28. Mexico Commercial Printing Market, By Application, 2019-2032 (USD Billion)
29. Mexico Commercial Printing Market, By Print Type, 2019-2032 (USD Billion)
30. Europe Commercial Printing Market, By Printing, 2019-2032 (USD Billion)
31. Europe Commercial Printing Market, By Application, 2019-2032 (USD Billion)
32. Europe Commercial Printing Market, By Print Type, 2019-2032 (USD Billion)
33. Germany Commercial Printing Market, By Printing, 2019-2032 (USD Billion)
34. Germany Commercial Printing Market, By Application, 2019-2032 (USD Billion)
35. Germany Commercial Printing Market, By Print Type, 2019-2032 (USD Billion)
36. France Commercial Printing Market, By Printing, 2019-2032 (USD Billion)
37. France Commercial Printing Market, By Application, 2019-2032 (USD Billion)
38. France Commercial Printing Market, By Print Type, 2019-2032 (USD Billion)
39. U.K. Commercial Printing Market, By Printing, 2019-2032 (USD Billion)
40. U.K. Commercial Printing Market, By Application, 2019-2032 (USD Billion)
41. U.K. Commercial Printing Market, By Print Type, 2019-2032 (USD Billion)
42. Italy Commercial Printing Market, By Printing, 2019-2032 (USD Billion)
43. Italy Commercial Printing Market, By Application, 2019-2032 (USD Billion)
44. Italy Commercial Printing Market, By Print Type, 2019-2032 (USD Billion)
45. Spain Commercial Printing Market, By Printing, 2019-2032 (USD Billion)
46. Spain Commercial Printing Market, By Application, 2019-2032 (USD Billion)
47. Spain Commercial Printing Market, By Print Type, 2019-2032 (USD Billion)
48. Asia Pacific Commercial Printing Market, By Printing, 2019-2032 (USD Billion)
49. Asia Pacific Commercial Printing Market, By Application, 2019-2032 (USD Billion)
50. Asia Pacific Commercial Printing Market, By Print Type, 2019-2032 (USD Billion)
51. Japan Commercial Printing Market, By Printing, 2019-2032 (USD Billion)
52. Japan Commercial Printing Market, By Application 2019-2032 (USD Billion)
53. Japan Commercial Printing Market, By Print Type, 2019-2032 (USD Billion)
54. China Commercial Printing Market, By Printing, 2019-2032 (USD Billion)
55. China Commercial Printing Market, By Application, 2019-2032 (USD Billion)
56. China Commercial Printing Market, By Print Type, 2019-2032 (USD Billion)
57. India Commercial Printing Market, By Printing, 2019-2032 (USD Billion)
58. India Commercial Printing Market, By Application, 2019-2032 (USD Billion)
59. India Commercial Printing Market, By Print Type, 2019-2032 (USD Billion)
60. South America Commercial Printing Market, By Printing, 2019-2032 (USD Billion)
61. South America Commercial Printing Market, By Application, 2019-2032 (USD Billion)
62. South America Commercial Printing Market, By Print Type, 2019-2032 (USD Billion)
63. Brazil Commercial Printing Market, By Printing, 2019-2032 (USD Billion)
64. Brazil Commercial Printing Market, By Application, 2019-2032 (USD Billion)
65. Brazil Commercial Printing Market, By Print Type, 2019-2032 (USD Billion)
66. Middle East and Africa Commercial Printing Market, By Printing, 2019-2032 (USD Billion)
67. Middle East and Africa Commercial Printing Market, By Application, 2019-2032 (USD Billion)
68. Middle East and Africa Commercial Printing Market, By Print Type, 2019-2032 (USD Billion)
69. UAE Commercial Printing Market, By Printing, 2019-2032 (USD Billion)
70. UAE Commercial Printing Market, By Application, 2019-2032 (USD Billion)
71. UAE Commercial Printing Market, By Print Type, 2019-2032 (USD Billion)
72. South Africa Commercial Printing Market, By Printing, 2019-2032 (USD Billion)
73. South Africa Commercial Printing Market, By Application, 2019-2032 (USD Billion)
74. South Africa Commercial Printing Market, By Print Type, 2019-2032 (USD Billion)
List of Figures
1. Global Commercial Printing Market Segmentation
2. Commercial Printing Market: Research Methodology
3. Market Size Estimation Methodology: Bottom-Up Approach
4. Market Size Estimation Methodology: Top-Down Approach
5. Data Triangulation
6. Porter’s Five Forces Analysis
7. Value Chain Analysis
8. Global Commercial Printing Market Attractiveness Analysis By Printing
9. Global Commercial Printing Market Attractiveness Analysis By Application
10. Global Commercial Printing Market Attractiveness Analysis By Print Type
11. Global Commercial Printing Market Attractiveness Analysis By Region
12. Global Commercial Printing Market: Dynamics
13. Global Commercial Printing Market Share by Printing (2022 & 2032)
14. Global Commercial Printing Market Share by Application (2022 & 2032)
15. Global Commercial Printing Market Share by Print Type (2022 & 2032)
16. Global Commercial Printing Market Share by Regions (2022 & 2032)
17. Global Commercial Printing Market Share by Company (2022)
This study forecasts revenue at global, regional, and country levels from 2019 to 2032. The Brainy Insights has segmented the global commercial printing market based on below mentioned segments:
Global Commercial Printing Market by Printing:
Global Commercial Printing Market by Application:
Global Commercial Printing Market by Print Type:
Global Commercial Printing Market by Region:
Research has its special purpose to undertake marketing efficiently. In this competitive scenario, businesses need information across all industry verticals; the information about customer wants, market demand, competition, industry trends, distribution channels etc. This information needs to be updated regularly because businesses operate in a dynamic environment. Our organization, The Brainy Insights incorporates scientific and systematic research procedures in order to get proper market insights and industry analysis for overall business success. The analysis consists of studying the market from a miniscule level wherein we implement statistical tools which helps us in examining the data with accuracy and precision.
Our research reports feature both; quantitative and qualitative aspects for any market. Qualitative information for any market research process are fundamental because they reveal the customer needs and wants, usage and consumption for any product/service related to a specific industry. This in turn aids the marketers/investors in knowing certain perceptions of the customers. Qualitative research can enlighten about the different product concepts and designs along with unique service offering that in turn, helps define marketing problems and generate opportunities. On the other hand, quantitative research engages with the data collection process through interviews, e-mail interactions, surveys and pilot studies. Quantitative aspects for the market research are useful to validate the hypotheses generated during qualitative research method, explore empirical patterns in the data with the help of statistical tools, and finally make the market estimations.
The Brainy Insights offers comprehensive research and analysis, based on a wide assortment of factual insights gained through interviews with CXOs and global experts and secondary data from reliable sources. Our analysts and industry specialist assume vital roles in building up statistical tools and analysis models, which are used to analyse the data and arrive at accurate insights with exceedingly informative research discoveries. The data provided by our organization have proven precious to a diverse range of companies, facilitating them to address issues such as determining which products/services are the most appealing, whether or not customers use the product in the manner anticipated, the purchasing intentions of the market and many others.
Our research methodology encompasses an idyllic combination of primary and secondary initiatives. Key phases involved in this process are listed below:

The phase involves the gathering and collecting of market data and its related information with the help of different sources & research procedures.

The data procurement stage involves in data gathering and collecting through various data sources.
This stage involves in extensive research. These data sources includes:
Purchased Database: Purchased databases play a crucial role in estimating the market sizes irrespective of the domain. Our purchased database includes:
Primary Research: The Brainy Insights interacts with leading companies and experts of the concerned domain to develop the analyst team’s market understanding and expertise. It improves and substantiates every single data presented in the market reports. Primary research mainly involves in telephonic interviews, E-mail interactions and face-to-face interviews with the raw material providers, manufacturers/producers, distributors, & independent consultants. The interviews that we conduct provides valuable data on market size and industry growth trends prevailing in the market. Our organization also conducts surveys with the various industry experts in order to gain overall insights of the industry/market. For instance, in healthcare industry we conduct surveys with the pharmacists, doctors, surgeons and nurses in order to gain insights and key information of a medical product/device/equipment which the customers are going to usage. Surveys are conducted in the form of questionnaire designed by our own analyst team. Surveys plays an important role in primary research because surveys helps us to identify the key target audiences of the market. Additionally, surveys helps to identify the key target audience engaged with the market. Our survey team conducts the survey by targeting the key audience, thus gaining insights from them. Based on the perspectives of the customers, this information is utilized to formulate market strategies. Moreover, market surveys helps us to understand the current competitive situation of the industry. To be precise, our survey process typically involve with the 360 analysis of the market. This analytical process begins by identifying the prospective customers for a product or service related to the market/industry to obtain data on how a product/service could fit into customers’ lives.

Secondary Research: The secondary data sources includes information published by the on-profit organizations such as World bank, WHO, company fillings, investor presentations, annual reports, national government documents, statistical databases, blogs, articles, white papers and others. From the annual report, we analyse a company’s revenue to understand the key segment and market share of that organization in a particular region. We analyse the company websites and adopt the product mapping technique which is important for deriving the segment revenue. In the product mapping method, we select and categorize the products offered by the companies catering to domain specific market, deduce the product revenue for each of the companies so as to get overall estimation of the market size. We also source data and analyses trends based on information received from supply side and demand side intermediaries in the value chain. The supply side denotes the data gathered from supplier, distributor, wholesaler and the demand side illustrates the data gathered from the end customers for respective market domain.

The supply side for a domain specific market is analysed by:
The demand side for the market is estimated through:
In-house Library: Apart from these third-party sources, we have our in-house library of qualitative and quantitative information. Our in-house database includes market data for various industry and domains. These data are updated on regular basis as per the changing market scenario. Our library includes, historic databases, internal audit reports and archives.
Sometimes there are instances where there is no metadata or raw data available for any domain specific market. For those cases, we use our expertise to forecast and estimate the market size in order to generate comprehensive data sets. Our analyst team adopt a robust research technique in order to produce the estimates:
Data Synthesis: This stage involves the analysis & mapping of all the information obtained from the previous step. It also involves in scrutinizing the data for any discrepancy observed while data gathering related to the market. The data is collected with consideration to the heterogeneity of sources. Robust scientific techniques are in place for synthesizing disparate data sets and provide the essential contextual information that can orient market strategies. The Brainy Insights has extensive experience in data synthesis where the data passes through various stages:


Market Deduction & Formulation: The final stage comprises of assigning data points at appropriate market spaces so as to deduce feasible conclusions. Analyst perspective & subject matter expert based holistic form of market sizing coupled with industry analysis also plays a crucial role in this stage.
This stage involves in finalization of the market size and numbers that we have collected from data integration step. With data interpolation, it is made sure that there is no gap in the market data. Successful trend analysis is done by our analysts using extrapolation techniques, which provide the best possible forecasts for the market.
Data Validation & Market Feedback: Validation is the most important step in the process. Validation & re-validation via an intricately designed process helps us finalize data-points to be used for final calculations.

The Brainy Insights interacts with leading companies and experts of the concerned domain to develop the analyst team’s market understanding and expertise. It improves and substantiates every single data presented in the market reports. The data validation interview and discussion panels are typically composed of the most experienced industry members. The participants include, however, are not limited to:
Moreover, we always validate our data and findings through primary respondents from all the major regions we are working on.


Free Customization
Fortune 500 Clients
Free Yearly Update On Purchase Of Multi/Corporate License
Companies Served Till Date