- +1-315-215-1633
- sales@thebrainyinsights.com

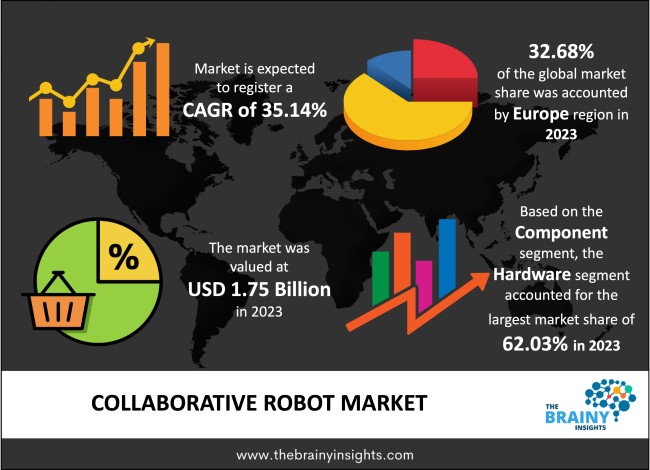
The global Collaborative Robot market generated USD 1.75 Billion revenue in 2023 and is projected to grow at a CAGR of 35.14% from 2024 to 2033. The market is expected to reach USD 35.55 Billion by 2033. The surge in automation requirements across global industries to enhance productivity and efficiency has spurred a growing demand for automation solutions. This trend is significantly propelling the expansion of the collaborative robot market. Moreover, continuous technological advancements in the industry further fuel this growth trajectory.
A collaborative robot, often called a cobot, is developed to work alongside humans in a shared workspace or environment. Unlike conventional industrial robots that generally operate in safety barriers, collaborative robots are developed to interact safely with human workers without requiring extensive safety measures. These cobots are equipped with cutting-edge sensors and intelligent software that allow them to observe the existence of people and adjust their actions accordingly to dodge collisions or mishaps. They are designed to be easily programmable, allowing quick deployment and adaptation to various tasks and workflows. Collaborative robots are used across various industries, including manufacturing, logistics, healthcare, and more. They are particularly valuable in tasks that require flexibility, dexterity, and close collaboration between humans and machines, such as assembly, pick-and-place operations, quality inspection, and material handling. The key features of collaborative robots include their ability to enhance productivity, improve efficiency, and promote worker safety by automating repetitive or strenuous tasks while working near humans. They represent a significant advancement in robotics technology, offering a harmonious blend of automation and human-centred design to optimize workflow processes in modern industrial settings.
Get an overview of this study by requesting a free sample
Safety and Collaboration - Unlike traditional industrial robots, which often require dedicated safety cages to protect human workers, cobots or collaborative robots are designed to work alongside humans safely. This inherent safety feature facilitates collaboration between humans and robots in various tasks, increasing adoption across industries.
Flexibility and Adaptability - Cobots are highly flexible and effortlessly programmable, allowing them to adjust quickly to changing production needs. Their ability to perform various tasks, from assembly and packaging to quality control and logistics, makes them appealing to industries seeking agile automation solutions.
Ease of Use - Many cobots are designed with user-friendly interfaces and intuitive programming tools, eliminating the need for specialized robotics expertise. This ease of use democratizes automation, allowing workers with varying skill levels to operate and program cobots effectively.
Initial Investment Costs - While cobots are generally more cost-effective than traditional industrial robots, the initial investment required for purchasing and integrating these systems can still be significant for some businesses, particularly small and medium-sized enterprises (SMEs). This upfront cost barrier may deter adoption, especially for companies with limited capital budgets.
Integration Complexity - Integrating cobots into existing production systems can be complex and time-consuming. Compatibility issues with legacy equipment, software interfaces, and the need for specialized training for personnel responsible for programming and maintenance can pose challenges for seamless integration. This complexity may hinder adoption, especially for companies needing more in-house robotics expertise.
Expansion into New Industries - While cobots have already found success in industries such as manufacturing and logistics, there are numerous opportunities for expansion into new sectors. Industries such as healthcare, agriculture, hospitality, and construction present untapped markets where cobots can automate tasks and improve efficiency.
Small and Medium-sized Enterprises (SMEs) Adoption - SMEs represent a significant growth opportunity for cobot manufacturers. As cobot prices continue to decrease and ease of use improves, SMEs increasingly adopt cobots to enhance productivity and competitiveness, driving market expansion.
Safety Concerns and Regulations - Ensuring the safety of human-robot collaboration remains a significant challenge in the cobot market. Adhering to safety regulations and standards while maintaining productivity can be complex. Furthermore, ensuring that cobots are designed and programmed to detect and respond appropriately to human presence is critical to preventing accidents and injuries.
Limited Payload and Speed Capacities - Cobots typically have lower payload capacities and slower operating speeds than traditional industrial robots. This limitation restricts their applicability in tasks requiring heavy lifting or high-speed operations, limiting their market potential in certain industries such as automotive and heavy manufacturing.
The regions analyzed for the market include North America, Europe, South America, Asia Pacific, the Middle East, and Africa. Europe emerged as the most prominent global Collaborative Robot market, with a 32.68% market revenue share in 2023.
European countries, particularly Germany and Scandinavia, have a long history of embracing automation and robotics in manufacturing. These regions have been early adopters of cobot technology, driving innovation and shaping the development of collaborative robots. Furthermore, Europe has a strong manufacturing tradition, with established automotive, electronics, aerospace, and machinery industries. The need to remain competitive in these industries has led to significant investments in automation and robotics, including cobots, to improve productivity, quality, and flexibility. Additionally, European countries prioritize worker safety and collaboration, making cobots an attractive solution for industries seeking to enhance human-robot collaboration while ensuring employee well-being. Stricter safety regulations and standards have encouraged the adoption of cobots in various industries across Europe. Besides, European governments have implemented supportive policies and provided funding to encourage the adoption of automation and robotics, including cobots. Initiatives such as research grants, tax incentives, and public-private partnerships have facilitated innovation, technology transfer, and market growth in the cobot sector.
Europe Region Collaborative Robot Market Share in 2023 - 32.68%
www.thebrainyinsights.com
Check the geographical analysis of this market by requesting a free sample
The component segment is divided into hardware and software. The hardware segment dominated the market, with a share of around 62.03% in 2023. Hardware components such as robotic arms, end-effectors, sensors, controllers, and safety features constitute the core of cobot systems. These hardware components enable cobots to perform various tasks in collaboration with humans, making them essential for cobot functionality. In addition, continuous advancements in hardware technology have led to developing more sophisticated and capable cobot systems. Manufacturers are investing in research and development to enhance cobot hardware's performance, precision, flexibility, and safety features, driving market dominance in this segment. Hardware components can also be customized and differentiated to fulfil the specific demands and requirements of different industries, applications, and use cases. Cobots with specialized end-effectors, grippers, sensors, and other hardware features can address various tasks, from assembly and packaging to inspection and material handling, enhancing their market appeal and dominance.
The payload segment is classified into up to 5 kg, 5-10 kg and above 10 kg. The up to 5 kg segment dominated the market, with a share of around 45.38% in 2023. Cobots with up to 5 kg payload capacity offer a versatile solution suitable for various applications across various industries. They can handle tasks such as assembly, pick and place, packaging, machine tending, and quality inspection, making them highly adaptable to different production environments. Furthermore, cobots with up to 5 kg payload capacity are flexible and agile, allowing them to perform multiple tasks within the same workspace. Their lightweight design and compact footprint enable effortless integration into existing production lines, allowing manufacturers to optimize workflows and meet changing demands. Moreover, cobots with up to 5 kg payload capacity are generally more affordable than higher payload cobots, making them accessible to a broader range of businesses, including SMEs. The lower upfront cost and reduced installation and integration expenses make these cobots financially attractive for companies with limited automation budgets.
The application segment includes assembly, gluing & welding, handling, machine tending, pick & place, packaging, quality, testing and others. The assembly segment dominated the market, with a share of around 24.48% in 2023. Assembly tasks are prevalent across various industries, including automotive, electronics, aerospace, consumer goods, and pharmaceuticals. These tasks involve assembling components or parts to create finished products, making assembly a critical process in manufacturing operations. As a result, there is a high demand for cobots specifically designed to perform assembly tasks. Assembly tasks often require high precision and repeatability to ensure product quality and consistency. Cobots with advanced sensors, vision systems, and precision control capabilities excel in handling complex assembly processes accurately and efficiently, making them ideal for assembly applications. Additionally, cobots designed for assembly applications offer versatility to handle various assembly tasks, from simple part insertion and fastening to more complex assembly processes such as soldering, glueing, and welding. Their superior design enables them to adapt to different product configurations, assembly sequences, and production requirements.
The end use industry segment is divided into automotive, electronics, food & beverage, furniture & equipment, metal & machinery, plastic & polymers, pharma and others. The automotive segment dominated the market, with a share of around 26.19% in 2023. The automotive industry is distinguished by high production volumes, with manufacturers producing millions of vehicles annually. To meet this demand efficiently, automotive manufacturers require automation solutions that can handle repetitive tasks with speed, precision, and reliability, making cobots an ideal choice. Furthermore, automotive manufacturing involves various assembly processes, including welding, painting, assembly of components, material handling, and quality inspection. Cobots with advanced sensors, vision systems, and end-of-arm tools can perform these diverse tasks, making them indispensable in automotive assembly lines. Additionally, automotive assembly processes require high precision and repeatability to ensure product quality and safety. Cobots excel in handling complex assembly tasks with accuracy and consistency, contributing to the high-quality standards demanded by the automotive industry.
| Attribute | Description |
|---|---|
| Market Size | Revenue (USD Billion) |
| Market size value in 2023 | USD 1.75 Billion |
| Market size value in 2033 | USD 35.55 Billion |
| CAGR (2024 to 2033) | 35.14% |
| Historical data | 2020-2022 |
| Base Year | 2023 |
| Forecast | 2024-2033 |
| Region | The regions analyzed for the market are Asia Pacific, Europe, South America, North America, and Middle East & Africa. Furthermore, the regions are further analyzed at the country level. |
| Segments | Component, Payload, Application, and End Use Industry |
As per The Brainy Insights, the size of the collaborative robot market was valued at USD 1.75 billion in 2023 to USD 35.55 billion by 2033.
The global collaborative robot market is growing at a CAGR of 35.14% during the forecast period 2024-2033.
Europe became the largest market for collaborative robot.
Ease of use, safety, and collaboration drive the market's growth.
1. Introduction
1.1. Objectives of the Study
1.2. Market Definition
1.3. Research Scope
1.4. Currency
1.5. Key Target Audience
2. Research Methodology and Assumptions
3. Executive Summary
4. Premium Insights
4.1. Porter’s Five Forces Analysis
4.2. Value Chain Analysis
4.3. Top Investment Pockets
4.3.1. Market Attractiveness Analysis By Component
4.3.2. Market Attractiveness Analysis By Payload
4.3.3. Market Attractiveness Analysis By Application
4.3.4. Market Attractiveness Analysis By End Use Industry
4.3.5. Market Attractiveness Analysis by Region
4.4. Industry Trends
5. Market Dynamics
5.1. Market Evaluation
5.2. Drivers
5.2.1. Ease of Use
5.2.2. Safety and Collaboration
5.3. Restraints
5.3.1. Initial Investment Costs
5.4. Opportunities
5.4.1. Expansion into New Industries
5.5. Challenges
5.5.1. Limited Payload and Speed Capacities
6. Global Collaborative Robot Market Analysis and Forecast, By Component
6.1. Segment Overview
6.2. Hardware
6.3. Software
7. Global Collaborative Robot Market Analysis and Forecast, By Payload
7.1. Segment Overview
7.2. Up to 5 Kg
7.3. 5-10 Kg
7.4. Above 10 Kg
8. Global Collaborative Robot Market Analysis and Forecast, By Application
8.1. Segment Overview
8.2. Assembly
8.3. Gluing & Welding
8.4. Handling
8.5. Machine Tending
8.6. Pick & Place
8.7. Packaging
8.8. Quality Testing
8.9. Others
9. Global Collaborative Robot Market Analysis and Forecast, By End Use Industry
9.1. Segment Overview
9.2. Automotive
9.3. Electronics
9.4. Food & Beverage
9.5. Furniture & Equipment
9.6. Metal & Machinery
9.7. Plastic & Polymers
9.8. Pharma
9.9. Others
10. Global Collaborative Robot Market Analysis and Forecast, By Regional Analysis
10.1. Segment Overview
10.2. North America
10.2.1. U.S.
10.2.2. Canada
10.2.3. Mexico
10.3. Europe
10.3.1. Germany
10.3.2. France
10.3.3. U.K.
10.3.4. Italy
10.3.5. Spain
10.4. Asia-Pacific
10.4.1. Japan
10.4.2. China
10.4.3. India
10.5. South America
10.5.1. Brazil
10.6. Middle East and Africa
10.6.1. UAE
10.6.2. South Africa
11. Global Collaborative Robot Market-Competitive Landscape
11.1. Overview
11.2. Market Share of Key Players in the Collaborative Robot Market
11.2.1. Global Company Market Share
11.2.2. North America Company Market Share
11.2.3. Europe Company Market Share
11.2.4. APAC Company Market Share
11.3. Competitive Situations and Trends
11.3.1. Product Launches and Developments
11.3.2. Partnerships, Collaborations, and Agreements
11.3.3. Mergers & Acquisitions
11.3.4. Expansions
12. Company Profiles
12.1. ABB Ltd.
12.1.1. Business Overview
12.1.2. Company Snapshot
12.1.3. Company Market Share Analysis
12.1.4. Company Product Portfolio
12.1.5. Recent Developments
12.1.6. SWOT Analysis
12.2. AUBO (Beijing) Robotics Technology Co. Ltd.
12.2.1. Business Overview
12.2.2. Company Snapshot
12.2.3. Company Market Share Analysis
12.2.4. Company Product Portfolio
12.2.5. Recent Developments
12.2.6. SWOT Analysis
12.3. Comau S.p.A.
12.3.1. Business Overview
12.3.2. Company Snapshot
12.3.3. Company Market Share Analysis
12.3.4. Company Product Portfolio
12.3.5. Recent Developments
12.3.6. SWOT Analysis
12.4. Denso
12.4.1. Business Overview
12.4.2. Company Snapshot
12.4.3. Company Market Share Analysis
12.4.4. Company Product Portfolio
12.4.5. Recent Developments
12.4.6. SWOT Analysis
12.5. Doosan
12.5.1. Business Overview
12.5.2. Company Snapshot
12.5.3. Company Market Share Analysis
12.5.4. Company Product Portfolio
12.5.5. Recent Developments
12.5.6. SWOT Analysis
12.6. Epson Robots
12.6.1. Business Overview
12.6.2. Company Snapshot
12.6.3. Company Market Share Analysis
12.6.4. Company Product Portfolio
12.6.5. Recent Developments
12.6.6. SWOT Analysis
12.7. Energid Technologies Corporation
12.7.1. Business Overview
12.7.2. Company Snapshot
12.7.3. Company Market Share Analysis
12.7.4. Company Product Portfolio
12.7.5. Recent Developments
12.7.6. SWOT Analysis
12.8. Festo Group
12.8.1. Business Overview
12.8.2. Company Snapshot
12.8.3. Company Market Share Analysis
12.8.4. Company Product Portfolio
12.8.5. Recent Developments
12.8.6. SWOT Analysis
12.9. F&P Robotics AG
12.9.1. Business Overview
12.9.2. Company Snapshot
12.9.3. Company Market Share Analysis
12.9.4. Company Product Portfolio
12.9.5. Recent Developments
12.9.6. SWOT Analysis
12.10. Franks Emika Gmbh
12.10.1. Business Overview
12.10.2. Company Snapshot
12.10.3. Company Market Share Analysis
12.10.4. Company Product Portfolio
12.10.5. Recent Developments
12.10.6. SWOT Analysis
12.11. Fanuc Corporation
12.11.1. Business Overview
12.11.2. Company Snapshot
12.11.3. Company Market Share Analysis
12.11.4. Company Product Portfolio
12.11.5. Recent Developments
12.11.6. SWOT Analysis
12.12. Kawasaki Heavy Industries Ltd.
12.12.1. Business Overview
12.12.2. Company Snapshot
12.12.3. Company Market Share Analysis
12.12.4. Company Product Portfolio
12.12.5. Recent Developments
12.12.6. SWOT Analysis
12.13. KUKA AG
12.13.1. Business Overview
12.13.2. Company Snapshot
12.13.3. Company Market Share Analysis
12.13.4. Company Product Portfolio
12.13.5. Recent Developments
12.13.6. SWOT Analysis
12.14. MRK-Systeme GmbH
12.14.1. Business Overview
12.14.2. Company Snapshot
12.14.3. Company Market Share Analysis
12.14.4. Company Product Portfolio
12.14.5. Recent Developments
12.14.6. SWOT Analysis
12.15. MABI Robotic AG
12.15.1. Business Overview
12.15.2. Company Snapshot
12.15.3. Company Market Share Analysis
12.15.4. Company Product Portfolio
12.15.5. Recent Developments
12.15.6. SWOT Analysis
12.16. Omron Corporation
12.16.1. Business Overview
12.16.2. Company Snapshot
12.16.3. Company Market Share Analysis
12.16.4. Company Product Portfolio
12.16.5. Recent Developments
12.16.6. SWOT Analysis
12.17. Precise Automation Inc.
12.17.1. Business Overview
12.17.2. Company Snapshot
12.17.3. Company Market Share Analysis
12.17.4. Company Product Portfolio
12.17.5. Recent Developments
12.17.6. SWOT Analysis
12.18. Rethink Robotics GmbH
12.18.1. Business Overview
12.18.2. Company Snapshot
12.18.3. Company Market Share Analysis
12.18.4. Company Product Portfolio
12.18.5. Recent Developments
12.18.6. SWOT Analysis
12.19. Robert Bosch GmbH
12.19.1. Business Overview
12.19.2. Company Snapshot
12.19.3. Company Market Share Analysis
12.19.4. Company Product Portfolio
12.19.5. Recent Developments
12.19.6. SWOT Analysis
12.20. Staubli International AG
12.20.1. Business Overview
12.20.2. Company Snapshot
12.20.3. Company Market Share Analysis
12.20.4. Company Product Portfolio
12.20.5. Recent Developments
12.20.6. SWOT Analysis
12.21. Siasun Robot & Automation co. Ltd.
12.21.1. Business Overview
12.21.2. Company Snapshot
12.21.3. Company Market Share Analysis
12.21.4. Company Product Portfolio
12.21.5. Recent Developments
12.21.6. SWOT Analysis
12.22. TechMan Robot Inc.
12.22.1. Business Overview
12.22.2. Company Snapshot
12.22.3. Company Market Share Analysis
12.22.4. Company Product Portfolio
12.22.5. Recent Developments
12.22.6. SWOT Analysis
12.23. Universal Robots
12.23.1. Business Overview
12.23.2. Company Snapshot
12.23.3. Company Market Share Analysis
12.23.4. Company Product Portfolio
12.23.5. Recent Developments
12.23.6. SWOT Analysis
12.24. Yaskawa Electric Corporation
12.24.1. Business Overview
12.24.2. Company Snapshot
12.24.3. Company Market Share Analysis
12.24.4. Company Product Portfolio
12.24.5. Recent Developments
12.24.6. SWOT Analysis
List of Table
1. Global Collaborative Robot Market, By Component, 2020-2033 (USD Billion)
2. Global Hardware Collaborative Robot Market, By Region, 2020-2033 (USD Billion)
3. Global Software Collaborative Robot Market, By Region, 2020-2033 (USD Billion)
4. Global Collaborative Robot Market, By Payload, 2020-2033 (USD Billion)
5. Global Up to 5 Kg Collaborative Robot Market, By Region, 2020-2033 (USD Billion)
6. Global 5-10 Kg Collaborative Robot Market, By Region, 2020-2033 (USD Billion)
7. Global Above 10 Kg Collaborative Robot Market, By Region, 2020-2033 (USD Billion)
8. Global Collaborative Robot Market, By Application, 2020-2033 (USD Billion)
9. Global Assembly Collaborative Robot Market, By Region, 2020-2033 (USD Billion)
10. Global Gluing & Welding Collaborative Robot Market, By Region, 2020-2033 (USD Billion)
11. Global Handling Collaborative Robot Market, By Region, 2020-2033 (USD Billion)
12. Global Machine Tending Collaborative Robot Market, By Region, 2020-2033 (USD Billion)
13. Global Pick & Place Collaborative Robot Market, By Region, 2020-2033 (USD Billion)
14. Global Packaging Collaborative Robot Market, By Region, 2020-2033 (USD Billion)
15. Global Quality Testing Collaborative Robot Market, By Region, 2020-2033 (USD Billion)
16. Global Others Collaborative Robot Market, By Region, 2020-2033 (USD Billion)
17. Global Collaborative Robot Market, By End Use Industry, 2020-2033 (USD Billion)
18. Global Automotive Collaborative Robot Market, By Region, 2020-2033 (USD Billion)
19. Global Electronics Collaborative Robot Market, By Region, 2020-2033 (USD Billion)
20. Global Food & Beverage Collaborative Robot Market, By Region, 2020-2033 (USD Billion)
21. Global Furniture & Equipment Collaborative Robot Market, By Region, 2020-2033 (USD Billion)
22. Global Metal & Machinery Collaborative Robot Market, By Region, 2020-2033 (USD Billion)
23. Global Plastic & Polymers Collaborative Robot Market, By Region, 2020-2033 (USD Billion)
24. Global Pharma Collaborative Robot Market, By Region, 2020-2033 (USD Billion)
25. Global Others Collaborative Robot Market, By Region, 2020-2033 (USD Billion)
26. Global Collaborative Robot Market, By Region, 2020-2033 (USD Billion)
27. North America Collaborative Robot Market, By Component, 2020-2033 (USD Billion)
28. North America Collaborative Robot Market, By Payload, 2020-2033 (USD Billion)
29. North America Collaborative Robot Market, By Application, 2020-2033 (USD Billion)
30. North America Collaborative Robot Market, By End Use Industry, 2020-2033 (USD Billion)
31. U.S. Collaborative Robot Market, By Component, 2020-2033 (USD Billion)
32. U.S. Collaborative Robot Market, By Payload, 2020-2033 (USD Billion)
33. U.S. Collaborative Robot Market, By Application, 2020-2033 (USD Billion)
34. U.S. Collaborative Robot Market, By End Use Industry, 2020-2033 (USD Billion)
35. Canada Collaborative Robot Market, By Component, 2020-2033 (USD Billion)
36. Canada Collaborative Robot Market, By Payload, 2020-2033 (USD Billion)
37. Canada Collaborative Robot Market, By Application, 2020-2033 (USD Billion)
38. Canada Collaborative Robot Market, By End Use Industry, 2020-2033 (USD Billion)
39. Mexico Collaborative Robot Market, By Component, 2020-2033 (USD Billion)
40. Mexico Collaborative Robot Market, By Payload, 2020-2033 (USD Billion)
41. Mexico Collaborative Robot Market, By Application, 2020-2033 (USD Billion)
42. Mexico Collaborative Robot Market, By End Use Industry, 2020-2033 (USD Billion)
43. Europe Collaborative Robot Market, By Component, 2020-2033 (USD Billion)
44. Europe Collaborative Robot Market, By Payload, 2020-2033 (USD Billion)
45. Europe Collaborative Robot Market, By Application, 2020-2033 (USD Billion)
46. Europe Collaborative Robot Market, By End Use Industry, 2020-2033 (USD Billion)
47. Germany Collaborative Robot Market, By Component, 2020-2033 (USD Billion)
48. Germany Collaborative Robot Market, By Payload, 2020-2033 (USD Billion)
49. Germany Collaborative Robot Market, By Application, 2020-2033 (USD Billion)
50. Germany Collaborative Robot Market, By End Use Industry, 2020-2033 (USD Billion)
51. France Collaborative Robot Market, By Component, 2020-2033 (USD Billion)
52. France Collaborative Robot Market, By Payload, 2020-2033 (USD Billion)
53. France Collaborative Robot Market, By Application, 2020-2033 (USD Billion)
54. France Collaborative Robot Market, By End Use Industry, 2020-2033 (USD Billion)
55. U.K. Collaborative Robot Market, By Component, 2020-2033 (USD Billion)
56. U.K. Collaborative Robot Market, By Payload, 2020-2033 (USD Billion)
57. U.K. Collaborative Robot Market, By Application, 2020-2033 (USD Billion)
58. U.K. Collaborative Robot Market, By End Use Industry, 2020-2033 (USD Billion)
59. Italy Collaborative Robot Market, By Component, 2020-2033 (USD Billion)
60. Italy Collaborative Robot Market, By Payload, 2020-2033 (USD Billion)
61. Italy Collaborative Robot Market, By Application, 2020-2033 (USD Billion)
62. Italy Collaborative Robot Market, By End Use Industry, 2020-2033 (USD Billion)
63. Spain Collaborative Robot Market, By Component, 2020-2033 (USD Billion)
64. Spain Collaborative Robot Market, By Payload, 2020-2033 (USD Billion)
65. Spain Collaborative Robot Market, By Application, 2020-2033 (USD Billion)
66. Spain Collaborative Robot Market, By End Use Industry, 2020-2033 (USD Billion)
67. Asia Pacific Collaborative Robot Market, By Component, 2020-2033 (USD Billion)
68. Asia Pacific Collaborative Robot Market, By Payload, 2020-2033 (USD Billion)
69. Asia Pacific Collaborative Robot Market, By Application, 2020-2033 (USD Billion)
70. Asia Pacific Collaborative Robot Market, By End Use Industry, 2020-2033 (USD Billion)
71. Japan Collaborative Robot Market, By Component, 2020-2033 (USD Billion)
72. Japan Collaborative Robot Market, By Payload, 2020-2033 (USD Billion)
73. Japan Collaborative Robot Market, By Application, 2020-2033 (USD Billion)
74. Japan Collaborative Robot Market, By End Use Industry, 2020-2033 (USD Billion)
75. China Collaborative Robot Market, By Component, 2020-2033 (USD Billion)
76. China Collaborative Robot Market, By Payload, 2020-2033 (USD Billion)
77. China Collaborative Robot Market, By Application, 2020-2033 (USD Billion)
78. China Collaborative Robot Market, By End Use Industry, 2020-2033 (USD Billion)
79. India Collaborative Robot Market, By Component, 2020-2033 (USD Billion)
80. India Collaborative Robot Market, By Payload, 2020-2033 (USD Billion)
81. India Collaborative Robot Market, By Application, 2020-2033 (USD Billion)
82. India Collaborative Robot Market, By End Use Industry, 2020-2033 (USD Billion)
83. South America Collaborative Robot Market, By Component, 2020-2033 (USD Billion)
84. South America Collaborative Robot Market, By Payload, 2020-2033 (USD Billion)
85. South America Collaborative Robot Market, By Application, 2020-2033 (USD Billion)
86. South America Collaborative Robot Market, By End Use Industry, 2020-2033 (USD Billion)
87. Brazil Collaborative Robot Market, By Component, 2020-2033 (USD Billion)
88. Brazil Collaborative Robot Market, By Payload, 2020-2033 (USD Billion)
89. Brazil Collaborative Robot Market, By Application, 2020-2033 (USD Billion)
90. Brazil Collaborative Robot Market, By End Use Industry, 2020-2033 (USD Billion)
91. Middle East and Africa Collaborative Robot Market, By Component, 2020-2033 (USD Billion)
92. Middle East and Africa Collaborative Robot Market, By Payload, 2020-2033 (USD Billion)
93. Middle East and Africa Collaborative Robot Market, By Application, 2020-2033 (USD Billion)
94. Middle East and Africa Collaborative Robot Market, By End Use Industry, 2020-2033 (USD Billion)
95. UAE Collaborative Robot Market, By Component, 2020-2033 (USD Billion)
96. UAE Collaborative Robot Market, By Payload, 2020-2033 (USD Billion)
97. UAE Collaborative Robot Market, By Application, 2020-2033 (USD Billion)
98. UAE Collaborative Robot Market, By End Use Industry, 2020-2033 (USD Billion)
99. South Africa Collaborative Robot Market, By Component, 2020-2033 (USD Billion)
100. South Africa Collaborative Robot Market, By Payload, 2020-2033 (USD Billion)
101. South Africa Collaborative Robot Market, By Application, 2020-2033 (USD Billion)
102. South Africa Collaborative Robot Market, By End Use Industry, 2020-2033 (USD Billion)
List of Figures
1. Global Collaborative Robot Market Segmentation
2. Collaborative Robot Market: Research Methodology
3. Market Size Estimation Methodology: Bottom-Up Approach
4. Market Size Estimation Methodology: Top-Down Approach
5. Data Triangulation
6. Porter’s Five Forces Analysis
7. Value Chain Analysis
8. Global Collaborative Robot Market Attractiveness Analysis By Component
9. Global Collaborative Robot Market Attractiveness Analysis By Payload
10. Global Collaborative Robot Market Attractiveness Analysis By Application
11. Global Collaborative Robot Market Attractiveness Analysis By End Use Industry
12. Global Collaborative Robot Market Attractiveness Analysis by Region
13. Global Collaborative Robot Market: Dynamics
14. Global Collaborative Robot Market Share By Component (2024 & 2033)
15. Global Collaborative Robot Market Share By Payload (2024 & 2033)
16. Global Collaborative Robot Market Share By Application (2024 & 2033)
17. Global Collaborative Robot Market Share By End Use Industry (2024 & 2033)
18. Global Collaborative Robot Market Share by Regions (2024 & 2033)
19. Global Collaborative Robot Market Share by Company (2023)
This study forecasts revenue at global, regional, and country levels from 2020 to 2033. The Brainy Insights has segmented the global Collaborative Robot market based on below-mentioned segments:
Global Collaborative Robot Market by Component:
Global Collaborative Robot Market by Payload:
Global Collaborative Robot Market by Application:
Global Collaborative Robot Market by End Use Industry:
Global Collaborative Robot Market by Region:
Research has its special purpose to undertake marketing efficiently. In this competitive scenario, businesses need information across all industry verticals; the information about customer wants, market demand, competition, industry trends, distribution channels etc. This information needs to be updated regularly because businesses operate in a dynamic environment. Our organization, The Brainy Insights incorporates scientific and systematic research procedures in order to get proper market insights and industry analysis for overall business success. The analysis consists of studying the market from a miniscule level wherein we implement statistical tools which helps us in examining the data with accuracy and precision.
Our research reports feature both; quantitative and qualitative aspects for any market. Qualitative information for any market research process are fundamental because they reveal the customer needs and wants, usage and consumption for any product/service related to a specific industry. This in turn aids the marketers/investors in knowing certain perceptions of the customers. Qualitative research can enlighten about the different product concepts and designs along with unique service offering that in turn, helps define marketing problems and generate opportunities. On the other hand, quantitative research engages with the data collection process through interviews, e-mail interactions, surveys and pilot studies. Quantitative aspects for the market research are useful to validate the hypotheses generated during qualitative research method, explore empirical patterns in the data with the help of statistical tools, and finally make the market estimations.
The Brainy Insights offers comprehensive research and analysis, based on a wide assortment of factual insights gained through interviews with CXOs and global experts and secondary data from reliable sources. Our analysts and industry specialist assume vital roles in building up statistical tools and analysis models, which are used to analyse the data and arrive at accurate insights with exceedingly informative research discoveries. The data provided by our organization have proven precious to a diverse range of companies, facilitating them to address issues such as determining which products/services are the most appealing, whether or not customers use the product in the manner anticipated, the purchasing intentions of the market and many others.
Our research methodology encompasses an idyllic combination of primary and secondary initiatives. Key phases involved in this process are listed below:

The phase involves the gathering and collecting of market data and its related information with the help of different sources & research procedures.

The data procurement stage involves in data gathering and collecting through various data sources.
This stage involves in extensive research. These data sources includes:
Purchased Database: Purchased databases play a crucial role in estimating the market sizes irrespective of the domain. Our purchased database includes:
Primary Research: The Brainy Insights interacts with leading companies and experts of the concerned domain to develop the analyst team’s market understanding and expertise. It improves and substantiates every single data presented in the market reports. Primary research mainly involves in telephonic interviews, E-mail interactions and face-to-face interviews with the raw material providers, manufacturers/producers, distributors, & independent consultants. The interviews that we conduct provides valuable data on market size and industry growth trends prevailing in the market. Our organization also conducts surveys with the various industry experts in order to gain overall insights of the industry/market. For instance, in healthcare industry we conduct surveys with the pharmacists, doctors, surgeons and nurses in order to gain insights and key information of a medical product/device/equipment which the customers are going to usage. Surveys are conducted in the form of questionnaire designed by our own analyst team. Surveys plays an important role in primary research because surveys helps us to identify the key target audiences of the market. Additionally, surveys helps to identify the key target audience engaged with the market. Our survey team conducts the survey by targeting the key audience, thus gaining insights from them. Based on the perspectives of the customers, this information is utilized to formulate market strategies. Moreover, market surveys helps us to understand the current competitive situation of the industry. To be precise, our survey process typically involve with the 360 analysis of the market. This analytical process begins by identifying the prospective customers for a product or service related to the market/industry to obtain data on how a product/service could fit into customers’ lives.

Secondary Research: The secondary data sources includes information published by the on-profit organizations such as World bank, WHO, company fillings, investor presentations, annual reports, national government documents, statistical databases, blogs, articles, white papers and others. From the annual report, we analyse a company’s revenue to understand the key segment and market share of that organization in a particular region. We analyse the company websites and adopt the product mapping technique which is important for deriving the segment revenue. In the product mapping method, we select and categorize the products offered by the companies catering to domain specific market, deduce the product revenue for each of the companies so as to get overall estimation of the market size. We also source data and analyses trends based on information received from supply side and demand side intermediaries in the value chain. The supply side denotes the data gathered from supplier, distributor, wholesaler and the demand side illustrates the data gathered from the end customers for respective market domain.

The supply side for a domain specific market is analysed by:
The demand side for the market is estimated through:
In-house Library: Apart from these third-party sources, we have our in-house library of qualitative and quantitative information. Our in-house database includes market data for various industry and domains. These data are updated on regular basis as per the changing market scenario. Our library includes, historic databases, internal audit reports and archives.
Sometimes there are instances where there is no metadata or raw data available for any domain specific market. For those cases, we use our expertise to forecast and estimate the market size in order to generate comprehensive data sets. Our analyst team adopt a robust research technique in order to produce the estimates:
Data Synthesis: This stage involves the analysis & mapping of all the information obtained from the previous step. It also involves in scrutinizing the data for any discrepancy observed while data gathering related to the market. The data is collected with consideration to the heterogeneity of sources. Robust scientific techniques are in place for synthesizing disparate data sets and provide the essential contextual information that can orient market strategies. The Brainy Insights has extensive experience in data synthesis where the data passes through various stages:


Market Deduction & Formulation: The final stage comprises of assigning data points at appropriate market spaces so as to deduce feasible conclusions. Analyst perspective & subject matter expert based holistic form of market sizing coupled with industry analysis also plays a crucial role in this stage.
This stage involves in finalization of the market size and numbers that we have collected from data integration step. With data interpolation, it is made sure that there is no gap in the market data. Successful trend analysis is done by our analysts using extrapolation techniques, which provide the best possible forecasts for the market.
Data Validation & Market Feedback: Validation is the most important step in the process. Validation & re-validation via an intricately designed process helps us finalize data-points to be used for final calculations.

The Brainy Insights interacts with leading companies and experts of the concerned domain to develop the analyst team’s market understanding and expertise. It improves and substantiates every single data presented in the market reports. The data validation interview and discussion panels are typically composed of the most experienced industry members. The participants include, however, are not limited to:
Moreover, we always validate our data and findings through primary respondents from all the major regions we are working on.


Free Customization
Fortune 500 Clients
Free Yearly Update On Purchase Of Multi/Corporate License
Companies Served Till Date