- +1-315-215-1633
- sales@thebrainyinsights.com

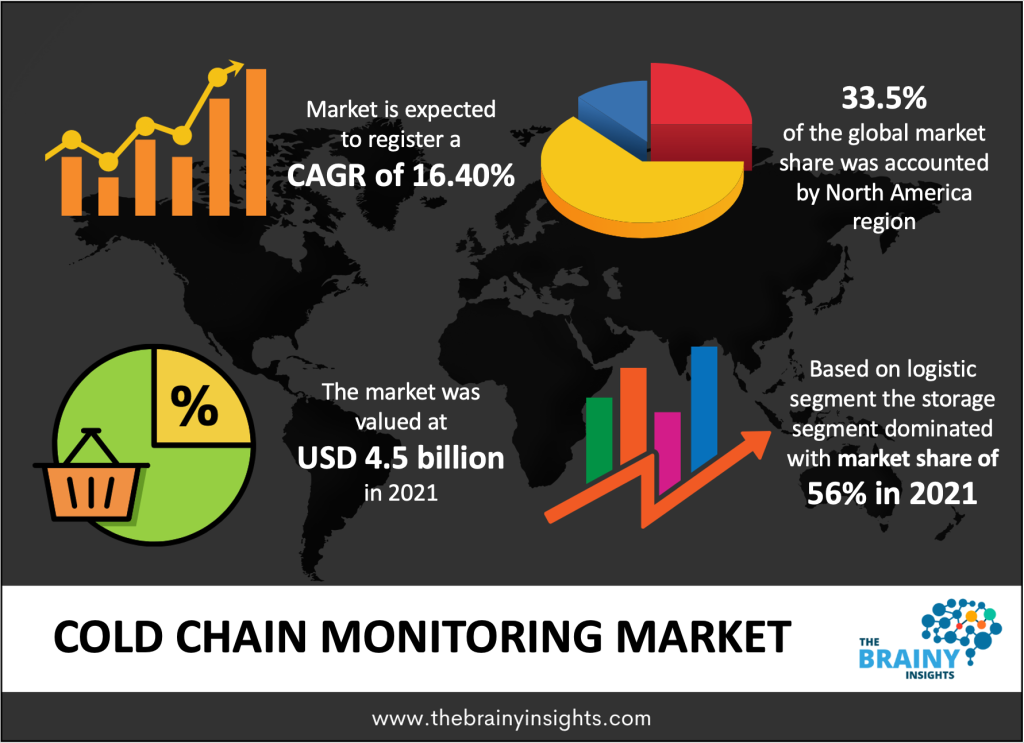
Global cold chain monitoring market is expected to reach USD 17.65 billion by 2030, at a CAGR of 16.40% from 2022 to 2030. Cold chain monitoring market growth would be driven by the increasing demand in various sectors like chemicals, food & beverages, & pharmaceuticals It also helps in increasing the shelf life of food products that will also boost the growth in the market.
Cold chain monitoring uses (IoT) internet of things technology to constantly observe temperature-dependent products transported in a cold chain, a supply chain of perishable and temperature-dependent products like biologics, food & beverages, and pharmaceuticals. Without proper monitoring, the conditions during transport and storage can damage the quality of these products. It can risk people’s health and safety and harm a company’s brand, customer loyalty, and essence. The cold chain monitoring system detects product temperature problems fast and minimizes damage by rerouting or troubleshooting shipment to refrigerated warehouses or dispatching crews to repair the malfunctioning equipment. Workers are accountable for controlling the cold chain and the technology to track temperatures in these managed conditions. Similarly, the government agents audit these industries occasionally to confirm adherence and consumer safety. Vaccines, for instance, are observed very precisely, as even the slightest temperature change can cause specific vaccines to be ineffective. Cold chain monitoring in transportation is essential and can be customized as per the product. Data loggers are now waterproof, pre-calibrated, and disposable. It raises the convenience of cold chain monitoring in different environments, including damp, wet, or icy situations. In the healthcare domain, a cold chain is a network of freezers, cold stores, and cold boxes managed and maintained to prevent vaccines from losing their integrity during transportation, storage, and distribution, from the factory to the point of use.
Get an overview of this study by requesting a free sample
The need for fresh food & beverages has risen with an increase in the attention to health, and quality. Additionally, the rising interest in healthy food and development in a middle-income group of people in countries like China is driving the cold chain market. Customers now require higher-end products, like Alaskan salmon, that must travel huge distances and ship fast to assure freshness and quality. Therefore, maintaining the required temperature is essential for cold chain products to bypass changes in texture & taste when a shipment lies outside the required temperatures.
The installation expense of cold chain monitoring systems is extremely high. Placing sensors and setting the connectivity network in location needs a high price. Shipping expensive consignments over long-term within their specified temperature range require substantial investment. Hence, players interested in cold storage and cold transportation stay doubtful about spending on designing monitoring networks. Price is the primary hindrance to raising real-time cold chain monitoring systems, especially for SMEs. Multiple players in the food industry are small and medium-sized companies, usually working on narrow margins.
The different warehouse notices various temperature zone. Therefore, constant temperature monitoring is important to control the temperature of the goods stored along with the actual condition of these goods. The best use of warehouses and control over proper equipment can be performed by using automation, including robotic equipment, to find inter-warehouse stock movements and unloading & loading exercises. Warehouse systems help adequate storage space utilization, decrease wear and tear, improve dependability, and reduce operating expenses. Real-time visibility of shipment area, temperature, humidity, and other climatic factors allows manufacturers and distributors to carry out faster preventative measures, lowering the risk of spoilage or contamination.
The global cold chain monitoring market has been segmented based on logistics, application, offering, and region.
The regions analyzed for the market include North America, Europe, South America, Asia Pacific, the Middle East and Africa. North America region emerged as the largest market for the global cold chain monitoring market with a 33.5% share of the market revenue in 2021.
North America Region Cold Chain Monitoring Market Share in 2021 - 33.5%
www.thebrainyinsights.com
Check the geographical analysis of this market by requesting a free sample
The key players are now concentrating on implementing strategies such as adopting new technology, product innovations, mergers & acquisitions, joint venture, alliances, and partnerships to improve their market position in the global cold chain monitoring industry.
In December 2021, ORBCOMM Inc. presented a cost-effective, flexible asset management system backed by its new GT 1030 global LTE telematics device, which strives to track and monitor all kinds of assets used in the transportation container, and heavy equipment markets.
As per The Brainy Insights, the size of the cold chain monitoring market was valued at USD 4.5 billion in 2021 to USD 17.65 billion by 2030.
Global cold chain monitoring market is growing at a CAGR of 16.40% during the forecast period 2022-2030.
Rising focus on product & quality sensitivity to propel market growth.
The increased cost of installation to hinder market growth.
Technological advancements will provide huge opportunities to the market.
Key players are Sensitech(A Carrier company, Roambee Corporation, ORBCOMM, Monnit, Kii Corporation, hIOTron, Hanwell Solutions Ltd, Berlinger & Co. AG, Ambetronics Engineers Pvt.Ltd, and Aeris.
1. Introduction
1.1. Objectives of the Study
1.2. Market Definition
1.3. Research Scope
1.4. Currency
1.5. Key Target Audience
2. Research Methodology and Assumptions
3. Executive Summary
4. Premium Insights
4.1. Porter’s Five Forces Analysis
4.2. Value Chain Analysis
4.3. Top Investment Pockets
4.3.1. Market Attractiveness Analysis by Logistics
4.3.2. Market Attractiveness Analysis by Application
4.3.3. Market Attractiveness Analysis by Offering
4.3.4. Market Attractiveness Analysis by Region
4.4. Industry Trends
5. Market Dynamics
5.1. Market Evaluation
5.2. Drivers
5.2.1. Rising focus on product & quality sensitivity to propel market growth
5.3. Restraints
5.3.1. The increased cost of installation to hinder market growth
5.4. Opportunities
5.4.1. Technological advancements
6. Global Cold Chain Monitoring Market Analysis and Forecast, By Logistics:
6.1. Segment Overview
6.2. Transportation
6.3. Storage
7. Global Cold Chain Monitoring Market Analysis and Forecast, By Application
7.1. Segment Overview
7.2. Chemicals
7.3. Food
7.4. Pharmaceuticals & Healthcare
8. Global Cold Chain Monitoring Market Analysis and Forecast, By Offering
8.1. Segment Overview
8.2. Software
8.3. Hardware
9. Global Cold Chain Monitoring Market Analysis and Forecast, By Regional Analysis
9.1. Segment Overview
9.2. North America
9.2.1. U.S.
9.2.2. Canada
9.2.3. Mexico
9.3. Europe
9.3.1. Germany
9.3.2. France
9.3.3. U.K.
9.3.4. Italy
9.3.5. Spain
9.4. Asia-Pacific
9.4.1. Japan
9.4.2. China
9.4.3. India
9.5. South America
9.5.1. Brazil
9.6. Middle East and Africa
9.6.1. UAE
9.6.2. South Africa
10. Global Cold Chain Monitoring Market-Competitive Landscape
10.1. Overview
10.2. Market Share of Key Players in the Cold Chain Monitoring Market
10.2.1. Global Company Market Share
10.2.2. North America Company Market Share
10.2.3. Europe Company Market Share
10.2.4. APAC Company Market Share
10.3. Competitive Situations and Trends
10.3.1. Product Launches and Developments
10.3.2. Partnerships, Collaborations, and Agreements
10.3.3. Mergers & Acquisitions
10.3.4. Expansions
11. Company Profiles
11.1. Sensitech-A Carrier company
11.1.1. Business Overview
11.1.2. Company Snapshot
11.1.3. Company Market Share Analysis
11.1.4. Company Product Portfolio
11.1.5. Recent Developments
11.1.6. SWOT Analysis
11.2. Roambee Corporation
11.2.1. Business Overview
11.2.2. Company Snapshot
11.2.3. Company Market Share Analysis
11.2.4. Company Product Portfolio
11.2.5. Recent Developments
11.2.6. SWOT Analysis
11.3. ORBCOMM
11.3.1. Business Overview
11.3.2. Company Snapshot
11.3.3. Company Market Share Analysis
11.3.4. Company Product Portfolio
11.3.5. Recent Developments
11.3.6. SWOT Analysis
11.4. Monnit
11.4.1. Business Overview
11.4.2. Company Snapshot
11.4.3. Company Market Share Analysis
11.4.4. Company Product Portfolio
11.4.5. Recent Developments
11.4.6. SWOT Analysis
11.5. Kii Corporation
11.5.1. Business Overview
11.5.2. Company Snapshot
11.5.3. Company Market Share Analysis
11.5.4. Company Product Portfolio
11.5.5. Recent Developments
11.5.6. SWOT Analysis
11.6. hIOTron
11.6.1. Business Overview
11.6.2. Company Snapshot
11.6.3. Company Market Share Analysis
11.6.4. Company Product Portfolio
11.6.5. Recent Developments
11.6.6. SWOT Analysis
11.7. Hanwell Solutions Ltd
11.7.1. Business Overview
11.7.2. Company Snapshot
11.7.3. Company Market Share Analysis
11.7.4. Company Product Portfolio
11.7.5. Recent Developments
11.7.6. SWOT Analysis
11.8. Berlinger & Co. AG.
11.8.1. Business Overview
11.8.2. Company Snapshot
11.8.3. Company Market Share Analysis
11.8.4. Company Product Portfolio
11.8.5. Recent Developments
11.8.6. SWOT Analysis
11.9. Ambetronics Engineers Pvt.Ltd
11.9.1. Business Overview
11.9.2. Company Snapshot
11.9.3. Company Market Share Analysis
11.9.4. Company Product Portfolio
11.9.5. Recent Developments
11.9.6. SWOT Analysis
11.10. Aeris
11.10.1. Business Overview
11.10.2. Company Snapshot
11.10.3. Company Market Share Analysis
11.10.4. Company Product Portfolio
11.10.5. Recent Developments
11.10.6. SWOT Analysis
List of Table
1. Global Cold Chain Monitoring Market, By Logistics, 2019-2030 (USD Billion)
2. Global Transportation Cold Chain Monitoring Market, By Region, 2019-2030 (USD Billion)
3. Global Storage Cold Chain Monitoring Market, By Region, 2019-2030 (USD Billion)
4. Global Cold Chain Monitoring Market, By Application, 2019-2030 (USD Billion)
5. Global Chemicals Cold Chain Monitoring Market, By Region, 2019-2030 (USD Billion)
6. Global Food Cold Chain Monitoring Market, By Region, 2019-2030 (USD Billion)
7. Global Pharmaceuticals & Healthcare Cold Chain Monitoring Market, By Region, 2019-2030 (USD Billion)
8. Global Cold Chain Monitoring Market, By Offering, 2019-2030 (USD Billion)
9. Global Software Cold Chain Monitoring Market, By Region, 2019-2030 (USD Billion)
10. Global Hardware Cold Chain Monitoring Market, By Region, 2019-2030 (USD Billion)
11. North America Cold Chain Monitoring Market, By Logistics, 2019-2030 (USD Billion)
12. North America Cold Chain Monitoring Market, By Application, 2019-2030 (USD Billion)
13. North America Cold Chain Monitoring Market, By Offering, 2019-2030 (USD Billion)
14. U.S. Cold Chain Monitoring Market, By Logistics, 2019-2030 (USD Billion)
15. U.S. Cold Chain Monitoring Market, By Application, 2019-2030 (USD Billion)
16. U.S. Cold Chain Monitoring Market, By Offering, 2019-2030 (USD Billion)
17. Canada Cold Chain Monitoring Market, By Logistics, 2019-2030 (USD Billion)
18. Canada Cold Chain Monitoring Market, By Application, 2019-2030 (USD Billion)
19. Canada Cold Chain Monitoring Market, By Offering, 2019-2030 (USD Billion)
20. Mexico Cold Chain Monitoring Market, By Logistics, 2019-2030 (USD Billion)
21. Mexico Cold Chain Monitoring Market, By Application, 2019-2030 (USD Billion)
22. Mexico Cold Chain Monitoring Market, By Offering, 2019-2030 (USD Billion)
23. Europe Cold Chain Monitoring Market, By Logistics, 2019-2030 (USD Billion)
24. Europe Cold Chain Monitoring Market, By Application, 2019-2030 (USD Billion)
25. Europe Cold Chain Monitoring Market, By Offering, 2019-2030 (USD Billion)
26. Germany Cold Chain Monitoring Market, By Logistics, 2019-2030 (USD Billion)
27. Germany Cold Chain Monitoring Market, By Application, 2019-2030 (USD Billion)
28. Germany Cold Chain Monitoring Market, By Offering, 2019-2030 (USD Billion)
29. France Cold Chain Monitoring Market, By Logistics 2019-2030 (USD Billion)
30. France Cold Chain Monitoring Market, By Application, 2019-2030 (USD Billion)
31. France Cold Chain Monitoring Market, By Offering, 2019-2030 (USD Billion)
32. U.K. Cold Chain Monitoring Market, By Logistics, 2019-2030 (USD Billion)
33. U.K. Cold Chain Monitoring Market, By Application, 2019-2030 (USD Billion)
34. U.K. Cold Chain Monitoring Market, By Offering, 2019-2030 (USD Billion)
35. Italy Cold Chain Monitoring Market, By Logistics, 2019-2030 (USD Billion)
36. Italy Cold Chain Monitoring Market, By Application, 2019-2030 (USD Billion)
37. Italy Cold Chain Monitoring Market, By Offering, 2019-2030 (USD Billion)
38. Spain Cold Chain Monitoring Market, By Logistics, 2019-2030 (USD Billion)
39. Spain Cold Chain Monitoring Market, By Application, 2019-2030 (USD Billion)
40. Spain Cold Chain Monitoring Market, By Offering, 2019-2030 (USD Billion)
41. Asia Pacific Cold Chain Monitoring Market, By Logistics, 2019-2030 (USD Billion)
42. Asia Pacific Cold Chain Monitoring Market, By Application, 2019-2030 (USD Billion)
43. Asia Pacific Cold Chain Monitoring Market, By Offering, 2019-2030 (USD Billion)
44. Japan Cold Chain Monitoring Market, By Logistics, 2019-2030 (USD Billion)
45. Japan Cold Chain Monitoring Market, By Application, 2019-2030 (USD Billion)
46. Japan Cold Chain Monitoring Market, By Offering, 2019-2030 (USD Billion)
47. China Cold Chain Monitoring Market, By Logistics 2019-2030 (USD Billion)
48. China Cold Chain Monitoring Market, By Application, 2019-2030 (USD Billion)
49. China Cold Chain Monitoring Market, By Offering, 2019-2030 (USD Billion)
50. India Cold Chain Monitoring Market, By Logistics 2019-2030 (USD Billion)
51. India Cold Chain Monitoring Market, By Application, 2019-2030 (USD Billion)
52. India Cold Chain Monitoring Market, By Offering, 2019-2030 (USD Billion)
53. South America Cold Chain Monitoring Market, By Logistics, 2019-2030 (USD Billion)
54. South America Cold Chain Monitoring Market, By Application, 2019-2030 (USD Billion)
55. South America Cold Chain Monitoring Market, By Offering, 2019-2030 (USD Billion)
56. Brazil Cold Chain Monitoring Market, By Logistics 2019-2030 (USD Billion)
57. Brazil Cold Chain Monitoring Market, By Application, 2019-2030 (USD Billion)
58. Brazil Cold Chain Monitoring Market, By Offering, 2019-2030 (USD Billion)
59. Middle East and Africa Cold Chain Monitoring Market, By Logistics, 2019-2030 (USD Billion)
60. Middle East and Africa Cold Chain Monitoring Market, By Application, 2019-2030 (USD Billion)
61. Middle East and Africa Cold Chain Monitoring Market, By Offering, 2019-2030 (USD Billion)
62. UAE Cold Chain Monitoring Market, By Logistics, 2019-2030 (USD Billion)
63. UAE Cold Chain Monitoring Market, By Application, 2019-2030 (USD Billion)
64. UAE Cold Chain Monitoring Market, By Offering, 2019-2030 (USD Billion)
65. South Africa Cold Chain Monitoring Market, By Logistics 2019-2030 (USD Billion)
66. South Africa Cold Chain Monitoring Market, By Application, 2019-2030 (USD Billion)
67. South Africa Cold Chain Monitoring Market, By Offering, 2019-2030 (USD Billion)
List of Figures
1. Global Cold Chain Monitoring Market Segmentation
2. Cold Chain Monitoring Market: Research Methodology
3. Market Size Estimation Methodology: Bottom-Up Approach
4. Market Size Estimation Methodology: Top-Down Approach
5. Data Triangulation
6. Porter’s Five Forces Analysis
7. Value Chain Analysis
8. Global Cold Chain Monitoring Market Attractiveness Analysis by Logistics
9. Global Cold Chain Monitoring Market Attractiveness Analysis by Application
10. Global Cold Chain Monitoring Market Attractiveness Analysis by Offering
11. Global Cold Chain Monitoring Market Attractiveness Analysis by Region
12. Global Cold Chain Monitoring Market: Dynamics
13. Global Cold Chain Monitoring Market Share by Logistics (2022 & 2030)
14. Global Cold Chain Monitoring Market Share by Application (2022 & 2030)
15. Global Cold Chain Monitoring Market Share by Offering (2022 & 2030)
16. Global Cold Chain Monitoring Market Share by Regions (2022 & 2030)
17. Global Cold Chain Monitoring Market Share by Company (2021)
This study forecasts revenue at global, regional, and country levels from 2019 to 2030. The Brainy Insights has segmented the global cold chain monitoring market based on below mentioned segments:
Global Cold Chain Monitoring Market by Logistics:
Global Cold Chain Monitoring Market by Application:
Global Cold Chain Monitoring Market by Offering:
Global Cold Chain Monitoring Market by Region:
Research has its special purpose to undertake marketing efficiently. In this competitive scenario, businesses need information across all industry verticals; the information about customer wants, market demand, competition, industry trends, distribution channels etc. This information needs to be updated regularly because businesses operate in a dynamic environment. Our organization, The Brainy Insights incorporates scientific and systematic research procedures in order to get proper market insights and industry analysis for overall business success. The analysis consists of studying the market from a miniscule level wherein we implement statistical tools which helps us in examining the data with accuracy and precision.
Our research reports feature both; quantitative and qualitative aspects for any market. Qualitative information for any market research process are fundamental because they reveal the customer needs and wants, usage and consumption for any product/service related to a specific industry. This in turn aids the marketers/investors in knowing certain perceptions of the customers. Qualitative research can enlighten about the different product concepts and designs along with unique service offering that in turn, helps define marketing problems and generate opportunities. On the other hand, quantitative research engages with the data collection process through interviews, e-mail interactions, surveys and pilot studies. Quantitative aspects for the market research are useful to validate the hypotheses generated during qualitative research method, explore empirical patterns in the data with the help of statistical tools, and finally make the market estimations.
The Brainy Insights offers comprehensive research and analysis, based on a wide assortment of factual insights gained through interviews with CXOs and global experts and secondary data from reliable sources. Our analysts and industry specialist assume vital roles in building up statistical tools and analysis models, which are used to analyse the data and arrive at accurate insights with exceedingly informative research discoveries. The data provided by our organization have proven precious to a diverse range of companies, facilitating them to address issues such as determining which products/services are the most appealing, whether or not customers use the product in the manner anticipated, the purchasing intentions of the market and many others.
Our research methodology encompasses an idyllic combination of primary and secondary initiatives. Key phases involved in this process are listed below:

The phase involves the gathering and collecting of market data and its related information with the help of different sources & research procedures.

The data procurement stage involves in data gathering and collecting through various data sources.
This stage involves in extensive research. These data sources includes:
Purchased Database: Purchased databases play a crucial role in estimating the market sizes irrespective of the domain. Our purchased database includes:
Primary Research: The Brainy Insights interacts with leading companies and experts of the concerned domain to develop the analyst team’s market understanding and expertise. It improves and substantiates every single data presented in the market reports. Primary research mainly involves in telephonic interviews, E-mail interactions and face-to-face interviews with the raw material providers, manufacturers/producers, distributors, & independent consultants. The interviews that we conduct provides valuable data on market size and industry growth trends prevailing in the market. Our organization also conducts surveys with the various industry experts in order to gain overall insights of the industry/market. For instance, in healthcare industry we conduct surveys with the pharmacists, doctors, surgeons and nurses in order to gain insights and key information of a medical product/device/equipment which the customers are going to usage. Surveys are conducted in the form of questionnaire designed by our own analyst team. Surveys plays an important role in primary research because surveys helps us to identify the key target audiences of the market. Additionally, surveys helps to identify the key target audience engaged with the market. Our survey team conducts the survey by targeting the key audience, thus gaining insights from them. Based on the perspectives of the customers, this information is utilized to formulate market strategies. Moreover, market surveys helps us to understand the current competitive situation of the industry. To be precise, our survey process typically involve with the 360 analysis of the market. This analytical process begins by identifying the prospective customers for a product or service related to the market/industry to obtain data on how a product/service could fit into customers’ lives.

Secondary Research: The secondary data sources includes information published by the on-profit organizations such as World bank, WHO, company fillings, investor presentations, annual reports, national government documents, statistical databases, blogs, articles, white papers and others. From the annual report, we analyse a company’s revenue to understand the key segment and market share of that organization in a particular region. We analyse the company websites and adopt the product mapping technique which is important for deriving the segment revenue. In the product mapping method, we select and categorize the products offered by the companies catering to domain specific market, deduce the product revenue for each of the companies so as to get overall estimation of the market size. We also source data and analyses trends based on information received from supply side and demand side intermediaries in the value chain. The supply side denotes the data gathered from supplier, distributor, wholesaler and the demand side illustrates the data gathered from the end customers for respective market domain.

The supply side for a domain specific market is analysed by:
The demand side for the market is estimated through:
In-house Library: Apart from these third-party sources, we have our in-house library of qualitative and quantitative information. Our in-house database includes market data for various industry and domains. These data are updated on regular basis as per the changing market scenario. Our library includes, historic databases, internal audit reports and archives.
Sometimes there are instances where there is no metadata or raw data available for any domain specific market. For those cases, we use our expertise to forecast and estimate the market size in order to generate comprehensive data sets. Our analyst team adopt a robust research technique in order to produce the estimates:
Data Synthesis: This stage involves the analysis & mapping of all the information obtained from the previous step. It also involves in scrutinizing the data for any discrepancy observed while data gathering related to the market. The data is collected with consideration to the heterogeneity of sources. Robust scientific techniques are in place for synthesizing disparate data sets and provide the essential contextual information that can orient market strategies. The Brainy Insights has extensive experience in data synthesis where the data passes through various stages:


Market Deduction & Formulation: The final stage comprises of assigning data points at appropriate market spaces so as to deduce feasible conclusions. Analyst perspective & subject matter expert based holistic form of market sizing coupled with industry analysis also plays a crucial role in this stage.
This stage involves in finalization of the market size and numbers that we have collected from data integration step. With data interpolation, it is made sure that there is no gap in the market data. Successful trend analysis is done by our analysts using extrapolation techniques, which provide the best possible forecasts for the market.
Data Validation & Market Feedback: Validation is the most important step in the process. Validation & re-validation via an intricately designed process helps us finalize data-points to be used for final calculations.

The Brainy Insights interacts with leading companies and experts of the concerned domain to develop the analyst team’s market understanding and expertise. It improves and substantiates every single data presented in the market reports. The data validation interview and discussion panels are typically composed of the most experienced industry members. The participants include, however, are not limited to:
Moreover, we always validate our data and findings through primary respondents from all the major regions we are working on.


Free Customization
Fortune 500 Clients
Free Yearly Update On Purchase Of Multi/Corporate License
Companies Served Till Date