- +1-315-215-1633
- sales@thebrainyinsights.com

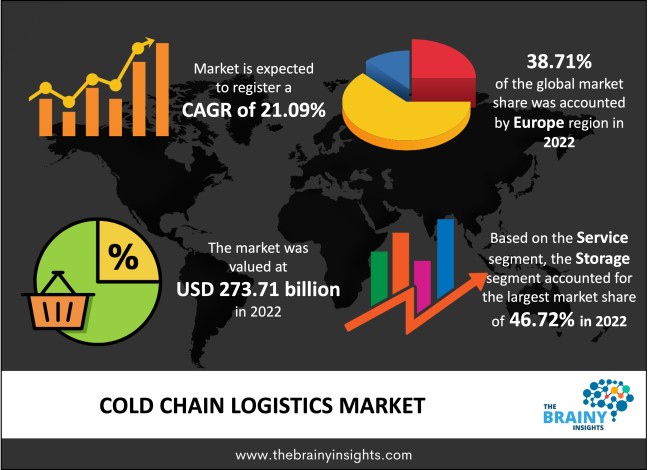
The global cold chain logistics market was valued at USD 273.71 Billion in 2022 and grew at a CAGR of 21.09% from 2023 to 2032. The market is expected to reach USD 1851.73 Billion by 2032. The growth of the cold chain logistics market can be attributed to the rise in demand for lightweight sports equipment.
The supply chain for perishable, temperature-sensitive products such as meat, fresh fruit, dairy, seafood, pharmaceuticals, chemicals, flowers, wine, etc., is known as cold chain logistics. A specified low-temperature range is typically required to retain the quality and integrity of perishable items. For example, some product groups must be refrigerated, others must be frozen, and others require extreme conditions. A series of procedures known as cold chain logistics are used to handle and move such products safely from the producer or supplier to the end user. The more distance between the initial supply and the final user, the harder it is to maintain the required temperature. The cold chain logistics process's storage, packing, and shipping phases are the most challenging. Different packing is utilized for every sort of temperature-sensitive transport.
Get an overview of this study by requesting a free sample
Increasing demand for cold chain logistics: The fast expansion of the food industry has resulted in high demand for service providers. A wide variety of high-end products with short shelf life and greater temperature sensitivity are entering the market, driving demand for skilled cold chain logistics providers. More than ever, the cold chain business is globalized. This is one reason the goods forwarding sector is under pressure to maintain consistent quality and temperature control throughout shipping. The expansion of e-grocery services is another recent development in the cold chain industry. The increase in the number of refrigerated warehouses, which offer the optimum storage environment for temperature-sensitive goods, is a prominent trend in the cold chain transportation industry.
Lack of infrastructure: Most cold chain logistics companies need help to cope with the existing infrastructure. The reach of many companies varies between specified ranges, and thus, this serves as a restraint, especially in developing and under-developed companies. The interventions and services are only partially designed to be equipped in stable environments. The manufacturers must focus on efficient-resource settings that can be used for delivery over more considerable distances.
Increasing investment in food and beverages: Food and beverages are proliferating due to increased demand for food additives, health and natural foods, functional food and beverages, packaged foods, energy drinks, and many more. The high demand for more nutritious food, a hectic lifestyle, and better packaging is helping the growing food and beverage market. The sector is propelling mainly because of developed and developing countries like USA, UK, Germany, France, China, India, and Japan, as these economies are improving, and more people are spending on convenient food and beverages. Also, the organization involved in the food and beverage sector are now focusing on warehousing and logistics as this is becoming the standard. These factors have contributed to the growth of the cold chain logistics market.
The regions analyzed for the market include North America, Europe, South America, Asia Pacific, the Middle East, and Africa. Europe emerged as the most significant cold chain logistics market, with a 38.71% market revenue share in 2022.
Europe region will account for the largest market share with revenue growth. The growing disposable income across the regional country leads to high demand for cold chain logistics. Also, many manufacturers are now utilizing cold chain logistics due to the surge in demand for convenient food products and perishable ingredients.
Europe region Cold Chain Logistics Market Share in 2022- 38.71%
www.thebrainyinsights.com
Check the geographical analysis of this market by requesting a free sample
The service segment is divided into storage, transportation and value-added services. The storage segment dominated the market, with a share of around 46.72% in 2022. Cold chain logistics provide storage facilities for perishable food products. Many manufacturers opt for the service provided by the logistics company.
The temperature segment is divided into chilled and frozen. The chilled segment dominated the market, with a share of around 57.12% in 2022. Many perishable food products must be kept in chilled conditions to extend their shelf life by weeks. With the rise in demand for online food delivery, the segment is expected to grow further.
The application segment is divided into dairy & frozen desserts, fish, meat, and seafood products, fruits & vegetables, bakery & confectionery products and others. The dairy & frozen desserts segment dominated the market, with a share of around 34.92% in 2022. Consumer demand for better food options has prompted the development of several new dessert items. Dessert foods are increasingly consumed in between the traditional meal patterns of breakfast, lunch, and dinner in Western food culture.
Report Description:
| Attribute | Description |
|---|---|
| Market Size | Revenue (USD Billion) |
| Market size value in 2022 | USD 273.71 Billion |
| Market size value in 2032 | USD 1851.73 Billion |
| CAGR (2023 to 2032) | 21.09% |
| Historical data | 2019-2021 |
| Base Year | 2022 |
| Forecast | 2023-2032 |
| Region | The regions analyzed for the market are Asia Pacific, Europe, South America, North America, and Middle East & Africa. Furthermore, the regions are further analyzed at the country level. |
| Segments | Service, Temperature and Application |
As per The Brainy Insights, the size of the cold chain logistics market was valued 273.21 billion in 2022 to USD 1851.73 Billion by 2032.
Global cold chain logistics market is growing at a CAGR of 21.09% during the forecast period 2023-2032.
Asia Pacific region emerged as the largest market for the cold chain logistics.
The market's growth will be influenced by the growing usage of composites in sports equipment.
The lack of infrastructure can hamper the market growth.
The increasing investment in e-commerce industry is providing huge opportunities to the market.
1. Introduction
1.1. Objectives of the Study
1.2. Market Definition
1.3. Research Scope
1.4. Currency
1.5. Key Target Audience
2. Research Methodology and Assumptions
3. Executive Summary
4. Premium Insights
4.1. Porter’s Five Forces Analysis
4.2. Value Chain Analysis
4.3. Top Investment Pockets
4.3.1. Market Attractiveness Analysis By Service
4.3.2. Market Attractiveness Analysis By Temperature
4.3.3. Market Attractiveness Analysis By Application
4.3.4. Market Attractiveness Analysis By Region
4.4. Industry Trends
5. Market Dynamics
5.1. Market Evaluation
5.2. Drivers
5.2.1. Increasing demand for perishable food products
5.3. Restraints
5.3.1. Infrastructure issues
5.4. Opportunities
5.4.1. Increasing investment in e-commerce industry
5.5. Challenges
5.5.1. High operational cost
6. Global Cold Chain Logistics Market Analysis and Forecast, By Service
6.1. Segment Overview
6.2. Storage
6.3. Transportation
6.4. Value-added Services
7. Global Cold Chain Logistics Market Analysis and Forecast, By Temperature
7.1. Segment Overview
7.2. Chilled
7.3. Frozen
8. Global Cold Chain Logistics Market Analysis and Forecast, By Application
8.1. Segment Overview
8.2. Dairy & Frozen Desserts
8.3. Fish, Meat, and Seafood Products
8.4. Fruits & Vegetables
8.5. Bakery & Confectionery Products
8.6. Others
9. Global Cold Chain Logistics Market Analysis and Forecast, By Regional Analysis
9.1. Segment Overview
9.2. North America
9.2.1. U.S.
9.2.2. Canada
9.2.3. Mexico
9.3. Europe
9.3.1. Germany
9.3.2. France
9.3.3. U.K.
9.3.4. Italy
9.3.5. Spain
9.4. Asia-Pacific
9.4.1. Japan
9.4.2. China
9.4.3. India
9.5. South America
9.5.1. Brazil
9.6. Middle East and Africa
9.6.1. UAE
9.6.2. South Africa
10. Global Cold Chain Logistics Market-Competitive Landscape
10.1. Overview
10.2. Market Share of Key Players in the Cold Chain Logistics Market
10.2.1. Global Company Market Share
10.2.2. North America Company Market Share
10.2.3. Europe Company Market Share
10.2.4. APAC Company Market Share
10.3. Competitive Situations and Trends
10.3.1. Product Launches and Developments
10.3.2. Partnerships, Collaborations, and Agreements
10.3.3. Mergers & Acquisitions
10.3.4. Expansions
11. Company Profiles
11.1. AmeriCold Logistics LLC
11.1.1. Business Overview
11.1.2. Company Snapshot
11.1.3. Company Market Share Analysis
11.1.4. Company Product Portfolio
11.1.5. Recent Developments
11.1.6. SWOT Analysis
11.2. Preferred Freezer Services Inc.
11.2.1. Business Overview
11.2.2. Company Snapshot
11.2.3. Company Market Share Analysis
11.2.4. Company Product Portfolio
11.2.5. Recent Developments
11.2.6. SWOT Analysis
11.3. Lineage Logistics Holdings LLC
11.3.1. Business Overview
11.3.2. Company Snapshot
11.3.3. Company Market Share Analysis
11.3.4. Company Product Portfolio
11.3.5. Recent Developments
11.3.6. SWOT Analysis
11.4. Nichirei Corporation
11.4.1. Business Overview
11.4.2. Company Snapshot
11.4.3. Company Market Share Analysis
11.4.4. Company Product Portfolio
11.4.5. Recent Developments
11.4.6. SWOT Analysis
11.5. Snowman Logistics Ltd.
11.5.1. Business Overview
11.5.2. Company Snapshot
11.5.3. Company Market Share Analysis
11.5.4. Company Product Portfolio
11.5.5. Recent Developments
11.5.6. SWOT Analysis
11.6. Burris Logistics Inc.
11.6.1. Business Overview
11.6.2. Company Snapshot
11.6.3. Company Market Share Analysis
11.6.4. Company Product Portfolio
11.6.5. Recent Developments
11.6.6. SWOT Analysis
11.7. AGRO Merchants Group LLC
1.1.1. Business Overview
1.1.2. Company Snapshot
1.1.3. Company Market Share Analysis
1.1.4. Company Product Portfolio
1.1.5. Recent Developments
1.1.6. SWOT Analysis
11.8. Kloosterboer Group B.V
11.8.1. Business Overview
11.8.2. Company Snapshot
11.8.3. Company Market Share Analysis
11.8.4. Company Product Portfolio
11.8.5. Recent Developments
11.8.6. SWOT Analysis
11.9. Tippmann Group
11.9.1. Business Overview
11.9.2. Company Snapshot
11.9.3. Company Market Share Analysis
11.9.4. Company Product Portfolio
11.9.5. Recent Developments
11.9.6. SWOT Analysis
11.10. Conestoga Cold Storage
11.10.1. Business Overview
11.10.2. Company Snapshot
11.10.3. Company Market Share Analysis
11.10.4. Company Product Portfolio
11.10.5. Recent Developments
11.10.6. SWOT Analysis
11.11. Congebec Logistics Inc
11.11.1. Business Overview
11.11.2. Company Snapshot
11.11.3. Company Market Share Analysis
11.11.4. Company Product Portfolio
11.11.5. Recent Developments
11.11.6. SWOT Analysis
List of Table
1. Global Cold Chain Logistics Market, By Service, 2019-2032 (USD Billion)
2. Global Storage, Cold Chain Logistics Market, By Region, 2019-2032 (USD Billion)
3. Global Transportation, Cold Chain Logistics Market, By Region, 2019-2032 (USD Billion)
4. Global Value-added Services, Cold Chain Logistics Market, By Region, 2019-2032 (USD Billion)
5. Global Cold Chain Logistics Market, By Temperature, 2019-2032 (USD Billion)
6. Global Chilled, Cold Chain Logistics Market, By Region, 2019-2032 (USD Billion)
7. Global Frozen, Cold Chain Logistics Market, By Region, 2019-2032 (USD Billion)
8. Global Cold Chain Logistics Market, By Application, 2019-2032 (USD Billion)
9. Global Dairy & Frozen Desserts, Cold Chain Logistics Market, By Region, 2019-2032 (USD Billion)
10. Global Fish, Meat, and Seafood Products, Cold Chain Logistics Market, By Region, 2019-2032 (USD Billion)
11. Global Fruits & Vegetables, Cold Chain Logistics Market, By Region, 2019-2032 (USD Billion)
12. Global Bakery & Confectionery Products, Cold Chain Logistics Market, By Region, 2019-2032 (USD Billion)
13. Global Others, Cold Chain Logistics Market, By Region, 2019-2032 (USD Billion)
14. Global Cold Chain Logistics Market, By Region, 2019-2032 (USD Billion)
15. North America Cold Chain Logistics Market, By Service, 2019-2032 (USD Billion)
16. North America Cold Chain Logistics Market, By Temperature, 2019-2032 (USD Billion)
17. North America Cold Chain Logistics Market, By Application, 2019-2032 (USD Billion)
18. U.S. Cold Chain Logistics Market, By Service, 2019-2032 (USD Billion)
19. U.S. Cold Chain Logistics Market, By Temperature, 2019-2032 (USD Billion)
20. U.S. Cold Chain Logistics Market, By Application, 2019-2032 (USD Billion)
21. Canada Cold Chain Logistics Market, By Service, 2019-2032 (USD Billion)
22. Canada Cold Chain Logistics Market, By Temperature, 2019-2032 (USD Billion)
23. Canada Cold Chain Logistics Market, By Application, 2019-2032 (USD Billion)
24. Mexico Cold Chain Logistics Market, By Service, 2019-2032 (USD Billion)
25. Mexico Cold Chain Logistics Market, By Temperature, 2019-2032 (USD Billion)
26. Mexico Cold Chain Logistics Market, By Application, 2019-2032 (USD Billion)
27. Europe Cold Chain Logistics Market, By Service, 2019-2032 (USD Billion)
28. Europe Cold Chain Logistics Market, By Temperature, 2019-2032 (USD Billion)
29. Europe Cold Chain Logistics Market, By Application, 2019-2032 (USD Billion)
30. Germany Cold Chain Logistics Market, By Service, 2019-2032 (USD Billion)
31. Germany Cold Chain Logistics Market, By Temperature, 2019-2032 (USD Billion)
32. Germany Cold Chain Logistics Market, By Application, 2019-2032 (USD Billion)
33. France Cold Chain Logistics Market, By Service, 2019-2032 (USD Billion)
34. France Cold Chain Logistics Market, By Temperature, 2019-2032 (USD Billion)
35. France Cold Chain Logistics Market, By Application, 2019-2032 (USD Billion)
36. U.K. Cold Chain Logistics Market, By Service, 2019-2032 (USD Billion)
37. U.K. Cold Chain Logistics Market, By Temperature, 2019-2032 (USD Billion)
38. U.K. Cold Chain Logistics Market, By Application, 2019-2032 (USD Billion)
39. Italy Cold Chain Logistics Market, By Service, 2019-2032 (USD Billion)
40. Italy Cold Chain Logistics Market, By Temperature, 2019-2032 (USD Billion)
41. Italy Cold Chain Logistics Market, By Application, 2019-2032 (USD Billion)
42. Spain Cold Chain Logistics Market, By Service, 2019-2032 (USD Billion)
43. Spain Cold Chain Logistics Market, By Temperature, 2019-2032 (USD Billion)
44. Spain Cold Chain Logistics Market, By Application, 2019-2032 (USD Billion)
45. Asia Pacific Cold Chain Logistics Market, By Service, 2019-2032 (USD Billion)
46. Asia Pacific Cold Chain Logistics Market, By Temperature, 2019-2032 (USD Billion)
47. Asia Pacific Cold Chain Logistics Market, By Application, 2019-2032 (USD Billion)
48. Japan Cold Chain Logistics Market, By Service, 2019-2032 (USD Billion)
49. Japan Cold Chain Logistics Market, By Temperature, 2019-2032 (USD Billion)
50. Japan Cold Chain Logistics Market, By Application, 2019-2032 (USD Billion)
51. China Cold Chain Logistics Market, By Service, 2019-2032 (USD Billion)
52. China Cold Chain Logistics Market, By Temperature, 2019-2032 (USD Billion)
53. China Cold Chain Logistics Market, By Application, 2019-2032 (USD Billion)
54. India Cold Chain Logistics Market, By Service, 2019-2032 (USD Billion)
55. India Cold Chain Logistics Market, By Temperature, 2019-2032 (USD Billion)
56. India Cold Chain Logistics Market, By Application, 2019-2032 (USD Billion)
57. South America Cold Chain Logistics Market, By Service, 2019-2032 (USD Billion)
58. South America Cold Chain Logistics Market, By Temperature, 2019-2032 (USD Billion)
59. South America Cold Chain Logistics Market, By Application, 2019-2032 (USD Billion)
60. Brazil Cold Chain Logistics Market, By Service, 2019-2032 (USD Billion)
61. Brazil Cold Chain Logistics Market, By Temperature, 2019-2032 (USD Billion)
62. Brazil Cold Chain Logistics Market, By Application, 2019-2032 (USD Billion)
63. Middle East and Africa Cold Chain Logistics Market, By Service, 2019-2032 (USD Billion)
64. Middle East and Africa Cold Chain Logistics Market, By Temperature, 2019-2032 (USD Billion)
65. Middle East and Africa Cold Chain Logistics Market, By Application, 2019-2032 (USD Billion)
66. UAE Cold Chain Logistics Market, By Service, 2019-2032 (USD Billion)
67. UAE Cold Chain Logistics Market, By Temperature, 2019-2032 (USD Billion)
68. UAE Cold Chain Logistics Market, By Application, 2019-2032 (USD Billion)
69. South Africa Cold Chain Logistics Market, By Service, 2019-2032 (USD Billion)
70. South Africa Cold Chain Logistics Market, By Temperature, 2019-2032 (USD Billion)
71. South Africa Cold Chain Logistics Market, By Application, 2019-2032 (USD Billion)
List of Figures
1. Global Cold Chain Logistics Market Segmentation
2. Cold Chain Logistics Market: Research Methodology
3. Market Size Estimation Methodology: Bottom-Up Approach
4. Market Size Estimation Methodology: Top-Down Approach
5. Data Triangulation
6. Porter’s Five Forces Analysis
7. Value Chain Analysis
8. Global Cold Chain Logistics Market Attractiveness Analysis By Service
9. Global Cold Chain Logistics Market Attractiveness Analysis By Temperature
10. Global Cold Chain Logistics Market Attractiveness Analysis By Application
11. Global Cold Chain Logistics Market Attractiveness Analysis By Region
12. Global Cold Chain Logistics Market: Dynamics
13. Global Cold Chain Logistics Market Share By Service (2022 & 2032)
14. Global Cold Chain Logistics Market Share by Temperature (2022 & 2032)
15. Global Cold Chain Logistics Market Share by Application (2022 & 2032)
16. Global Cold Chain Logistics Market Share by Regions (2022 & 2032)
17. Global Cold Chain Logistics Market Share by Company (2022)
This study forecasts revenue at global, regional, and country levels from 2023 to 2032. The Brainy Insights has segmented the global Cold Chain Logistics market on the basis of below mentioned segments:
Global Cold Chain Logistics Market by Service:
Global Cold Chain Logistics Market by Temperature:
Global Cold Chain Logistics Market by Application:
Global Cold Chain Logistics Market by Region:
Research has its special purpose to undertake marketing efficiently. In this competitive scenario, businesses need information across all industry verticals; the information about customer wants, market demand, competition, industry trends, distribution channels etc. This information needs to be updated regularly because businesses operate in a dynamic environment. Our organization, The Brainy Insights incorporates scientific and systematic research procedures in order to get proper market insights and industry analysis for overall business success. The analysis consists of studying the market from a miniscule level wherein we implement statistical tools which helps us in examining the data with accuracy and precision.
Our research reports feature both; quantitative and qualitative aspects for any market. Qualitative information for any market research process are fundamental because they reveal the customer needs and wants, usage and consumption for any product/service related to a specific industry. This in turn aids the marketers/investors in knowing certain perceptions of the customers. Qualitative research can enlighten about the different product concepts and designs along with unique service offering that in turn, helps define marketing problems and generate opportunities. On the other hand, quantitative research engages with the data collection process through interviews, e-mail interactions, surveys and pilot studies. Quantitative aspects for the market research are useful to validate the hypotheses generated during qualitative research method, explore empirical patterns in the data with the help of statistical tools, and finally make the market estimations.
The Brainy Insights offers comprehensive research and analysis, based on a wide assortment of factual insights gained through interviews with CXOs and global experts and secondary data from reliable sources. Our analysts and industry specialist assume vital roles in building up statistical tools and analysis models, which are used to analyse the data and arrive at accurate insights with exceedingly informative research discoveries. The data provided by our organization have proven precious to a diverse range of companies, facilitating them to address issues such as determining which products/services are the most appealing, whether or not customers use the product in the manner anticipated, the purchasing intentions of the market and many others.
Our research methodology encompasses an idyllic combination of primary and secondary initiatives. Key phases involved in this process are listed below:

The phase involves the gathering and collecting of market data and its related information with the help of different sources & research procedures.

The data procurement stage involves in data gathering and collecting through various data sources.
This stage involves in extensive research. These data sources includes:
Purchased Database: Purchased databases play a crucial role in estimating the market sizes irrespective of the domain. Our purchased database includes:
Primary Research: The Brainy Insights interacts with leading companies and experts of the concerned domain to develop the analyst team’s market understanding and expertise. It improves and substantiates every single data presented in the market reports. Primary research mainly involves in telephonic interviews, E-mail interactions and face-to-face interviews with the raw material providers, manufacturers/producers, distributors, & independent consultants. The interviews that we conduct provides valuable data on market size and industry growth trends prevailing in the market. Our organization also conducts surveys with the various industry experts in order to gain overall insights of the industry/market. For instance, in healthcare industry we conduct surveys with the pharmacists, doctors, surgeons and nurses in order to gain insights and key information of a medical product/device/equipment which the customers are going to usage. Surveys are conducted in the form of questionnaire designed by our own analyst team. Surveys plays an important role in primary research because surveys helps us to identify the key target audiences of the market. Additionally, surveys helps to identify the key target audience engaged with the market. Our survey team conducts the survey by targeting the key audience, thus gaining insights from them. Based on the perspectives of the customers, this information is utilized to formulate market strategies. Moreover, market surveys helps us to understand the current competitive situation of the industry. To be precise, our survey process typically involve with the 360 analysis of the market. This analytical process begins by identifying the prospective customers for a product or service related to the market/industry to obtain data on how a product/service could fit into customers’ lives.

Secondary Research: The secondary data sources includes information published by the on-profit organizations such as World bank, WHO, company fillings, investor presentations, annual reports, national government documents, statistical databases, blogs, articles, white papers and others. From the annual report, we analyse a company’s revenue to understand the key segment and market share of that organization in a particular region. We analyse the company websites and adopt the product mapping technique which is important for deriving the segment revenue. In the product mapping method, we select and categorize the products offered by the companies catering to domain specific market, deduce the product revenue for each of the companies so as to get overall estimation of the market size. We also source data and analyses trends based on information received from supply side and demand side intermediaries in the value chain. The supply side denotes the data gathered from supplier, distributor, wholesaler and the demand side illustrates the data gathered from the end customers for respective market domain.

The supply side for a domain specific market is analysed by:
The demand side for the market is estimated through:
In-house Library: Apart from these third-party sources, we have our in-house library of qualitative and quantitative information. Our in-house database includes market data for various industry and domains. These data are updated on regular basis as per the changing market scenario. Our library includes, historic databases, internal audit reports and archives.
Sometimes there are instances where there is no metadata or raw data available for any domain specific market. For those cases, we use our expertise to forecast and estimate the market size in order to generate comprehensive data sets. Our analyst team adopt a robust research technique in order to produce the estimates:
Data Synthesis: This stage involves the analysis & mapping of all the information obtained from the previous step. It also involves in scrutinizing the data for any discrepancy observed while data gathering related to the market. The data is collected with consideration to the heterogeneity of sources. Robust scientific techniques are in place for synthesizing disparate data sets and provide the essential contextual information that can orient market strategies. The Brainy Insights has extensive experience in data synthesis where the data passes through various stages:


Market Deduction & Formulation: The final stage comprises of assigning data points at appropriate market spaces so as to deduce feasible conclusions. Analyst perspective & subject matter expert based holistic form of market sizing coupled with industry analysis also plays a crucial role in this stage.
This stage involves in finalization of the market size and numbers that we have collected from data integration step. With data interpolation, it is made sure that there is no gap in the market data. Successful trend analysis is done by our analysts using extrapolation techniques, which provide the best possible forecasts for the market.
Data Validation & Market Feedback: Validation is the most important step in the process. Validation & re-validation via an intricately designed process helps us finalize data-points to be used for final calculations.

The Brainy Insights interacts with leading companies and experts of the concerned domain to develop the analyst team’s market understanding and expertise. It improves and substantiates every single data presented in the market reports. The data validation interview and discussion panels are typically composed of the most experienced industry members. The participants include, however, are not limited to:
Moreover, we always validate our data and findings through primary respondents from all the major regions we are working on.


Free Customization
Fortune 500 Clients
Free Yearly Update On Purchase Of Multi/Corporate License
Companies Served Till Date