- +1-315-215-1633
- sales@thebrainyinsights.com

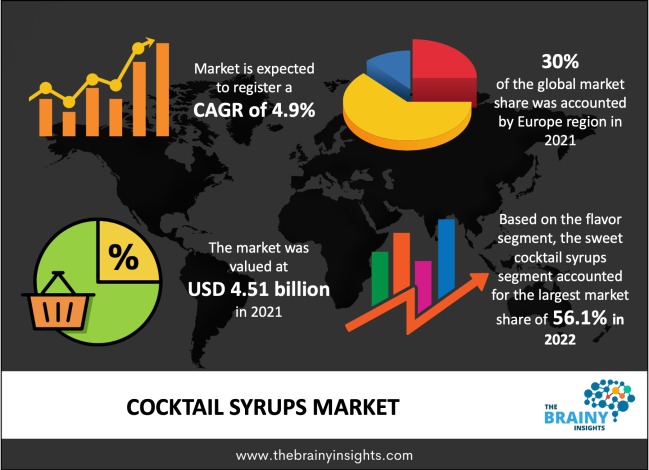
The cocktail syrups market was valued at USD 4.51 billion in 2021 and is expected to reach USD 6.32 billion by 2030, expanding at a CAGR of 4.9% from 2022 to 2030. The growing cocktail culture is anticipated to drive the market over the forecast period. Cocktail syrups are available in many varieties such as fruit, botanical, and spicy flavors, making them an interesting addition to alcoholic beverages. Premiumization of the product through improved flavors, taste, quality, and packaging is further expected to drive the demand.
Cocktail syrups are highly popular in western countries such as the US, Canada, the UK, Germany, and France. High production and consumption of these products have been contributing to the growth of the global market. The young generation in these countries has been opting for low-alcohol drinks and cocktails.
According to an article published by The Spirits Business Magazine in March 2019, Summer Drinks Trends Report surveyed approximately 1,000 consumers in London on their drinking habits, preferences, and behaviors over the summer. The report concluded that the sales of cocktails in the summer increased by 66% owing to hot weather conditions.
Get an overview of this study by requesting a free sample
The local product manufacturers are extending their product offerings in cocktail syrups to gain maximum consumer reach. For instance, Jalousy Cocktail Collection offers premium artisanal cocktails, which contain several cocktail syrups. Similarly, Craft Gastro Bar in Belgium offers medium and modern mixology cocktails as per the local consumers’ needs. Such offerings are boosting the demand for local & hand-crafted cocktail syrups.
Companies have also been focusing on increasing consumer reach by strengthening their presence. For instance, in January 2021, ODK Orsadrinks announced the availability of its ODK syrups and ODK Barista syrups in all the stores of IKEA Italy. Lately, companies have also been focusing on funds and investments to boost sales.
The fruit syrups led the market with a share of more than 55% in 2021. According to the Bacardi Holiday Survey 2020, 25% of users’ favor creating cocktails at home with natural and organic ingredients. The report further states that fruits are one of the most preferred ingredients among cocktail makers. Around 30% of those surveyed favored fresh fruits and berries in their cocktails. Growing health consciousness among consumers worldwide, combined with the increasing popularity of homemade cocktails, is likely to drive the demand for fruit syrups in the coming years.
Botanical syrups are made from herbs & spices and are anticipated to register the fastest growth during the forecast period from 2022-2030. Botanical-infused cocktail syrups are gaining traction owing to their refreshing taste as well as health benefits. For instance, herbs bring warmth to the body along with a fresh aroma to the cocktails. Further, basil offers a range of benefits, including prevention from heart disease, arthritis, and diabetes. Similarly, cardamom, cinnamon, cilantro, and coriander are some of the most preferred herbs that not only add aroma and flavor to the drinks but also aid in digestion and reduce nausea.
Sweet cocktail syrups held the largest market with a share of 56.1% in 2021. Sweet cocktail syrups are widely popular among consumers across the world because they perfectly balance the bitterness and sourness of harsh spirits like rum, whisky, and gin. Furthermore, sweet syrups enhance the flavors of other ingredients used in the cocktail and improve the mouthfeel or density of the drink, making it taste less thin.
Along with enhancing the flavor, flavored syrups function as an artificial sweetener. Manufacturers have started offering a wide selection of syrups with natural sweeteners in response to the growing taste of rich fruit syrups. For example, in June 2021, Torani, a leading flavor maker, added sweet flavors to its existing flavor lineup, which includes Chocolate Hazelnut Sauce, Mangonada Syrup, and Black Sugar Syrup.
B2B distribution channel led the market in 2021. Before the outbreak of Covid-19, most consumers preferred to consume cocktails out of their homes while socializing in clubs & bars owing to the availability of perfect cocktails at these places. Bars & clubs have mixologists, who are trained in making cocktails, which is driving the demand for cocktails through this channel.
However, the demand through the B2C channel is expected to register faster growth during the forecast period owing to rising trends of DIY cocktails at home. This trend significantly increased during the outbreak of the Covid-19 pandemic and is likely to stay in the coming years. Moreover, the easy availability of syrups through online channels also influences the consumer to order and try DIY cocktails at home.
Europe accounted for the largest market, with a share of more than 30% in 2021. The demand for low-alcoholic cocktails and flavored beverages is rising among millennials across the region, which is anticipated to be a prominent factor driving the Europe cocktail syrups market growth. The consumption of cocktail syrups is highly popular in European countries like the U.K., Germany, and France, owing to the presence of various manufacturers offering innovative products.
Premiumization of cocktail syrups through improved flavors, taste, quality and packaging is further expected to drive the demand, thereby boosting the Europe cocktail syrups market growth. For instance, Agua de Sevilla is a popular Spanish cocktail made using pineapple juice/syrup, sugar, cava, and whiskey. This cocktail is a staple at numerous nightclubs and is usually served in large pitchers, which is expected to drive the demand for cocktail syrups in the upcoming years.
Asia Pacific is anticipated to register the fastest growth rate during the forecast period. The demand and consumption of cocktails are gaining momentum in the Asia Pacific as consumers seek safer and more mindful drinking options, especially millennials and Gen Z. Several bartenders are increasingly taking mixology inspiration to provide unique cocktails to the consumers in this region. For instance, several cocktails made with fruit juices, fruit pulps, and various other syrups have become popular in Japan among consumers who are reconsidering drinking beer or heavy spirits as they are worried about being hungover the next day. This has been driving the use of various syrups to create a host of cocktails.
Segments Covered in the Report
1. Introduction
1.1. Objectives of the Study
1.2. Market Definition
1.3. Research Scope
1.4. Currency
1.5. Key Target Audience
2. Research Methodology and Assumptions
3. Executive Summary
4. Premium Insights
4.1. Porter’s Five Forces Analysis
4.2. Value Chain Analysis
4.3. Top Investment Pockets
4.3.1. Market Attractiveness Analysis by Type
4.3.2. Market Attractiveness Analysis by Flavor
4.3.3. Market Attractiveness Analysis by Distribution Channel
4.3.4. Market Attractiveness Analysis by Region
4.4. Industry Trends
5. Market Dynamics
5.1. Market Evaluation
5.2. Drivers
5.2.1. The growing preference for cocktails among the young generation
5.3. Restraints
5.3.1. Lack of Awareness About the Availability of Cocktail Syrups
5.4. Opportunities
5.4.1. Rising Demand of Cocktail Syrups from Bars
6. Global Cocktail Syrups Market Analysis and Forecast, By Type
6.1. Segment Overview
6.2. Fruit
6.3. Botanical
6.4. Vanilla
6.5. Others
7. Global Cocktail Syrups Market Analysis and Forecast, By Flavor
7.1. Segment Overview
7.2. Sweet
7.3. Bitter
7.4. Sour
7.5. Others
8. Global Cocktail Syrups Market Analysis and Forecast, By Distribution Channel
8.1. Segment Overview
8.2. B2C
8.2.1. Supermarkets & Hypermarkets
8.2.2. Online
8.2.3. Others
8.3. B2B
9. Global Cocktail Syrups Market Analysis and Forecast, By Regional Analysis
9.1. Segment Overview
9.2. North America
9.2.1. U.S.
9.2.2. Canada
9.2.3. Mexico
9.3. Europe
9.3.1. Germany
9.3.2. France
9.3.3. U.K.
9.3.4. Italy
9.3.5. Spain
9.4. Asia-Pacific
9.4.1. Japan
9.4.2. China
9.4.3. India
9.5. South America
9.5.1. Brazil
9.6. Middle East and Africa
9.6.1. UAE
9.6.2. South Africa
10. Global Cocktail Syrups Market-Competitive Landscape
10.1. Overview
10.2. Market Share of Key Players in the Cocktail Syrups Market
10.2.1. Global Company Market Share
10.2.2. North America Company Market Share
10.2.3. Europe Company Market Share
10.2.4. APAC Company Market Share
10.3. Competitive Situations and Trends
10.3.1. Product Launches and Developments
10.3.2. Partnerships, Collaborations, and Agreements
10.3.3. Mergers & Acquisitions
10.3.4. Expansions
11. Company Profiles
11.1. MONIN
11.1.1. Business Overview
11.1.2. Company Snapshot
11.1.3. Company Market Share Analysis
11.1.4. Company Product Portfolio
11.1.5. Recent Developments
11.1.6. SWOT Analysis
11.2. Liber & Co.
11.2.1. Business Overview
11.2.2. Company Snapshot
11.2.3. Company Market Share Analysis
11.2.4. Company Product Portfolio
11.2.5. Recent Developments
11.2.6. SWOT Analysis
11.3. Toschi Vignola s.r.l
11.3.1. Business Overview
11.3.2. Company Snapshot
11.3.3. Company Market Share Analysis
11.3.4. Company Product Portfolio
11.3.5. Recent Developments
11.3.6. SWOT Analysis
11.4. The Simple Syrup Co
11.4.1. Business Overview
11.4.2. Company Snapshot
11.4.3. Company Market Share Analysis
11.4.4. Company Product Portfolio
11.4.5. Recent Developments
11.4.6. SWOT Analysis
11.5. Teisseire
11.5.1. Business Overview
11.5.2. Company Snapshot
11.5.3. Company Market Share Analysis
11.5.4. Company Product Portfolio
11.5.5. Recent Developments
11.5.6. SWOT Analysis
11.6. Small Hand Foods
11.6.1. Business Overview
11.6.2. Company Snapshot
11.6.3. Company Market Share Analysis
11.6.4. Company Product Portfolio
11.6.5. Recent Developments
11.6.6. SWOT Analysis
11.7. Giffard
11.7.1. Business Overview
11.7.2. Company Snapshot
11.7.3. Company Market Share Analysis
11.7.4. Company Product Portfolio
11.7.5. Recent Developments
11.7.6. SWOT Analysis
11.8. Pratt Standard
11.8.1. Business Overview
11.8.2. Company Snapshot
11.8.3. Company Market Share Analysis
11.8.4. Company Product Portfolio
11.8.5. Recent Developments
11.8.6. SWOT Analysis
11.9. Bristol Syrup Company
11.9.1. Business Overview
11.9.2. Company Snapshot
11.9.3. Company Market Share Analysis
11.9.4. Company Product Portfolio
11.9.5. Recent Developments
11.9.6. SWOT Analysis
11.10. Blossoms Syrup
11.10.1. Business Overview
11.10.2. Company Snapshot
11.10.3. Company Market Share Analysis
11.10.4. Company Product Portfolio
11.10.5. Recent Developments
11.10.6. SWOT Analysis
List of Table
1. Global Cocktail Syrups Market, By Type, 2019-2030 (USD Billion)
2. Global Fruit Cocktail Syrups Market, By Region, 2019-2030 (USD Billion)
3. Global Botanical Cocktail Syrups Market, By Region, 2019-2030 (USD Billion)
4. Global Vanilla Cocktail Syrups Market, By Region, 2019-2030 (USD Billion)
5. Global Others Cocktail Syrups Market, By Region, 2019-2030 (USD Billion)
6. Global Cocktail Syrups Market, By Flavor, 2019-2030 (USD Billion)
7. Global Sweet Cocktail Syrups Market, By Region, 2019-2030 (USD Billion)
8. Global Bitter Cocktail Syrups Market, By Region, 2019-2030 (USD Billion)
9. Global Sour Cocktail Syrups Market, By Region, 2019-2030 (USD Billion)
10. Global Others Cocktail Syrups Market, By Region, 2019-2030 (USD Billion)
11. Global Cocktail Syrups Market, By Distribution Channel, 2019-2030 (USD Billion)
12. Global B2C Cocktail Syrups Market, By Region, 2019-2030 (USD Billion)
13. Global B2B Cocktail Syrups Market, By Region, 2019-2030 (USD Billion)
14. Global Cocktail Syrups Market, By Region, 2019-2030 (USD Billion)
15. North America Cocktail Syrups Market, By Type, 2019-2030 (USD Billion)
16. North America Cocktail Syrups Market, By Flavor, 2019-2030 (USD Billion)
17. North America Cocktail Syrups Market, By Distribution Channel, 2019-2030 (USD Billion)
18. U.S. Cocktail Syrups Market, By Type, 2019-2030 (USD Billion)
19. U.S. Cocktail Syrups Market, By Flavor, 2019-2030 (USD Billion)
20. U.S. Cocktail Syrups Market, By Distribution Channel, 2019-2030 (USD Billion)
21. Canada Cocktail Syrups Market, By Type, 2019-2030 (USD Billion)
22. Canada Cocktail Syrups Market, By Flavor, 2019-2030 (USD Billion)
23. Canada Cocktail Syrups Market, By Distribution Channel, 2019-2030 (USD Billion)
24. Mexico Cocktail Syrups Market, By Type, 2019-2030 (USD Billion)
25. Mexico Cocktail Syrups Market, By Flavor, 2019-2030 (USD Billion)
26. Mexico Cocktail Syrups Market, By Distribution Channel, 2019-2030 (USD Billion)
27. Europe Cocktail Syrups Market, By Type, 2019-2030 (USD Billion)
28. Europe Cocktail Syrups Market, By Flavor, 2019-2030 (USD Billion)
29. Europe Cocktail Syrups Market, By Distribution Channel, 2019-2030 (USD Billion)
30. Germany Cocktail Syrups Market, By Type, 2019-2030 (USD Billion)
31. Germany Cocktail Syrups Market, By Flavor, 2019-2030 (USD Billion)
32. Germany Cocktail Syrups Market, By Distribution Channel, 2019-2030 (USD Billion)
33. France Cocktail Syrups Market, By Type, 2019-2030 (USD Billion)
34. France Cocktail Syrups Market, By Flavor, 2019-2030 (USD Billion)
35. France Cocktail Syrups Market, By Distribution Channel, 2019-2030 (USD Billion)
36. U.K. Cocktail Syrups Market, By Type, 2019-2030 (USD Billion)
37. U.K. Cocktail Syrups Market, By Flavor, 2019-2030 (USD Billion)
38. U.K. Cocktail Syrups Market, By Distribution Channel, 2019-2030 (USD Billion)
39. Italy Cocktail Syrups Market, By Type, 2019-2030 (USD Billion)
40. Italy Cocktail Syrups Market, By Flavor, 2019-2030 (USD Billion)
41. Italy Cocktail Syrups Market, By Distribution Channel, 2019-2030 (USD Billion)
42. Spain Cocktail Syrups Market, By Type, 2019-2030 (USD Billion)
43. Spain Cocktail Syrups Market, By Flavor, 2019-2030 (USD Billion)
44. Spain Cocktail Syrups Market, By Distribution Channel, 2019-2030 (USD Billion)
45. Asia Pacific Cocktail Syrups Market, By Type, 2019-2030 (USD Billion)
46. Asia Pacific Cocktail Syrups Market, By Flavor, 2019-2030 (USD Billion)
47. Asia Pacific Cocktail Syrups Market, By Distribution Channel, 2019-2030 (USD Billion)
48. Japan Cocktail Syrups Market, By Type, 2019-2030 (USD Billion)
49. Japan Cocktail Syrups Market, By Flavor, 2019-2030 (USD Billion)
50. Japan Cocktail Syrups Market, By Distribution Channel, 2019-2030 (USD Billion)
51. China Cocktail Syrups Market, By Type, 2019-2030 (USD Billion)
52. China Cocktail Syrups Market, By Flavor, 2019-2030 (USD Billion)
53. China Cocktail Syrups Market, By Distribution Channel, 2019-2030 (USD Billion)
54. India Cocktail Syrups Market, By Type, 2019-2030 (USD Billion)
55. India Cocktail Syrups Market, By Flavor, 2019-2030 (USD Billion)
56. India Cocktail Syrups Market, By Distribution Channel, 2019-2030 (USD Billion)
57. South America Cocktail Syrups Market, By Type, 2019-2030 (USD Billion)
58. South America Cocktail Syrups Market, By Flavor, 2019-2030 (USD Billion)
59. South America Cocktail Syrups Market, By Distribution Channel, 2019-2030 (USD Billion)
60. Brazil Cocktail Syrups Market, By Type, 2019-2030 (USD Billion)
61. Brazil Cocktail Syrups Market, By Flavor, 2019-2030 (USD Billion)
62. Brazil Cocktail Syrups Market, By Distribution Channel, 2019-2030 (USD Billion)
63. Middle East and Africa Cocktail Syrups Market, By Type, 2019-2030 (USD Billion)
64. Middle East and Africa Cocktail Syrups Market, By Flavor, 2019-2030 (USD Billion)
65. Middle East and Africa Cocktail Syrups Market, By Distribution Channel, 2019-2030 (USD Billion)
66. UAE Cocktail Syrups Market, By Type, 2019-2030 (USD Billion)
67. UAE Cocktail Syrups Market, By Flavor, 2019-2030 (USD Billion)
68. UAE Cocktail Syrups Market, By Distribution Channel, 2019-2030 (USD Billion)
69. South Africa Cocktail Syrups Market, By Type, 2019-2030 (USD Billion)
70. South Africa Cocktail Syrups Market, By Flavor, 2019-2030 (USD Billion)
71. South Africa Cocktail Syrups Market, By Distribution Channel, 2019-2030 (USD Billion)
List of Figures
1. Global Cocktail Syrups Market Segmentation
2. Cocktail Syrups Market: Research Methodology
3. Market Size Estimation Methodology: Bottom-Up Approach
4. Market Size Estimation Methodology: Top-Down Approach
5. Data Triangulation
6. Porter’s Five Forces Analysis
7. Value Chain Analysis
8. Global Cocktail Syrups Market Attractiveness Analysis by Type
9. Global Cocktail Syrups Market Attractiveness Analysis by Flavor
10. Global Cocktail Syrups Market Attractiveness Analysis by Distribution Channel
11. Global Cocktail Syrups Market Attractiveness Analysis by Region
12. Global Cocktail Syrups Market: Dynamics
13. Global Cocktail Syrups Market Share by Type (2022 & 2030)
14. Global Cocktail Syrups Market Share by Flavor (2022 & 2030)
15. Global Cocktail Syrups Market Share by Distribution Channel (2022 & 2030)
16. Global Cocktail Syrups Market Share by Regions (2022 & 2030)
17. Global Cocktail Syrups Market Share by Company (2021)
Segments Covered in the Report
Research has its special purpose to undertake marketing efficiently. In this competitive scenario, businesses need information across all industry verticals; the information about customer wants, market demand, competition, industry trends, distribution channels etc. This information needs to be updated regularly because businesses operate in a dynamic environment. Our organization, The Brainy Insights incorporates scientific and systematic research procedures in order to get proper market insights and industry analysis for overall business success. The analysis consists of studying the market from a miniscule level wherein we implement statistical tools which helps us in examining the data with accuracy and precision.
Our research reports feature both; quantitative and qualitative aspects for any market. Qualitative information for any market research process are fundamental because they reveal the customer needs and wants, usage and consumption for any product/service related to a specific industry. This in turn aids the marketers/investors in knowing certain perceptions of the customers. Qualitative research can enlighten about the different product concepts and designs along with unique service offering that in turn, helps define marketing problems and generate opportunities. On the other hand, quantitative research engages with the data collection process through interviews, e-mail interactions, surveys and pilot studies. Quantitative aspects for the market research are useful to validate the hypotheses generated during qualitative research method, explore empirical patterns in the data with the help of statistical tools, and finally make the market estimations.
The Brainy Insights offers comprehensive research and analysis, based on a wide assortment of factual insights gained through interviews with CXOs and global experts and secondary data from reliable sources. Our analysts and industry specialist assume vital roles in building up statistical tools and analysis models, which are used to analyse the data and arrive at accurate insights with exceedingly informative research discoveries. The data provided by our organization have proven precious to a diverse range of companies, facilitating them to address issues such as determining which products/services are the most appealing, whether or not customers use the product in the manner anticipated, the purchasing intentions of the market and many others.
Our research methodology encompasses an idyllic combination of primary and secondary initiatives. Key phases involved in this process are listed below:

The phase involves the gathering and collecting of market data and its related information with the help of different sources & research procedures.

The data procurement stage involves in data gathering and collecting through various data sources.
This stage involves in extensive research. These data sources includes:
Purchased Database: Purchased databases play a crucial role in estimating the market sizes irrespective of the domain. Our purchased database includes:
Primary Research: The Brainy Insights interacts with leading companies and experts of the concerned domain to develop the analyst team’s market understanding and expertise. It improves and substantiates every single data presented in the market reports. Primary research mainly involves in telephonic interviews, E-mail interactions and face-to-face interviews with the raw material providers, manufacturers/producers, distributors, & independent consultants. The interviews that we conduct provides valuable data on market size and industry growth trends prevailing in the market. Our organization also conducts surveys with the various industry experts in order to gain overall insights of the industry/market. For instance, in healthcare industry we conduct surveys with the pharmacists, doctors, surgeons and nurses in order to gain insights and key information of a medical product/device/equipment which the customers are going to usage. Surveys are conducted in the form of questionnaire designed by our own analyst team. Surveys plays an important role in primary research because surveys helps us to identify the key target audiences of the market. Additionally, surveys helps to identify the key target audience engaged with the market. Our survey team conducts the survey by targeting the key audience, thus gaining insights from them. Based on the perspectives of the customers, this information is utilized to formulate market strategies. Moreover, market surveys helps us to understand the current competitive situation of the industry. To be precise, our survey process typically involve with the 360 analysis of the market. This analytical process begins by identifying the prospective customers for a product or service related to the market/industry to obtain data on how a product/service could fit into customers’ lives.

Secondary Research: The secondary data sources includes information published by the on-profit organizations such as World bank, WHO, company fillings, investor presentations, annual reports, national government documents, statistical databases, blogs, articles, white papers and others. From the annual report, we analyse a company’s revenue to understand the key segment and market share of that organization in a particular region. We analyse the company websites and adopt the product mapping technique which is important for deriving the segment revenue. In the product mapping method, we select and categorize the products offered by the companies catering to domain specific market, deduce the product revenue for each of the companies so as to get overall estimation of the market size. We also source data and analyses trends based on information received from supply side and demand side intermediaries in the value chain. The supply side denotes the data gathered from supplier, distributor, wholesaler and the demand side illustrates the data gathered from the end customers for respective market domain.

The supply side for a domain specific market is analysed by:
The demand side for the market is estimated through:
In-house Library: Apart from these third-party sources, we have our in-house library of qualitative and quantitative information. Our in-house database includes market data for various industry and domains. These data are updated on regular basis as per the changing market scenario. Our library includes, historic databases, internal audit reports and archives.
Sometimes there are instances where there is no metadata or raw data available for any domain specific market. For those cases, we use our expertise to forecast and estimate the market size in order to generate comprehensive data sets. Our analyst team adopt a robust research technique in order to produce the estimates:
Data Synthesis: This stage involves the analysis & mapping of all the information obtained from the previous step. It also involves in scrutinizing the data for any discrepancy observed while data gathering related to the market. The data is collected with consideration to the heterogeneity of sources. Robust scientific techniques are in place for synthesizing disparate data sets and provide the essential contextual information that can orient market strategies. The Brainy Insights has extensive experience in data synthesis where the data passes through various stages:


Market Deduction & Formulation: The final stage comprises of assigning data points at appropriate market spaces so as to deduce feasible conclusions. Analyst perspective & subject matter expert based holistic form of market sizing coupled with industry analysis also plays a crucial role in this stage.
This stage involves in finalization of the market size and numbers that we have collected from data integration step. With data interpolation, it is made sure that there is no gap in the market data. Successful trend analysis is done by our analysts using extrapolation techniques, which provide the best possible forecasts for the market.
Data Validation & Market Feedback: Validation is the most important step in the process. Validation & re-validation via an intricately designed process helps us finalize data-points to be used for final calculations.

The Brainy Insights interacts with leading companies and experts of the concerned domain to develop the analyst team’s market understanding and expertise. It improves and substantiates every single data presented in the market reports. The data validation interview and discussion panels are typically composed of the most experienced industry members. The participants include, however, are not limited to:
Moreover, we always validate our data and findings through primary respondents from all the major regions we are working on.


Free Customization
Fortune 500 Clients
Free Yearly Update On Purchase Of Multi/Corporate License
Companies Served Till Date