- +1-315-215-1633
- sales@thebrainyinsights.com

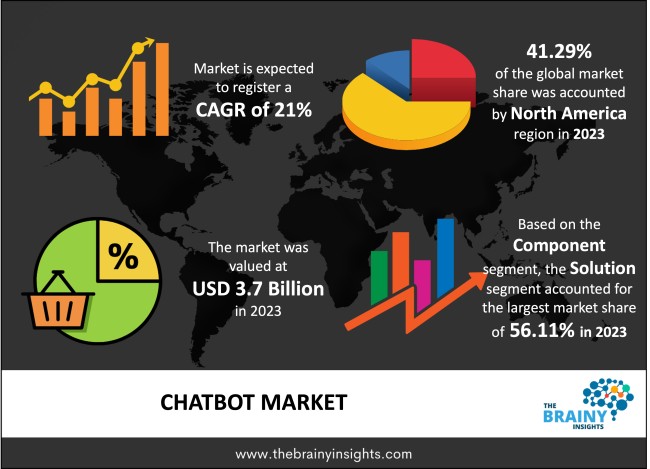
The global chatbot market was valued at USD 3.7 billion in 2023, growing at a CAGR of 21% from 2024 to 2033. The market is expected to reach USD 25.2 billion by 2033. The growing demand for automation & artificial intelligence-based customer service solutions among enterprises, coupled with the increasing requirement for high-quality customer care service across organizations, are propelling the market growth. Chatbots have made it easier for organizations to reduce their operational costs. This allows them to engage employees in other important tasks and reduce their workload. At the same time, Chatbots can easily handle large volumes of customer queries without any human intervention.
Chatbot is a computer program that affects & processes human conversation (either spoken or written), permitting humans to interact with digital instruments as if communicating with a natural person. Chatbots can be as simple as rudimentary programs that answer a simple query with a single-line response or as refined as digital assistants that learn and evolve to provide rising levels of personalization as they gather & process information. Chatbots are often utilized to enhance the IT service management experience, which delves towards self-service & automating methods offered to internal staff. With an intelligent chatbot, common tasks like system status, outage alerts, password updates, and knowledge management can be readily automated & made available 24/7 while widening access to generally utilized voice & text-based conversational interfaces. On the customer side, chatbots are performing a mixture of consumer services, ranging from ordering occasion tickets to checking & booking hotels to comparing services & products. Chatbots are also commonly used to perform routine consumer activities in the food and beverage, banking, and retail sectors. On the business side, chatbots are most commonly utilized in consumer contact centres to manage incoming communications & direct consumers to the appropriate resource. They're also frequently utilized for internal purposes like onboarding new employees and assisting all employees with routine activities, including training, ordering computers and business supplies, vacation scheduling, and other self-service activities that don't need human intervention. Human errors can be reduced with the help of Chatbots. Chatbots provide a very accurate solution to questions, leaving no scope for error. With the help of chatbots, organizations also receive customer feedback, through which they can learn about the problems faced by the customer and improve the chatbot even more. Online sales can be improved even more through Chatbots. With this, suggestions can be given to customers about the products. With this, the customer can easily get the right product, and there is no problem selecting the product due to getting the right information.
Get an overview of this study by requesting a free sample
The rising demand for personalized customer experiences: Companies increasingly utilize chatbots to provide personalized customer experiences. This trend propels the development of chatbot solutions leveraging consumer data to deliver more personalized & relevant responses. Further, with the increasing use of digital communication channels, consumers are expecting 24/7 support chatbots can provide round-the-clock support, making them a popular solution for companies looking to improve their consumer support capabilities.
The lack of awareness: The lack of awareness due to the relatively early presence in the tech-adoption life cycle, high-cost deployment, and the system integration complexities hamper market growth. Moreover, combining chatbots with existing technologies & systems can be complex. This could hamper the adoption of chatbots, specifically among businesses that lack the necessary technical expertise. Additionally, chatbots can provide cost-effective and efficient consumer support, but they lack the personal touch that human agents can provide. This could lead to consumer dissatisfaction and impede the adoption of chatbots.
The growing use of chatbots in the e-commerce sector: The rising demand for better consumer service and the increasing use of smart devices worldwide are helping to boost the market growth. Moreover, the increasing concentration of website and mobile applications, the increasing need for many languages consumer support, and the rising incorporation of a chatbot with single search hyperlinks, social networking sites, natural language processing (NLP), and the improvement of artificial intelligence (AI) are helping to stimulate market growth.
The regions analyzed for the market include North America, Europe, South America, Asia Pacific, the Middle East, and Africa. North America emerged as the largest global chatbot market, with a 41.29% market revenue share in 2023. The increasing penetration rate of chatbots in daily customer life and the shift towards a human-centric strategy from a technology-centric strategy is expected to propel market growth in this region. Moreover, the increasing acceptance of intelligent customer engagement and the integration of chatbots with communication channels are anticipated to drive market growth in this region. The Asia Pacific region will account for the largest market share with revenue growth. This growth is attributed to the increasing digital transformation. Furthermore, the high penetration of internet services and rapid adoption of social media platforms like WhatsApp, Facebook Messenger, etc. Additionally, the rising demand for automation in different industries and the ever-increasing adoption of chatbots in consumer service and support are expected to boost the market growth in this region.
North America Region Chatbot Market Share in 2023 - 41.29%
www.thebrainyinsights.com
Check the geographical analysis of this market by requesting a free sample
The component segment is divided into services and solutions. The solution segment dominated the market, with a share of around 56.11% in 2023. This growth is attributed to the rising consumer usage of over-the-top (OTT) networking and communication website applications.
The type segment is divided into web-based, standalone, AI-powered, messenger-based, and rule-based. The standalone segment dominated the market, with a market share of around 29.18% in 2023. This growth is attributed to the users' demand for visual assistant solutions in standalone messaging services.
The deployment segment is divided into on-premise and cloud. The cloud segment dominated the market, with a market share of around 54.21% in 2023. This growth is attributed to the growing demand for cloud-based services globally.
The application segment is divided into retail, healthcare, media and entertainment, real estate, education, e-commerce, banking, financial services and insurance (BFSI), media and entertainment, and others. The e-commerce segment dominated the market, with a market share of around 24.18% in 2023. This growth is attributed to the rapid change in consumer demand for e-shopping.
The end-user segment is divided into large enterprises and small and medium enterprises. The large enterprises’ segment dominated the market, with a market share of around 57.13% in 2023. This growth is attributed to the rising technological advancements in Artificial Intelligence.
| Attribute | Description |
|---|---|
| Market Size | Revenue (USD Billion) |
| Market size value in 2023 | USD 3.7 Billion |
| Market size value in 2033 | USD 25.2 Billion |
| CAGR (2024 to 2033) | 21% |
| Historical data | 2020-2022 |
| Base Year | 2023 |
| Forecast | 2024-2033 |
| Region | The regions analyzed for the market are Asia Pacific, Europe, South America, North America, and Middle East & Africa. Furthermore, the regions are further analyzed at the country level. |
| Segments | Component, Type, Deployment, Application, End User. |
As per The Brainy Insights, the size of the chatbot market was valued at USD 3.7 Billion in 2023 to USD 25.2 Billion by 2033.
The global chatbot market is growing at a CAGR of 21% during the forecast period 2024-2033.
North America region emerged as the largest market for chatbot.
1. Introduction
1.1. Objectives of the Study
1.2. Market Definition
1.3. Research Scope
1.4. Currency
1.5. Key Target Audience
2. Research Methodology and Assumptions
3. Executive Summary
4. Premium Insights
4.1. Porter’s Five Forces Analysis
4.2. Value Chain Analysis
4.3. Top Investment Pockets
4.3.1. Market Attractiveness Analysis By Component
4.3.2. Market Attractiveness Analysis By Type
4.3.3. Market Attractiveness Analysis By Deployment
4.3.4. Market Attractiveness Analysis By Application
4.3.5. Market Attractiveness Analysis By End User
4.3.6. Market Attractiveness Analysis By Region
4.4. Industry Trends
5. Market Dynamics
5.1. Market Evaluation
5.2. Drivers
5.2.1. The increasing demand from SMEs
5.2.2. The rising demand for personalized customer experiences
5.3. Restraints
5.3.1. The lack of awareness of effects of chatbot technology
5.3.2. The concerns regarding security and privacy
5.4. Opportunities
5.4.1. Technological advancements in Chatbots
5.4.2. The growing use of chatbots in the e-commerce sector
5.5. Challenges
5.5.1. User Experience Issues
6. Global Chatbot Market Analysis and Forecast, By Component
6.1. Segment Overview
6.2. Services
6.3. Solution
7. Global Chatbot Market Analysis and Forecast, By Type
7.1. Segment Overview
7.2. Web-Based
7.3. Standalone
7.4. AI-Powered
7.5. Messenger-Based
7.6. Rule-Based
8. Global Chatbot Market Analysis and Forecast, By Deployment
8.1. Segment Overview
8.2. On-premise
8.3. Cloud
9. Global Chatbot Market Analysis and Forecast, By Application
9.1. Segment Overview
9.2. Retail
9.3. Healthcare
9.4. Media and Entertainment
9.5. Real Estate
9.6. Education
9.7. E-commerce
9.8. Banking Financial Services and Insurance (BFSI)
9.9. Others
10. Global Chatbot Market Analysis and Forecast, By End User
10.1. Segment Overview
10.2. Large Enterprises
10.3. Small and Medium Enterprises
11. Global Chatbot Market Analysis and Forecast, By Regional Analysis
11.1. Segment Overview
11.2. North America
11.2.1. U.S.
11.2.2. Canada
11.2.3. Mexico
11.3. Europe
11.3.1. Germany
11.3.2. France
11.3.3. U.K.
11.3.4. Italy
11.3.5. Spain
11.4. Asia-Pacific
11.4.1. Japan
11.4.2. China
11.4.3. India
11.5. South America
11.5.1. Brazil
11.6. Middle East and Africa
11.6.1. UAE
11.6.2. South Africa
12. Global Chatbot Market-Competitive Landscape
12.1. Overview
12.2. Market Share of Key Players in Global Chatbot Market
12.2.1. Global Company Market Share
12.2.2. North America Company Market Share
12.2.3. Europe Company Market Share
12.2.4. APAC Company Market Share
12.3. Competitive Situations and Trends
12.3.1. Product Launches and Developments
12.3.2. Partnerships, Collaborations, and Agreements
12.3.3. Mergers & Acquisitions
12.3.4. Expansions
13. Company Profiles
13.1. Artificial Solutions
13.1.1. Business Overview
13.1.2. Company Snapshot
13.1.3. Company Market Share Analysis
13.1.4. Company Product Portfolio
13.1.5. Recent Developments
13.1.6. SWOT Analysis
13.2. Aivo LLC
13.2.1. Business Overview
13.2.2. Company Snapshot
13.2.3. Company Market Share Analysis
13.2.4. Company Product Portfolio
13.2.5. Recent Developments
13.2.6. SWOT Analysis
13.3. Google
13.3.1. Business Overview
13.3.2. Company Snapshot
13.3.3. Company Market Share Analysis
13.3.4. Company Product Portfolio
13.3.5. Recent Developments
13.3.6. SWOT Analysis
13.4. Inbenta Holdings Inc.
13.4.1. Business Overview
13.4.2. Company Snapshot
13.4.3. Company Market Share Analysis
13.4.4. Company Product Portfolio
13.4.5. Recent Developments
13.4.6. SWOT Analysis
13.5. Creative Virtual Ltd.
13.5.1. Business Overview
13.5.2. Company Snapshot
13.5.3. Company Market Share Analysis
13.5.4. Company Product Portfolio
13.5.5. Recent Developments
13.5.6. SWOT Analysis
13.6. eGain Corporation
13.6.1. Business Overview
13.6.2. Company Snapshot
13.6.3. Company Market Share Analysis
13.6.4. Company Product Portfolio
13.6.5. Recent Developments
13.6.6. SWOT Analysis
13.7. IBM
13.7.1. Business Overview
13.7.2. Company Snapshot
13.7.3. Company Market Share Analysis
13.7.4. Company Product Portfolio
13.7.5. Recent Developments
13.7.6. SWOT Analysis
13.8. smartbots
13.8.1. Business Overview
13.8.2. Company Snapshot
13.8.3. Company Market Share Analysis
13.8.4. Company Product Portfolio
13.8.5. Recent Developments
13.8.6. SWOT Analysis
13.9. Nuance Communications, Inc.
13.9.1. Business Overview
13.9.2. Company Snapshot
13.9.3. Company Market Share Analysis
13.9.4. Company Product Portfolio
13.9.5. Recent Developments
13.9.6. SWOT Analysis
13.10. Contus
13.10.1. Business Overview
13.10.2. Company Snapshot
13.10.3. Company Market Share Analysis
13.10.4. Company Product Portfolio
13.10.5. Recent Developments
13.10.6. SWOT Analysis
13.11. Conversica,Inc.
13.11.1. Business Overview
13.11.2. Company Snapshot
13.11.3. Company Market Share Analysis
13.11.4. Company Product Portfolio
13.11.5. Recent Developments
13.11.6. SWOT Analysis
13.12. Amazon Web Services, Inc.
13.12.1. Business Overview
13.12.2. Company Snapshot
13.12.3. Company Market Share Analysis
13.12.4. Company Product Portfolio
13.12.5. Recent Developments
13.12.6. SWOT Analysis
13.13. Kevit
13.13.1. Business Overview
13.13.2. Company Snapshot
13.13.3. Company Market Share Analysis
13.13.4. Company Product Portfolio
13.13.5. Recent Developments
13.13.6. SWOT Analysis
13.14. CogniCor Technologies
13.14.1. Business Overview
13.14.2. Company Snapshot
13.14.3. Company Market Share Analysis
13.14.4. Company Product Portfolio
13.14.5. Recent Developments
13.14.6. SWOT Analysis
13.15. Cyfuture India Pvt. Ltd.
13.15.1. Business Overview
13.15.2. Company Snapshot
13.15.3. Company Market Share Analysis
13.15.4. Company Product Portfolio
13.15.5. Recent Developments
13.15.6. SWOT Analysis
List of Table
1. Global Chatbot Market, By Component, 2020-2033 (USD Billion)
2. Global Services, Chatbot Market, By Region, 2020-2033 (USD Billion)
3. Global Solution, Chatbot Market, By Region, 2020-2033 (USD Billion)
4. Global Chatbot Market, By Type, 2020-2033 (USD Billion)
5. Global Web-based, Chatbot Market, By Region, 2020-2033 (USD Billion)
6. Global Standalone, Chatbot Market, By Region, 2020-2033 (USD Billion)
7. Global AI-powered, Chatbot Market, By Region, 2020-2033 (USD Billion)
8. Global Messenger-based, Chatbot Market, By Region, 2020-2033 (USD Billion)
9. Global Rule-Based, Chatbot Market, By Region, 2020-2033 (USD Billion)
10. Global Chatbot Market, By Deployment, 2020-2033 (USD Billion)
11. Global On-premise, Chatbot Market, By Region, 2020-2033 (USD Billion)
12. Global Cloud, Chatbot Market, By Region, 2020-2033 (USD Billion)
13. Global Chatbot Market, By Application, 2020-2033 (USD Billion)
14. Global Retail, Chatbot Market, By Region, 2020-2033 (USD Billion)
15. Global Healthcare, Chatbot Market, By Region, 2020-2033 (USD Billion)
16. Global Media and Entertainment, Chatbot Market, By Region, 2020-2033 (USD Billion)
17. Global Real Estate, Chatbot Market, By Region, 2020-2033 (USD Billion)
18. Global Education, Chatbot Market, By Region, 2020-2033 (USD Billion)
19. Global E-commerce, Chatbot Market, By Region, 2020-2033 (USD Billion)
20. Global Banking Financial Services and Insurance (BFSI), Chatbot Market, By Region, 2020-2033 (USD Billion)
21. Global Others Chatbot Market, By Region, 2020-2033 (USD Billion)
22. Global Chatbot Market, By End User, 2020-2033 (USD Billion)
23. Global Large Enterprises, Chatbot Market, By Region, 2020-2033 (USD Billion)
24. Global Small and Medium Enterprises, Chatbot Market, By Region, 2020-2033 (USD Billion)
25. North America Chatbot Market, By Component, 2020-2033 (USD Billion)
26. North America Chatbot Market, By Type, 2020-2033 (USD Billion)
27. North America Chatbot Market, By Deployment, 2020-2033 (USD Billion)
28. North America Chatbot Market, By Application, 2020-2033 (USD Billion)
29. North America Chatbot Market, By End User, 2020-2033 (USD Billion)
30. U.S. Chatbot Market, By Component, 2020-2033 (USD Billion)
31. U.S. Chatbot Market, By Type, 2020-2033 (USD Billion)
32. U.S. Chatbot Market, By Deployment, 2020-2033 (USD Billion)
33. U.S. Chatbot Market, By Application, 2020-2033 (USD Billion)
34. U.S. Chatbot Market, By End User, 2020-2033 (USD Billion)
35. Canada Chatbot Market, By Component, 2020-2033 (USD Billion)
36. Canada Chatbot Market, By Type, 2020-2033 (USD Billion)
37. Canada Chatbot Market, By Deployment, 2020-2033 (USD Billion)
38. Canada Chatbot Market, By Application, 2020-2033 (USD Billion)
39. Canada Chatbot Market, By End User, 2020-2033 (USD Billion)
40. Mexico Chatbot Market, By Component, 2020-2033 (USD Billion)
41. Mexico Chatbot Market, By Type, 2020-2033 (USD Billion)
42. Mexico Chatbot Market, By Deployment, 2020-2033 (USD Billion)
43. Mexico Chatbot Market, By Application, 2020-2033 (USD Billion)
44. Mexico Chatbot Market, By End User, 2020-2033 (USD Billion)
45. Europe Chatbot Market, By Component, 2020-2033 (USD Billion)
46. Europe Chatbot Market, By Type, 2020-2033 (USD Billion)
47. Europe Chatbot Market, By Deployment, 2020-2033 (USD Billion)
48. Europe Chatbot Market, By Application, 2020-2033 (USD Billion)
49. Europe Chatbot Market, By End User, 2020-2033 (USD Billion)
50. Germany Chatbot Market, By Component, 2020-2033 (USD Billion)
51. Germany Chatbot Market, By Type, 2020-2033 (USD Billion)
52. Germany Chatbot Market, By Deployment, 2020-2033 (USD Billion)
53. Germany Chatbot Market, By Application, 2020-2033 (USD Billion)
54. Germany Chatbot Market, By End User, 2020-2033 (USD Billion)
55. France Chatbot Market, By Component, 2020-2033 (USD Billion)
56. France Chatbot Market, By Type, 2020-2033 (USD Billion)
57. France Chatbot Market, By Deployment, 2020-2033 (USD Billion)
58. France Chatbot Market, By Application, 2020-2033 (USD Billion)
59. France Chatbot Market, By End User, 2020-2033 (USD Billion)
60. U.K. Chatbot Market, By Component, 2020-2033 (USD Billion)
61. U.K. Chatbot Market, By Type, 2020-2033 (USD Billion)
62. U.K. Chatbot Market, By Deployment, 2020-2033 (USD Billion)
63. U.K. Chatbot Market, By Application, 2020-2033 (USD Billion)
64. U.K. Chatbot Market, By End User, 2020-2033 (USD Billion)
65. Italy Chatbot Market, By Component, 2020-2033 (USD Billion)
66. Italy Chatbot Market, By Type, 2020-2033 (USD Billion)
67. Italy Chatbot Market, By Deployment, 2020-2033 (USD Billion)
68. Italy Chatbot Market, By Application, 2020-2033 (USD Billion)
69. Italy Chatbot Market, By End User, 2020-2033 (USD Billion)
70. Spain Chatbot Market, By Component, 2020-2033 (USD Billion)
71. Spain Chatbot Market, By Type, 2020-2033 (USD Billion)
72. Spain Chatbot Market, By Deployment, 2020-2033 (USD Billion)
73. Spain Chatbot Market, By Application, 2020-2033 (USD Billion)
74. Spain Chatbot Market, By End User, 2020-2033 (USD Billion)
75. Asia Pacific Chatbot Market, By Component, 2020-2033 (USD Billion)
76. Asia Pacific Chatbot Market, By Type, 2020-2033 (USD Billion)
77. Asia Pacific Chatbot Market, By Deployment, 2020-2033 (USD Billion)
78. Asia Pacific Chatbot Market, By Application, 2020-2033 (USD Billion)
79. Asia Pacific Chatbot Market, By End User, 2020-2033 (USD Billion)
80. Japan Chatbot Market, By Component, 2020-2033 (USD Billion)
81. Japan Chatbot Market, By Type, 2020-2033 (USD Billion)
82. Japan Chatbot Market, By Deployment, 2020-2033 (USD Billion)
83. Japan Chatbot Market, By Application, 2020-2033 (USD Billion)
84. Japan Chatbot Market, By End User, 2020-2033 (USD Billion)
85. China Chatbot Market, By Component, 2020-2033 (USD Billion)
86. China Chatbot Market, By Type, 2020-2033 (USD Billion)
87. China Chatbot Market, By Deployment, 2020-2033 (USD Billion)
88. China Chatbot Market, By Application, 2020-2033 (USD Billion)
89. China Chatbot Market, By End User, 2020-2033 (USD Billion)
90. India Chatbot Market, By Component, 2020-2033 (USD Billion)
91. India Chatbot Market, By Type, 2020-2033 (USD Billion)
92. India Chatbot Market, By Deployment, 2020-2033 (USD Billion)
93. India Chatbot Market, By Application, 2020-2033 (USD Billion)
94. India Chatbot Market, By End User, 2020-2033 (USD Billion)
95. South America Chatbot Market, By Component, 2020-2033 (USD Billion)
96. South America Chatbot Market, By Type, 2020-2033 (USD Billion)
97. South America Chatbot Market, By Deployment, 2020-2033 (USD Billion)
98. South America Chatbot Market, By Application, 2020-2033 (USD Billion)
99. South America Chatbot Market, By End User, 2020-2033 (USD Billion)
100. Brazil Chatbot Market, By Component, 2020-2033 (USD Billion)
101. Brazil Chatbot Market, By Type, 2020-2033 (USD Billion)
102. Brazil Chatbot Market, By Deployment, 2020-2033 (USD Billion)
103. Brazil Chatbot Market, By Application, 2020-2033 (USD Billion)
104. Brazil Chatbot Market, By End User, 2020-2033 (USD Billion)
105. Middle East and Africa Chatbot Market, By Component, 2020-2033 (USD Billion)
106. Middle East and Africa Chatbot Market, By Type, 2020-2033 (USD Billion)
107. Middle East and Africa Chatbot Market, By Deployment, 2020-2033 (USD Billion)
108. Middle East and Africa Chatbot Market, By Application, 2020-2033 (USD Billion)
109. Middle East and Africa Chatbot Market, By End User, 2020-2033 (USD Billion)
110. UAE Chatbot Market, By Component, 2020-2033 (USD Billion)
111. UAE Chatbot Market, By Type, 2020-2033 (USD Billion)
112. UAE Chatbot Market, By Deployment, 2020-2033 (USD Billion)
113. UAE Chatbot Market, By Application, 2020-2033 (USD Billion)
114. UAE Chatbot Market, By End User, 2020-2033 (USD Billion)
115. South Africa Chatbot Market, By Component, 2020-2033 (USD Billion)
116. South Africa Chatbot Market, By Type, 2020-2033 (USD Billion)
117. South Africa Chatbot Market, By Deployment, 2020-2033 (USD Billion)
118. South Africa Chatbot Market, By Application, 2020-2033 (USD Billion)
119. South Africa Chatbot Market, By End User, 2020-2033 (USD Billion)
List of Figures
1. Global Chatbot Market Segmentation
2. Global Chatbot Market: Research Methodology
3. Market Size Estimation Methodology: Bottom-Up Approach
4. Market Size Estimation Methodology: Top-Down Approach
5. Data Triangulation
6. Porter’s Five Forces Analysis
7. Value Chain Analysis
8. Global Chatbot Market Attractiveness Analysis By Component
9. Global Chatbot Market Attractiveness Analysis By Type
10. Global Chatbot Market Attractiveness Analysis By Deployment
11. Global Chatbot Market Attractiveness Analysis By Application
12. Global Chatbot Market Attractiveness Analysis By End User
13. Global Chatbot Market Attractiveness Analysis By Region
14. Global Chatbot Market: Dynamics
15. Global Chatbot Market Share By Component (2023 & 2033)
16. Global Chatbot Market Share By Type (2023 & 2033)
17. Global Chatbot Market Share By Deployment (2023 & 2033)
18. Global Chatbot Market Share By Application (2023 & 2033)
19. Global Chatbot Market Share By End User (2023 & 2033)
20. Global Chatbot Market Share By Regions (2023 & 2033)
21. Global Chatbot Market Share By Company (2023)
This study forecasts revenue at global, regional, and country levels from 2020 to 2033. The Brainy Insights has segmented the global chatbot based on below mentioned segments:
Global Chatbot Market by Component:
Global Chatbot Market by Type:
Global Chatbot Market by Deployment:
Global Chatbot Market by Application:
Global Chatbot Market by End User:
Global Chatbot by Region:
Research has its special purpose to undertake marketing efficiently. In this competitive scenario, businesses need information across all industry verticals; the information about customer wants, market demand, competition, industry trends, distribution channels etc. This information needs to be updated regularly because businesses operate in a dynamic environment. Our organization, The Brainy Insights incorporates scientific and systematic research procedures in order to get proper market insights and industry analysis for overall business success. The analysis consists of studying the market from a miniscule level wherein we implement statistical tools which helps us in examining the data with accuracy and precision.
Our research reports feature both; quantitative and qualitative aspects for any market. Qualitative information for any market research process are fundamental because they reveal the customer needs and wants, usage and consumption for any product/service related to a specific industry. This in turn aids the marketers/investors in knowing certain perceptions of the customers. Qualitative research can enlighten about the different product concepts and designs along with unique service offering that in turn, helps define marketing problems and generate opportunities. On the other hand, quantitative research engages with the data collection process through interviews, e-mail interactions, surveys and pilot studies. Quantitative aspects for the market research are useful to validate the hypotheses generated during qualitative research method, explore empirical patterns in the data with the help of statistical tools, and finally make the market estimations.
The Brainy Insights offers comprehensive research and analysis, based on a wide assortment of factual insights gained through interviews with CXOs and global experts and secondary data from reliable sources. Our analysts and industry specialist assume vital roles in building up statistical tools and analysis models, which are used to analyse the data and arrive at accurate insights with exceedingly informative research discoveries. The data provided by our organization have proven precious to a diverse range of companies, facilitating them to address issues such as determining which products/services are the most appealing, whether or not customers use the product in the manner anticipated, the purchasing intentions of the market and many others.
Our research methodology encompasses an idyllic combination of primary and secondary initiatives. Key phases involved in this process are listed below:

The phase involves the gathering and collecting of market data and its related information with the help of different sources & research procedures.

The data procurement stage involves in data gathering and collecting through various data sources.
This stage involves in extensive research. These data sources includes:
Purchased Database: Purchased databases play a crucial role in estimating the market sizes irrespective of the domain. Our purchased database includes:
Primary Research: The Brainy Insights interacts with leading companies and experts of the concerned domain to develop the analyst team’s market understanding and expertise. It improves and substantiates every single data presented in the market reports. Primary research mainly involves in telephonic interviews, E-mail interactions and face-to-face interviews with the raw material providers, manufacturers/producers, distributors, & independent consultants. The interviews that we conduct provides valuable data on market size and industry growth trends prevailing in the market. Our organization also conducts surveys with the various industry experts in order to gain overall insights of the industry/market. For instance, in healthcare industry we conduct surveys with the pharmacists, doctors, surgeons and nurses in order to gain insights and key information of a medical product/device/equipment which the customers are going to usage. Surveys are conducted in the form of questionnaire designed by our own analyst team. Surveys plays an important role in primary research because surveys helps us to identify the key target audiences of the market. Additionally, surveys helps to identify the key target audience engaged with the market. Our survey team conducts the survey by targeting the key audience, thus gaining insights from them. Based on the perspectives of the customers, this information is utilized to formulate market strategies. Moreover, market surveys helps us to understand the current competitive situation of the industry. To be precise, our survey process typically involve with the 360 analysis of the market. This analytical process begins by identifying the prospective customers for a product or service related to the market/industry to obtain data on how a product/service could fit into customers’ lives.

Secondary Research: The secondary data sources includes information published by the on-profit organizations such as World bank, WHO, company fillings, investor presentations, annual reports, national government documents, statistical databases, blogs, articles, white papers and others. From the annual report, we analyse a company’s revenue to understand the key segment and market share of that organization in a particular region. We analyse the company websites and adopt the product mapping technique which is important for deriving the segment revenue. In the product mapping method, we select and categorize the products offered by the companies catering to domain specific market, deduce the product revenue for each of the companies so as to get overall estimation of the market size. We also source data and analyses trends based on information received from supply side and demand side intermediaries in the value chain. The supply side denotes the data gathered from supplier, distributor, wholesaler and the demand side illustrates the data gathered from the end customers for respective market domain.

The supply side for a domain specific market is analysed by:
The demand side for the market is estimated through:
In-house Library: Apart from these third-party sources, we have our in-house library of qualitative and quantitative information. Our in-house database includes market data for various industry and domains. These data are updated on regular basis as per the changing market scenario. Our library includes, historic databases, internal audit reports and archives.
Sometimes there are instances where there is no metadata or raw data available for any domain specific market. For those cases, we use our expertise to forecast and estimate the market size in order to generate comprehensive data sets. Our analyst team adopt a robust research technique in order to produce the estimates:
Data Synthesis: This stage involves the analysis & mapping of all the information obtained from the previous step. It also involves in scrutinizing the data for any discrepancy observed while data gathering related to the market. The data is collected with consideration to the heterogeneity of sources. Robust scientific techniques are in place for synthesizing disparate data sets and provide the essential contextual information that can orient market strategies. The Brainy Insights has extensive experience in data synthesis where the data passes through various stages:


Market Deduction & Formulation: The final stage comprises of assigning data points at appropriate market spaces so as to deduce feasible conclusions. Analyst perspective & subject matter expert based holistic form of market sizing coupled with industry analysis also plays a crucial role in this stage.
This stage involves in finalization of the market size and numbers that we have collected from data integration step. With data interpolation, it is made sure that there is no gap in the market data. Successful trend analysis is done by our analysts using extrapolation techniques, which provide the best possible forecasts for the market.
Data Validation & Market Feedback: Validation is the most important step in the process. Validation & re-validation via an intricately designed process helps us finalize data-points to be used for final calculations.

The Brainy Insights interacts with leading companies and experts of the concerned domain to develop the analyst team’s market understanding and expertise. It improves and substantiates every single data presented in the market reports. The data validation interview and discussion panels are typically composed of the most experienced industry members. The participants include, however, are not limited to:
Moreover, we always validate our data and findings through primary respondents from all the major regions we are working on.


Free Customization
Fortune 500 Clients
Free Yearly Update On Purchase Of Multi/Corporate License
Companies Served Till Date