- +1-315-215-1633
- sales@thebrainyinsights.com

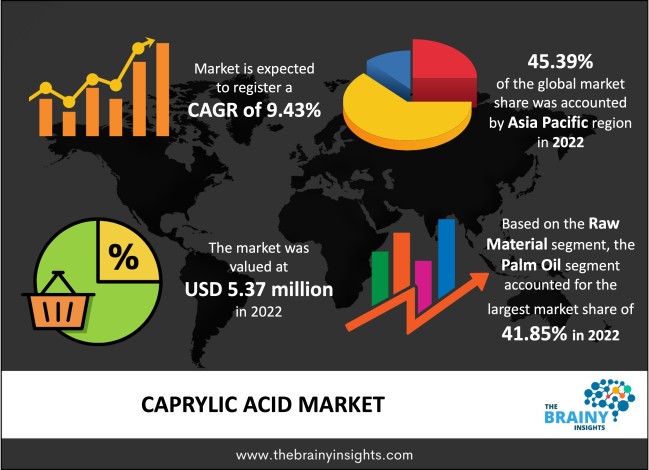
The global caprylic acid market was valued at USD 5.37 million in 2022 and is anticipated to grow at a CAGR of 9.43% from 2023 to 2032. The market is expected to reach USD 13.22 million by 2032. The market is experiencing substantial growth mainly due to the growing need for personal care products. This growth is further fueled by rising environmental awareness and heightened government backing for incorporating naturally sourced ingredients in industrial applications. Moreover, research and development efforts to utilize cost-effective and promising raw materials for caprylic acid production are anticipated to drive market evolution over the forecast years.
Caprylic acid (C8 Acid) is a saturated fatty acid described by its relatively short carbon chain comprising eight carbon atoms. This combination is naturally occurring and can be discovered in several sources, such as coconut oil, palm oil, and certain animal fats. One of the most notable features of caprylic acid is its antimicrobial activity. It can impede the growth of specific microorganisms, including bacteria, fungi, and yeast. This property has led to its utilization in various applications where microbial control is crucial. In the food industry, caprylic acid's antimicrobial properties contribute to its role in preserving food products. It can be used as a natural preservative to extend certain items' shelf life and inhibit spoilage organisms' growth. This factor can help reduce the need for synthetic preservatives and enhance the overall safety and quality of foods. Caprylic acid's antimicrobial capabilities have led to its inclusion in formulations for oral and topical applications in the pharmaceutical sector. It's often used in antifungal creams, ointments, fungal skin infections and candidiasis treatments. Its relatively mild side effect profile and natural origin make it an attractive option for such applications. Cosmetic and personal care industries also benefit from caprylic acid's properties. Due to its ability to control the growth of certain microorganisms, it finds use in products like skin cleansers, lotions, and shampoos, where maintaining microbial balance on the skin or scalp is essential. This factor can contribute to healthier skin and hair by minimizing the chances of infections or imbalances. Moreover, caprylic acid's potential in medical and therapeutic applications is being explored. Research suggests that it might have neuroprotective properties and could be investigated for its role in managing neurological disorders. However, further studies are needed to fully understand and validate these potential benefits.
Get an overview of this study by requesting a free sample
Increasing Health Consciousness - As consumers become more health-conscious and aware of the potential benefits of natural and organic products, the demand for caprylic acid derived from sources like coconut and palm oil has risen. Caprylic acid is known for its potential antimicrobial and antifungal properties, which align with the growing interest in natural remedies and functional ingredients.
Rising Demand in Personal Care Products - Due to its moisturizing and antimicrobial properties, caprylic acid is utilized in formulating personal care products such as creams, lotions, and shampoos. The expanding beauty and personal care industry, caused by varying consumer preferences and rising disposable incomes, contributes significantly to the demand for caprylic acid.
Functional Food and Supplements - The trend towards incorporating functional ingredients into foods and dietary supplements has increased caprylic acid use. Its potential role in supporting digestive health and its suitability for ketogenic diets have spurred its inclusion in various functional food and supplement formulations.
Price Volatility of Raw Materials - Fluctuations in the prices of coconut and palm oil can significantly affect the cost of caprylic acid production. This price volatility can make it challenging for manufacturers to maintain consistent pricing and profit margins, potentially deterring investment and expansion.
Limited Awareness - Despite the growing interest in natural and functional ingredients, caprylic acid's benefits and applications have yet to be widely understood by consumers and industries alike. The lack of awareness can hinder its adoption in various sectors, particularly in regions with limited education and information dissemination.
Expanding Natural and Organic Product Demand - The increasing preference for natural and organic products presents a significant opportunity for caprylic acid. As consumers seek safer and more sustainable alternatives, caprylic acid's natural origin and potential health benefits can position it favourably in various industries, including food, cosmetics, and personal care.
Functional Food Innovation - The functional food sector is witnessing a surge in demand as consumers look for products that offer health benefits beyond essential nutrition. Caprylic acid's potential as a functional ingredient, especially in ketogenic diets and gut health support, provides a unique opportunity for its inclusion in innovative food formulations.
Regulatory Constraints - The use of caprylic acid in diverse industries, such as food, cosmetics, and pharmaceuticals, is subject to regulatory approval and compliance. Stringent regulations regarding safety, labelling, and permissible concentrations can pose challenges for manufacturers and suppliers, potentially limiting market growth.
Production Scalability and Efficiency - Developing efficient and scalable production methods for caprylic acid can be challenging. Achieving consistent quality and yield while optimizing production costs requires continuous research and investment in process innovation.
The regions analyzed for the market include North America, Europe, South America, Asia Pacific, the Middle East, and Africa. Asia Pacific region emerged as the most prominent global caprylic acid market, with a 45.39% market revenue share in 2022.
The Asia Pacific region is a major producer of coconut and palm oil, primary sources of caprylic acid. Countries like Indonesia, the Philippines, and Malaysia are among the world's largest producers of these oils. These abundant raw materials provide a strategic advantage for caprylic acid production in the region. With easy access to raw materials, production costs for caprylic acid are comparatively lower in the Asia Pacific. The lower production costs and established manufacturing infrastructure enable manufacturers to offer competitive pricing, attracting domestic and international demand. The Asia Pacific region has also witnessed rapid industrialization and growth in manufacturing sectors. This growth has created opportunities for caprylic acid utilization in various industries, such as cosmetics, personal care, pharmaceuticals, and food processing. Moreover, the increasing consumer preference for natural and organic products aligns with caprylic acid's natural origin and potential health benefits. As consumers in the Asia Pacific become more health-conscious and environmentally aware, demand for products containing caprylic acid has risen. The North American region is projected to experience significant growth over the forecast period. North America has witnessed a growing trend towards health-conscious lifestyles and natural product preferences. Consumers are seeking alternatives to synthetic chemicals and additives, which align with caprylic acid's natural origin and potential health benefits.
Asia Pacific Region Caprylic Acid Market Share in 2022 - 45.39%
www.thebrainyinsights.com
Check the geographical analysis of this market by requesting a free sample
The raw material segment includes coconut oil, mammal milk, palm oil and others. The palm oil segment accounted for the largest market share of around 41.85% in 2022. Palm oil is one of the top widely produced vegetable oils globally, with major producing countries including Indonesia and Malaysia. The abundant palm oil supply ensures a consistent and reliable raw material source for caprylic acid production. Palm oil contains a relatively high caprylic acid concentration than other vegetable oils. This high content makes palm oil an attractive choice for caprylic acid extraction, as it offers a relatively efficient source of the desired fatty acid. In addition, palm oil is known for its cost-effectiveness due to its high yield per hectare of cultivation. The economies of scale in palm oil production contribute to its affordability, making it a cost-effective raw material for caprylic acid extraction.
The application segment is classified into food & beverages, personal care, pharmaceutical and others. The pharmaceutical segment dominated the market, with a share of around 45.71% in 2022. The function of gut health in overall well-being is increasingly recognized. Caprylic acid's potential to support gut health and control microbial populations makes it relevant in pharmaceutical products targeting gastrointestinal health. Caprylic acid is known for its potential antimicrobial properties. In the pharmaceutical sector, substances with antimicrobial activity are highly valued for their applications in treating bacterial, fungal, and other infections. Caprylic acid's antimicrobial potential could make it an attractive candidate for developing new pharmaceutical products. Furthermore, there is a growing interest in natural and alternative therapies within the pharmaceutical industry. Caprylic acid, a naturally derived compound, could align with this trend. Pharmaceutical companies might explore caprylic acid's potential as a component in topical creams, ointments, or oral formulations for various health conditions.
The distribution channel segment includes offline and online. The offline segment dominated the market, with a share of around 71.34% in 2022. Physical retail spaces provide the opportunity to showcase and display caprylic acid products directly to consumers. This visibility can attract attention and educate consumers about the benefits of caprylic acid. In addition, offline channels allow for face-to-face interactions between customers and sellers. This personal touch can create trust and provide customers with detailed information about caprylic acid products. Besides, in-store experiences can be enhanced through demonstrations, product sampling, and expert guidance. This tactile experience can help consumers better understand and appreciate the value of caprylic acid products.
| Attribute | Description |
|---|---|
| Market Size | Revenue (USD Million) |
| Market size value in 2022 | USD 5.37 Million |
| Market size value in 2032 | USD 13.22 Million |
| CAGR (2023 to 2032) | 9.43% |
| Historical data | 2019-2021 |
| Base Year | 2022 |
| Forecast | 2023-2032 |
| Region | The regions analyzed for the market are Asia Pacific, Europe, South America, North America, and Middle East & Africa. Furthermore, the regions are further analyzed at the country level. |
| Segments | Raw Material, Application, and Distribution Channel |
As per The Brainy Insights, the size of the caprylic acid market was valued at USD 5.37 million in 2022 to USD 13.22 million by 2032.
The global caprylic acid market is growing at a CAGR of 9.43% during the forecast period 2023-2032.
The Asia Pacific region became the largest market for caprylic acid.
Increasing health consciousness and rising demand in personal care products are influencing the market's growth.
1. Introduction
1.1. Objectives of the Study
1.2. Market Definition
1.3. Research Scope
1.4. Currency
1.5. Key Target Audience
2. Research Methodology and Assumptions
3. Executive Summary
4. Premium Insights
4.1. Porter’s Five Forces Analysis
4.2. Value Chain Analysis
4.3. Top Investment Pockets
4.3.1. Market Attractiveness Analysis by Raw Material
4.3.2. Market Attractiveness Analysis by Application
4.3.3. Market Attractiveness Analysis by Distribution Channel
4.3.4. Market Attractiveness Analysis by Region
4.4. Industry Trends
5. Market Dynamics
5.1. Market Evaluation
5.2. Drivers
5.2.1. Increasing Health Consciousness
5.2.2. Rising Demand in Personal Care Products
5.2.3. Functional Food and Supplements
5.3. Restraints
5.3.1. Price Volatility of Raw Materials
5.3.2. Limited Awareness
5.4. Opportunities
5.4.1. Expanding Natural and Organic Product Demand
5.4.2. Functional Food Innovation
5.5. Challenges
5.5.1. Regulatory Constraints
5.5.2. Production Scalability and Efficiency
6. Global Caprylic Acid Market Analysis and Forecast, By Raw Material
6.1. Segment Overview
6.2. Coconut Oil
6.3. Mammal Milk
6.4. Palm Oil
6.5. Others
7. Global Caprylic Acid Market Analysis and Forecast, By Application
7.1. Segment Overview
7.2. Food & Beverages
7.3. Personal Care
7.4. Pharmaceutical
7.5. Others
8. Global Caprylic Acid Market Analysis and Forecast, By Distribution Channel
8.1. Segment Overview
8.2. Offline
8.3. Online
9. Global Caprylic Acid Market Analysis and Forecast, By Regional Analysis
9.1. Segment Overview
9.2. North America
9.2.1. U.S.
9.2.2. Canada
9.2.3. Mexico
9.3. Europe
9.3.1. Germany
9.3.2. France
9.3.3. U.K.
9.3.4. Italy
9.3.5. Spain
9.4. Asia-Pacific
9.4.1. Japan
9.4.2. China
9.4.3. India
9.5. South America
9.5.1. Brazil
9.6. Middle East and Africa
9.6.1. UAE
9.6.2. South Africa
10. Global Caprylic Acid Market-Competitive Landscape
10.1. Overview
10.2. Market Share of Key Players in the Caprylic Acid Market
10.2.1. Global Company Market Share
10.2.2. North America Company Market Share
10.2.3. Europe Company Market Share
10.2.4. APAC Company Market Share
10.3. Competitive Situations and Trends
10.3.1. Product Launches and Developments
10.3.2. Partnerships, Collaborations, and Agreements
10.3.3. Mergers & Acquisitions
10.3.4. Expansions
11. Company Profiles
11.1. Wilmar International Ltd.
11.1.1. Business Overview
11.1.2. Company Snapshot
11.1.3. Company Market Share Analysis
11.1.4. Company Product Portfolio
11.1.5. Recent Developments
11.1.6. SWOT Analysis
11.2. KLK OLEO.
11.2.1. Business Overview
11.2.2. Company Snapshot
11.2.3. Company Market Share Analysis
11.2.4. Company Product Portfolio
11.2.5. Recent Developments
11.2.6. SWOT Analysis
11.3. Ecogreen Oleochemicals
11.3.1. Business Overview
11.3.2. Company Snapshot
11.3.3. Company Market Share Analysis
11.3.4. Company Product Portfolio
11.3.5. Recent Developments
11.3.6. SWOT Analysis
11.4. Procter & Gamble
11.4.1. Business Overview
11.4.2. Company Snapshot
11.4.3. Company Market Share Analysis
11.4.4. Company Product Portfolio
11.4.5. Recent Developments
11.4.6. SWOT Analysis
11.5. IOI Corporation Berhad
11.5.1. Business Overview
11.5.2. Company Snapshot
11.5.3. Company Market Share Analysis
11.5.4. Company Product Portfolio
11.5.5. Recent Developments
11.5.6. SWOT Analysis
11.6. Pacific Oleochemicals Sdn Bhd
11.6.1. Business Overview
11.6.2. Company Snapshot
11.6.3. Company Market Share Analysis
11.6.4. Company Product Portfolio
11.6.5. Recent Developments
11.6.6. SWOT Analysis
11.7. McKinley Resources Inc.
11.7.1. Business Overview
11.7.2. Company Snapshot
11.7.3. Company Market Share Analysis
11.7.4. Company Product Portfolio
11.7.5. Recent Developments
11.7.6. SWOT Analysis
11.8. Cremer Oleo GmbH & Co. KG
11.8.1. Business Overview
11.8.2. Company Snapshot
11.8.3. Company Market Share Analysis
11.8.4. Company Product Portfolio
11.8.5. Recent Developments
11.8.6. SWOT Analysis
11.9. Merck KGaA
11.9.1. Business Overview
11.9.2. Company Snapshot
11.9.3. Company Market Share Analysis
11.9.4. Company Product Portfolio
11.9.5. Recent Developments
11.9.6. SWOT Analysis
11.10. Vigon International, LLC.
11.10.1. Business Overview
11.10.2. Company Snapshot
11.10.3. Company Market Share Analysis
11.10.4. Company Product Portfolio
11.10.5. Recent Developments
11.10.6. SWOT Analysis
11.11. Hydrite Chemical
11.11.1. Business Overview
11.11.2. Company Snapshot
11.11.3. Company Market Share Analysis
11.11.4. Company Product Portfolio
11.11.5. Recent Developments
11.11.6. SWOT Analysis
11.12. Forchem Oyj
11.12.1. Business Overview
11.12.2. Company Snapshot
11.12.3. Company Market Share Analysis
11.12.4. Company Product Portfolio
11.12.5. Recent Developments
11.12.6. SWOT Analysis
11.13. Kraton Corporation
11.13.1. Business Overview
11.13.2. Company Snapshot
11.13.3. Company Market Share Analysis
11.13.4. Company Product Portfolio
11.13.5. Recent Developments
11.13.6. SWOT Analysis
11.14. Oxiteno
11.14.1. Business Overview
11.14.2. Company Snapshot
11.14.3. Company Market Share Analysis
11.14.4. Company Product Portfolio
11.14.5. Recent Developments
11.14.6. SWOT Analysis
11.15. Interfat
11.15.1. Business Overview
11.15.2. Company Snapshot
11.15.3. Company Market Share Analysis
11.15.4. Company Product Portfolio
11.15.5. Recent Developments
11.15.6. SWOT Analysis
11.16. Spectrum Chemical Manufacturing Corp.
11.16.1. Business Overview
11.16.2. Company Snapshot
11.16.3. Company Market Share Analysis
11.16.4. Company Product Portfolio
11.16.5. Recent Developments
11.16.6. SWOT Analysis
List of Table
1. Global Caprylic Acid Market, By Raw Material, 2019-2032 (USD Million) (K Tons)
2. Global Coconut Oil, Caprylic Acid Market, By Region, 2019-2032 (USD Million) (K Tons)
3. Global Mammal Milk, Caprylic Acid Market, By Region, 2019-2032 (USD Million) (K Tons)
4. Global Palm Oil, Caprylic Acid Market, By Region, 2019-2032 (USD Million) (K Tons)
5. Global Others, Caprylic Acid Market, By Region, 2019-2032 (USD Million) (K Tons)
6. Global Caprylic Acid Market, By Application, 2019-2032 (USD Million) (K Tons)
7. Global Food & Beverages Caprylic Acid Market, By Region, 2019-2032 (USD Million) (K Tons)
8. Global Personal Care Caprylic Acid Market, By Region, 2019-2032 (USD Million) (K Tons)
9. Global Pharmaceutical Caprylic Acid Market, By Region, 2019-2032 (USD Million) (K Tons)
10. Global Others Caprylic Acid Market, By Region, 2019-2032 (USD Million) (K Tons)
11. Global Caprylic Acid Market, By Distribution Channel, 2019-2032 (USD Million) (K Tons)
12. Global Offline Caprylic Acid Market, By Region, 2019-2032 (USD Million) (K Tons)
13. Global Online Caprylic Acid Market, By Region, 2019-2032 (USD Million) (K Tons)
14. Global Caprylic Acid Market, By Region, 2019-2032 (USD Million) (K Tons)
15. North America Caprylic Acid Market, By Raw Material, 2019-2032 (USD Million) (K Tons)
16. North America Caprylic Acid Market, By Application, 2019-2032 (USD Million) (K Tons)
17. North America Caprylic Acid Market, By Distribution Channel, 2019-2032 (USD Million) (K Tons)
18. U.S. Caprylic Acid Market, By Raw Material, 2019-2032 (USD Million) (K Tons)
19. U.S. Caprylic Acid Market, By Application, 2019-2032 (USD Million) (K Tons)
20. U.S. Caprylic Acid Market, By Distribution Channel, 2019-2032 (USD Million) (K Tons)
21. Canada Caprylic Acid Market, By Raw Material, 2019-2032 (USD Million) (K Tons)
22. Canada Caprylic Acid Market, By Application, 2019-2032 (USD Million) (K Tons)
23. Canada Caprylic Acid Market, By Distribution Channel, 2019-2032 (USD Million) (K Tons)
24. Mexico Caprylic Acid Market, By Raw Material, 2019-2032 (USD Million) (K Tons)
25. Mexico Caprylic Acid Market, By Application, 2019-2032 (USD Million) (K Tons)
26. Mexico Caprylic Acid Market, By Distribution Channel, 2019-2032 (USD Million) (K Tons)
27. Europe Caprylic Acid Market, By Raw Material, 2019-2032 (USD Million) (K Tons)
28. Europe Caprylic Acid Market, By Application, 2019-2032 (USD Million) (K Tons)
29. Europe Caprylic Acid Market, By Distribution Channel, 2019-2032 (USD Million) (K Tons)
30. Germany Caprylic Acid Market, By Raw Material, 2019-2032 (USD Million) (K Tons)
31. Germany Caprylic Acid Market, By Application, 2019-2032 (USD Million) (K Tons)
32. Germany Caprylic Acid Market, By Distribution Channel, 2019-2032 (USD Million) (K Tons)
33. France Caprylic Acid Market, By Raw Material, 2019-2032 (USD Million) (K Tons)
34. France Caprylic Acid Market, By Application, 2019-2032 (USD Million) (K Tons)
35. France Caprylic Acid Market, By Distribution Channel, 2019-2032 (USD Million) (K Tons)
36. U.K. Caprylic Acid Market, By Raw Material, 2019-2032 (USD Million) (K Tons)
37. U.K. Caprylic Acid Market, By Application, 2019-2032 (USD Million) (K Tons)
38. U.K. Caprylic Acid Market, By Distribution Channel, 2019-2032 (USD Million) (K Tons)
39. Italy Caprylic Acid Market, By Raw Material, 2019-2032 (USD Million) (K Tons)
40. Italy Caprylic Acid Market, By Application, 2019-2032 (USD Million) (K Tons)
41. Italy Caprylic Acid Market, By Distribution Channel, 2019-2032 (USD Million) (K Tons)
42. Spain Caprylic Acid Market, By Raw Material, 2019-2032 (USD Million) (K Tons)
43. Spain Caprylic Acid Market, By Application, 2019-2032 (USD Million) (K Tons)
44. Spain Caprylic Acid Market, By Distribution Channel, 2019-2032 (USD Million) (K Tons)
45. Asia Pacific Caprylic Acid Market, By Raw Material, 2019-2032 (USD Million) (K Tons)
46. Asia Pacific Caprylic Acid Market, By Application, 2019-2032 (USD Million) (K Tons)
47. Asia Pacific Caprylic Acid Market, By Distribution Channel, 2019-2032 (USD Million) (K Tons)
48. Japan Caprylic Acid Market, By Raw Material, 2019-2032 (USD Million) (K Tons)
49. Japan Caprylic Acid Market, By Application, 2019-2032 (USD Million) (K Tons)
50. Japan Caprylic Acid Market, By Distribution Channel, 2019-2032 (USD Million) (K Tons)
51. China Caprylic Acid Market, By Raw Material, 2019-2032 (USD Million) (K Tons)
52. China Caprylic Acid Market, By Application, 2019-2032 (USD Million) (K Tons)
53. China Caprylic Acid Market, By Distribution Channel, 2019-2032 (USD Million) (K Tons)
54. India Caprylic Acid Market, By Raw Material, 2019-2032 (USD Million) (K Tons)
55. India Caprylic Acid Market, By Application, 2019-2032 (USD Million) (K Tons)
56. India Caprylic Acid Market, By Distribution Channel, 2019-2032 (USD Million) (K Tons)
57. South America Caprylic Acid Market, By Raw Material, 2019-2032 (USD Million) (K Tons)
58. South America Caprylic Acid Market, By Application, 2019-2032 (USD Million) (K Tons)
59. South America Caprylic Acid Market, By Distribution Channel, 2019-2032 (USD Million) (K Tons)
60. Brazil Caprylic Acid Market, By Raw Material, 2019-2032 (USD Million) (K Tons)
61. Brazil Caprylic Acid Market, By Application, 2019-2032 (USD Million) (K Tons)
62. Brazil Caprylic Acid Market, By Distribution Channel, 2019-2032 (USD Million) (K Tons)
63. Middle East and Africa Caprylic Acid Market, By Raw Material, 2019-2032 (USD Million) (K Tons)
64. Middle East and Africa Caprylic Acid Market, By Application, 2019-2032 (USD Million) (K Tons)
65. Middle East and Africa Caprylic Acid Market, By Distribution Channel, 2019-2032 (USD Million) (K Tons)
66. UAE Caprylic Acid Market, By Raw Material, 2019-2032 (USD Million) (K Tons)
67. UAE Caprylic Acid Market, By Application, 2019-2032 (USD Million) (K Tons)
68. UAE Caprylic Acid Market, By Distribution Channel, 2019-2032 (USD Million) (K Tons)
69. South Africa Caprylic Acid Market, By Raw Material, 2019-2032 (USD Million) (K Tons)
70. South Africa Caprylic Acid Market, By Application, 2019-2032 (USD Million) (K Tons)
71. South Africa Caprylic Acid Market, By Distribution Channel, 2019-2032 (USD Million) (K Tons)
List of Figures
1. Global Caprylic Acid Market Segmentation
2. Caprylic Acid Market: Research Methodology
3. Market Size Estimation Methodology: Bottom-Up Approach
4. Market Size Estimation Methodology: Top-Down Approach
5. Data Triangulation
6. Porter’s Five Forces Analysis
7. Value Chain Analysis
8. Global Caprylic Acid Market Attractiveness Analysis by Raw Material
9. Global Caprylic Acid Market Attractiveness Analysis by Application
10. Global Caprylic Acid Market Attractiveness Analysis by Distribution Channel
11. Global Caprylic Acid Market Attractiveness Analysis by Region
12. Global Caprylic Acid Market: Dynamics
13. Global Caprylic Acid Market Share by Raw Material (2023 & 2032)
14. Global Caprylic Acid Market Share by Application (2023 & 2032)
15. Global Caprylic Acid Market Share by Distribution Channel (2023 & 2032)
16. Global Caprylic Acid Market Share by Regions (2023 & 2032)
17. Global Caprylic Acid Market Share by Company (2022)
This study forecasts revenue at global, regional, and country levels from 2019 to 2032. The Brainy Insights has segmented the global caprylic acid market based on below-mentioned segments:
Global Caprylic Acid Market by Raw Material:
Global Caprylic Acid Market by Application:
Global Caprylic Acid Market by Distribution Channel:
Global Caprylic Acid Market by Region:
Research has its special purpose to undertake marketing efficiently. In this competitive scenario, businesses need information across all industry verticals; the information about customer wants, market demand, competition, industry trends, distribution channels etc. This information needs to be updated regularly because businesses operate in a dynamic environment. Our organization, The Brainy Insights incorporates scientific and systematic research procedures in order to get proper market insights and industry analysis for overall business success. The analysis consists of studying the market from a miniscule level wherein we implement statistical tools which helps us in examining the data with accuracy and precision.
Our research reports feature both; quantitative and qualitative aspects for any market. Qualitative information for any market research process are fundamental because they reveal the customer needs and wants, usage and consumption for any product/service related to a specific industry. This in turn aids the marketers/investors in knowing certain perceptions of the customers. Qualitative research can enlighten about the different product concepts and designs along with unique service offering that in turn, helps define marketing problems and generate opportunities. On the other hand, quantitative research engages with the data collection process through interviews, e-mail interactions, surveys and pilot studies. Quantitative aspects for the market research are useful to validate the hypotheses generated during qualitative research method, explore empirical patterns in the data with the help of statistical tools, and finally make the market estimations.
The Brainy Insights offers comprehensive research and analysis, based on a wide assortment of factual insights gained through interviews with CXOs and global experts and secondary data from reliable sources. Our analysts and industry specialist assume vital roles in building up statistical tools and analysis models, which are used to analyse the data and arrive at accurate insights with exceedingly informative research discoveries. The data provided by our organization have proven precious to a diverse range of companies, facilitating them to address issues such as determining which products/services are the most appealing, whether or not customers use the product in the manner anticipated, the purchasing intentions of the market and many others.
Our research methodology encompasses an idyllic combination of primary and secondary initiatives. Key phases involved in this process are listed below:

The phase involves the gathering and collecting of market data and its related information with the help of different sources & research procedures.

The data procurement stage involves in data gathering and collecting through various data sources.
This stage involves in extensive research. These data sources includes:
Purchased Database: Purchased databases play a crucial role in estimating the market sizes irrespective of the domain. Our purchased database includes:
Primary Research: The Brainy Insights interacts with leading companies and experts of the concerned domain to develop the analyst team’s market understanding and expertise. It improves and substantiates every single data presented in the market reports. Primary research mainly involves in telephonic interviews, E-mail interactions and face-to-face interviews with the raw material providers, manufacturers/producers, distributors, & independent consultants. The interviews that we conduct provides valuable data on market size and industry growth trends prevailing in the market. Our organization also conducts surveys with the various industry experts in order to gain overall insights of the industry/market. For instance, in healthcare industry we conduct surveys with the pharmacists, doctors, surgeons and nurses in order to gain insights and key information of a medical product/device/equipment which the customers are going to usage. Surveys are conducted in the form of questionnaire designed by our own analyst team. Surveys plays an important role in primary research because surveys helps us to identify the key target audiences of the market. Additionally, surveys helps to identify the key target audience engaged with the market. Our survey team conducts the survey by targeting the key audience, thus gaining insights from them. Based on the perspectives of the customers, this information is utilized to formulate market strategies. Moreover, market surveys helps us to understand the current competitive situation of the industry. To be precise, our survey process typically involve with the 360 analysis of the market. This analytical process begins by identifying the prospective customers for a product or service related to the market/industry to obtain data on how a product/service could fit into customers’ lives.

Secondary Research: The secondary data sources includes information published by the on-profit organizations such as World bank, WHO, company fillings, investor presentations, annual reports, national government documents, statistical databases, blogs, articles, white papers and others. From the annual report, we analyse a company’s revenue to understand the key segment and market share of that organization in a particular region. We analyse the company websites and adopt the product mapping technique which is important for deriving the segment revenue. In the product mapping method, we select and categorize the products offered by the companies catering to domain specific market, deduce the product revenue for each of the companies so as to get overall estimation of the market size. We also source data and analyses trends based on information received from supply side and demand side intermediaries in the value chain. The supply side denotes the data gathered from supplier, distributor, wholesaler and the demand side illustrates the data gathered from the end customers for respective market domain.

The supply side for a domain specific market is analysed by:
The demand side for the market is estimated through:
In-house Library: Apart from these third-party sources, we have our in-house library of qualitative and quantitative information. Our in-house database includes market data for various industry and domains. These data are updated on regular basis as per the changing market scenario. Our library includes, historic databases, internal audit reports and archives.
Sometimes there are instances where there is no metadata or raw data available for any domain specific market. For those cases, we use our expertise to forecast and estimate the market size in order to generate comprehensive data sets. Our analyst team adopt a robust research technique in order to produce the estimates:
Data Synthesis: This stage involves the analysis & mapping of all the information obtained from the previous step. It also involves in scrutinizing the data for any discrepancy observed while data gathering related to the market. The data is collected with consideration to the heterogeneity of sources. Robust scientific techniques are in place for synthesizing disparate data sets and provide the essential contextual information that can orient market strategies. The Brainy Insights has extensive experience in data synthesis where the data passes through various stages:


Market Deduction & Formulation: The final stage comprises of assigning data points at appropriate market spaces so as to deduce feasible conclusions. Analyst perspective & subject matter expert based holistic form of market sizing coupled with industry analysis also plays a crucial role in this stage.
This stage involves in finalization of the market size and numbers that we have collected from data integration step. With data interpolation, it is made sure that there is no gap in the market data. Successful trend analysis is done by our analysts using extrapolation techniques, which provide the best possible forecasts for the market.
Data Validation & Market Feedback: Validation is the most important step in the process. Validation & re-validation via an intricately designed process helps us finalize data-points to be used for final calculations.

The Brainy Insights interacts with leading companies and experts of the concerned domain to develop the analyst team’s market understanding and expertise. It improves and substantiates every single data presented in the market reports. The data validation interview and discussion panels are typically composed of the most experienced industry members. The participants include, however, are not limited to:
Moreover, we always validate our data and findings through primary respondents from all the major regions we are working on.


Free Customization
Fortune 500 Clients
Free Yearly Update On Purchase Of Multi/Corporate License
Companies Served Till Date