- +1-315-215-1633
- sales@thebrainyinsights.com

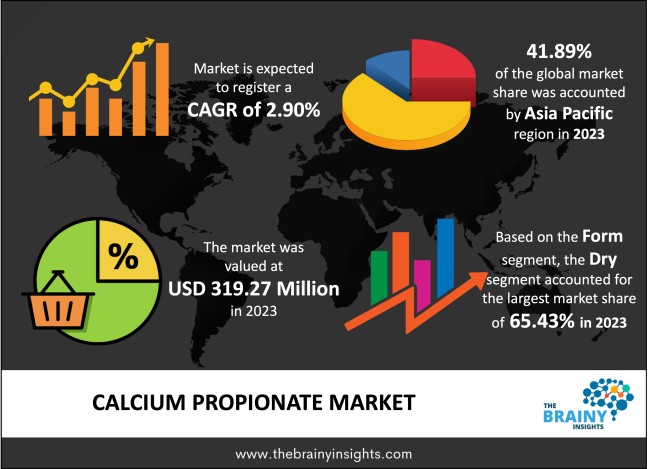
The global calcium propionate market is expected to reach USD 424.92 Million by 2033, at a CAGR of 2.90% from 2024 to 2033. The demand for calcium propionate has been increasing owing to the increasing demand for clean-label food products with extended shelf life. Furthermore, the cost-effectiveness of calcium propionate also propels the market's growth.
Calcium propionate is an organic salt produced by the reaction of calcium hydroxide with propionic acid. This is a compound of the two chemicals, either crystalline or powder. Calcium propionate is soluble in water and has very slight solubility in alcohol. It is mainly used as a food preservative in baked food and bread due to its ability to inhibit the growth of molds and other microorganisms. It has been found that calcium propionate is nontoxic to microorganisms; however, it does not allow them to reproduce and causes human health risks. In recent years, consumers are becoming aware of health's importance, and the rising demand for nutritional food is also increasing rapidly. Consumers these days prefer having natural and organic food over synthetic ones. Calcium propionate is a natural ingredient that is being used rapidly for conserving food and is also considered to be safe to consume. The food industry is regarded as the most technologically advanced industry as it uses advanced technologies such as bacteriophages, MAP, and various preservation techniques to maintain the safety and quality of food. Calcium propionate is widely used as feed for animals. It is also cost-effective compared to other alternatives such as sorbates, sulfites, etc.
Get an overview of this study by requesting a free sample
The increasing demand for nutritional food and the rising health consciousness among consumers drive the market's growth. The growing preference for natural and fresh food over synthetic ones is expected to eliminate most health concerns, increasing the demand for calcium propionate. Most manufacturers in the food industry use natural calcium propionate to make their food safe to consume, adding impetus to the market's growth.
Stringent regulations regarding food safety and the shelf life of food are expected to hamper the market's growth. Food industry manufacturers must check local and regional regulations for allowed applications and dosage levels. The stringent safety and quality food regulations are projected to restrain the global calcium propionate market growth. However, the calcium propionate processing industries are keen on generating the right formulation for presenting the best food products to consumers.
Calcium propionate is increasingly being adopted in the Middle Eastern & Africa due to increasing demand for fresh products and changes in consumer lifestyles. Increasing awareness about calcium propionate and its benefits in the Asia Pacific and North American regions is expected to provide growth opportunities for the market during the forecast period. The emerging developing countries in the region also remain one of the important markets for the manufacturers of calcium propionate because of their regulatory environment and size.
The outbreak of the Covid-19 pandemic challenged the market's growth as several manufacturing units of calcium propionate were temporarily closed to stop the spread of the Covid-19 pandemic. The food industry also suffered a setback during the pandemic as there were high risks of getting in contact with the coronavirus. There were also disruptions in the supply chain which affected the market's growth. Strict lockdown and social distancing restrictions were imposed, which further affected the market's growth.
The global calcium propionate market has been segmented based on form, application, and region.
The regions analyzed for the calcium propionate market include North America, Europe, South America, Asia Pacific, the Middle East, and Africa. The Asia Pacific emerged as the largest market for the global calcium propionate market, with a 41.89% market revenue share in 2023.
The Asia Pacific currently dominates the calcium propionate market with a 41.89% market revenue share in 2023. The market's growth in this region can be attributed to the increasing manufacture of calcium propionate and rapid urbanization. Furthermore, the rise in purchasing power and economic growth adds to the market's growth in the region. Along with this, several manufacturers of calcium propionate are making significant investments in the emerging economies of the Asia Pacific. China and India are expected to provide lucrative growth opportunities during the forecast period.
Asia Pacific region Calcium Propionate Market Share in 2023 - 41.89%
www.thebrainyinsights.com
Check the geographical analysis of this market by requesting a free sample
The key players are now concentrating on implementing strategies such as adopting new Industries, product innovations, mergers & acquisitions, joint ventures, alliances, and partnerships to improve their market position in the global calcium propionate market.
As per The Brainy Insights, the size of the calcium propionate market was valued at USD 319.27 Million in 2023 to USD 424.92 Million by 2033.
The global calcium propionate market is growing at a CAGR of 2.9% during the forecast period 2024-2033.
The global calcium propionate market has been segmented based on form, application, and regions. The dry segment led the market in 2023. The food segment is projected to witness the highest growth during the forecast period.
The Asia Pacific region emerged as the largest market for calcium propionates.
The increasing health concerns will influence the market's growth.
Stringent government regulations could hamper market growth.
Untapped emerging market will provide huge opportunities to the market.
Key players of the global calcium propionate market are Niacet Corporation, Kemira, Krishna Chemicals, Macco Organiques Inc., Perstorp Holding AB, AB Mauri, A.M Food Chemical Co. Limited, Addcon GmbH, ABF Ingredients, and Fine Organics.
1. Introduction
1.1. Objectives of the Study
1.2. Market Definition
1.3. Research Scope
1.4. Currency
1.5. Key Target Audience
2. Research Methodology and Assumptions
3. Executive Summary
4. Premium Insights
4.1. Porter’s Five Forces Analysis
4.2. Value Chain Analysis
4.3. Top Investment Pockets
4.3.1. Market Attractiveness Analysis By Form
4.3.2. Market Attractiveness Analysis By Application
4.3.3. Market Attractiveness Analysis By Region
4.4. Industry Trends
5. Market Dynamics
5.1. Market Evaluation
5.2. Drivers
5.2.1. Increasing health concerns
5.3. Restraints
5.3.1. Stringent government regulations
5.4. Opportunities
5.4.1. Untapped emerging market
5.5. Challenges
5.5.1. Outbreak of Covid-19
6. Global Calcium Propionate Market Analysis and Forecast, By Form
6.1. Segment Overview
6.2. Dry
6.3. Liquid
7. Global Calcium Propionate Market Analysis and Forecast, By Application
7.1. Segment Overview
7.2. Food
7.2.1. Bakery Products
7.2.2. Dairy & Frozen Desserts
7.2.3. Meat
7.2.4. Fish & Seafood Products)
7.3. Feed
8. Global Calcium Propionate Market Analysis and Forecast, By Regional Analysis
8.1. Segment Overview
8.2. North America
8.2.1. U.S.
8.2.2. Canada
8.2.3. Mexico
8.3. Europe
8.3.1. Germany
8.3.2. France
8.3.3. U.K.
8.3.4. Italy
8.3.5. Spain
8.4. Asia-Pacific
8.4.1. Japan
8.4.2. China
8.4.3. India
8.5. South America
8.5.1. Brazil
8.6. Middle East and Africa
8.6.1. UAE
8.6.2. South Africa
9. Global Calcium Propionate Market-Competitive Landscape
9.1. Overview
9.1.1. Market Share of Key Players in the Calcium Propionate Market
9.1.2. Global Company Market Share
9.1.3. North America Company Market Share
9.1.4. Europe Company Market Share
9.1.5. APAC Company Market Share
9.2. Competitive Situations and Trends
9.2.1. Product Launches and Developments
9.2.2. Partnerships, Collaborations, and Agreements
9.2.3. Mergers & Acquisitions
9.2.4. Expansions
10. Company Profiles
10.1. Niacet Corporation
10.1.1. Business Overview
10.1.2. Company Snapshot
10.1.3. Company Market Share Analysis
10.1.4. Company Component Portfolio
10.1.5. Recent Developments
10.1.6. SWOT Analysis
10.2. Kemira
10.2.1. Business Overview
10.2.2. Company Snapshot
10.2.3. Company Market Share Analysis
10.2.4. Company Component Portfolio
10.2.5. Recent Developments
10.2.6. SWOT Analysis
10.3. Krishna Chemicals
10.3.1. Business Overview
10.3.2. Company Snapshot
10.3.3. Company Market Share Analysis
10.3.4. Company Component Portfolio
10.3.5. Recent Developments
10.3.6. SWOT Analysis
10.4. Macco Organiques Inc.
10.4.1. Business Overview
10.4.2. Company Snapshot
10.4.3. Company Market Share Analysis
10.4.4. Company Component Portfolio
10.4.5. Recent Developments
10.4.6. SWOT Analysis
10.5. Perstorp Holding AB
10.5.1. Business Overview
10.5.2. Company Snapshot
10.5.3. Company Market Share Analysis
10.5.4. Company Component Portfolio
10.5.5. Recent Developments
10.5.6. SWOT Analysis
10.6. AB Mauri
10.6.1. Business Overview
10.6.2. Company Snapshot
10.6.3. Company Market Share Analysis
10.6.4. Company Component Portfolio
10.6.5. Recent Developments
10.6.6. SWOT Analysis
10.7. A.M Food Chemical Co. Limited
10.7.1. Business Overview
10.7.2. Company Snapshot
10.7.3. Company Market Share Analysis
10.7.4. Company Component Portfolio
10.7.5. Recent Developments
10.7.6. SWOT Analysis
10.8. Addcon GmbH
10.8.1. Business Overview
10.8.2. Company Snapshot
10.8.3. Company Market Share Analysis
10.8.4. Company Component Portfolio
10.8.5. Recent Developments
10.8.6. SWOT Analysis
10.9. ABF Ingredients.
10.9.1. Business Overview
10.9.2. Company Snapshot
10.9.3. Company Market Share Analysis
10.9.4. Company Component Portfolio
10.9.5. Recent Developments
10.9.6. SWOT Analysis
10.10. Fine Organics
10.10.1. Business Overview
10.10.2. Company Snapshot
10.10.3. Company Market Share Analysis
10.10.4. Company Component Portfolio
10.10.5. Recent Developments
10.10.6. SWOT Analysis
List of Table
1. Global Calcium Propionate Market, By Form, 2020-2033 (USD Million)
2. Global Dry Calcium Propionate Market, By Region, 2020-2033 (USD Million)
3. Global Liquid Calcium Propionate Market, By Region, 2020-2033 (USD Million)
4. Global Calcium Propionate Market, By Application, 2020-2033 (USD Million)
5. Global Food Calcium Propionate Market, By Region, 2020-2033 (USD Million)
6. Global Feed Calcium Propionate Market, By Region, 2020-2033 (USD Million)
7. Global Calcium Propionate Market, By Region, 2020-2033 (USD Million)
8. North America Calcium Propionate Market, By Form, 2020-2033 (USD Million)
9. North America Calcium Propionate Market, By Application, 2020-2033 (USD Million)
10. U.S. Calcium Propionate Market, By Form, 2020-2033 (USD Million)
11. U.S. Calcium Propionate Market, By Application, 2020-2033 (USD Million)
12. Canada Calcium Propionate Market, By Form, 2020-2033 (USD Million)
13. Canada Calcium Propionate Market, By Application, 2020-2033 (USD Million)
14. Mexico Calcium Propionate Market, By Form, 2020-2033 (USD Million)
15. Mexico Calcium Propionate Market, By Application, 2020-2033 (USD Million)
16. Europe Calcium Propionate Market, By Form, 2020-2033 (USD Million)
17. Europe Calcium Propionate Market, By Application, 2020-2033 (USD Million)
18. Germany Calcium Propionate Market, By Form, 2020-2033 (USD Million)
19. Germany Calcium Propionate Market, By Application, 2020-2033 (USD Million)
20. France Calcium Propionate Market, By Form, 2020-2033 (USD Million)
21. France Calcium Propionate Market, By Application, 2020-2033 (USD Million)
22. U.K. Calcium Propionate Market, By Form, 2020-2033 (USD Million)
23. U.K. Calcium Propionate Market, By Application, 2020-2033 (USD Million)
24. Italy Calcium Propionate Market, By Form, 2020-2033 (USD Million)
25. Italy Calcium Propionate Market, By Application, 2020-2033 (USD Million)
26. Spain Calcium Propionate Market, By Form, 2020-2033 (USD Million)
27. Spain Calcium Propionate Market, By Application, 2020-2033 (USD Million)
28. Asia Pacific Calcium Propionate Market, By Form, 2020-2033 (USD Million)
29. Asia Pacific Calcium Propionate Market, By Application, 2020-2033 (USD Million)
30. Japan Calcium Propionate Market, By Form, 2020-2033 (USD Million)
31. Japan Calcium Propionate Market, By Application, 2020-2033 (USD Million)
32. China Calcium Propionate Market, By Form, 2020-2033 (USD Million)
33. China Calcium Propionate Market, By Application, 2020-2033 (USD Million)
34. India Calcium Propionate Market, By Form, 2020-2033 (USD Million)
35. India Calcium Propionate Market, By Application, 2020-2033 (USD Million)
36. South America Calcium Propionate Market, By Form, 2020-2033 (USD Million)
37. South America Calcium Propionate Market, By Application, 2020-2033 (USD Million)
38. Brazil Calcium Propionate Market, By Form, 2020-2033 (USD Million)
39. Brazil Calcium Propionate Market, By Application, 2020-2033 (USD Million)
40. The Middle East and Africa Calcium Propionate Market, By Form, 2020-2033 (USD Million)
41. The Middle East and Africa Calcium Propionate Market, By Application, 2020-2033 (USD Million)
42. UAE Calcium Propionate Market, By Form, 2020-2033 (USD Million)
43. UAE Calcium Propionate Market, By Application, 2020-2033 (USD Million)
44. South Africa Calcium Propionate Market, By Form, 2020-2033 (USD Million)
45. South Africa Calcium Propionate Market, By Application, 2020-2033 (USD Million)
List of Figures
1. Global Calcium Propionate Market Segmentation
2. Calcium Propionate Market: Research Methodology
3. Market Size Estimation Methodology: Bottom-Up Approach
4. Market Size Estimation Methodology: Top-Down Approach
5. Data Triangulation
6. Porter’s Five Forces Analysis
7. Value Chain Analysis
8. Global Calcium Propionate Market Attractiveness Analysis By Form
9. Global Calcium Propionate Market Attractiveness Analysis By Application
10. Global Calcium Propionate Market Attractiveness Analysis By Region
11. Global Calcium Propionate Market: Dynamics
12. Global Calcium Propionate Market Share by Form (2023 & 2033)
13. Global Calcium Propionate Market Share by Application (2023 & 2033)
14. Global Calcium Propionate Market Share by Regions (2023 & 2033)
15. Global Calcium Propionate Market Share by Company (2023)
This study forecasts revenue at global, regional, and country levels from 2020 to 2033. Brainy Insights has segmented the global calcium propionate based on the below-mentioned segments:
Global Calcium Propionate by Form:
Global Calcium Propionate by Application:
Global Calcium Propionate by Region:
Research has its special purpose to undertake marketing efficiently. In this competitive scenario, businesses need information across all industry verticals; the information about customer wants, market demand, competition, industry trends, distribution channels etc. This information needs to be updated regularly because businesses operate in a dynamic environment. Our organization, The Brainy Insights incorporates scientific and systematic research procedures in order to get proper market insights and industry analysis for overall business success. The analysis consists of studying the market from a miniscule level wherein we implement statistical tools which helps us in examining the data with accuracy and precision.
Our research reports feature both; quantitative and qualitative aspects for any market. Qualitative information for any market research process are fundamental because they reveal the customer needs and wants, usage and consumption for any product/service related to a specific industry. This in turn aids the marketers/investors in knowing certain perceptions of the customers. Qualitative research can enlighten about the different product concepts and designs along with unique service offering that in turn, helps define marketing problems and generate opportunities. On the other hand, quantitative research engages with the data collection process through interviews, e-mail interactions, surveys and pilot studies. Quantitative aspects for the market research are useful to validate the hypotheses generated during qualitative research method, explore empirical patterns in the data with the help of statistical tools, and finally make the market estimations.
The Brainy Insights offers comprehensive research and analysis, based on a wide assortment of factual insights gained through interviews with CXOs and global experts and secondary data from reliable sources. Our analysts and industry specialist assume vital roles in building up statistical tools and analysis models, which are used to analyse the data and arrive at accurate insights with exceedingly informative research discoveries. The data provided by our organization have proven precious to a diverse range of companies, facilitating them to address issues such as determining which products/services are the most appealing, whether or not customers use the product in the manner anticipated, the purchasing intentions of the market and many others.
Our research methodology encompasses an idyllic combination of primary and secondary initiatives. Key phases involved in this process are listed below:

The phase involves the gathering and collecting of market data and its related information with the help of different sources & research procedures.

The data procurement stage involves in data gathering and collecting through various data sources.
This stage involves in extensive research. These data sources includes:
Purchased Database: Purchased databases play a crucial role in estimating the market sizes irrespective of the domain. Our purchased database includes:
Primary Research: The Brainy Insights interacts with leading companies and experts of the concerned domain to develop the analyst team’s market understanding and expertise. It improves and substantiates every single data presented in the market reports. Primary research mainly involves in telephonic interviews, E-mail interactions and face-to-face interviews with the raw material providers, manufacturers/producers, distributors, & independent consultants. The interviews that we conduct provides valuable data on market size and industry growth trends prevailing in the market. Our organization also conducts surveys with the various industry experts in order to gain overall insights of the industry/market. For instance, in healthcare industry we conduct surveys with the pharmacists, doctors, surgeons and nurses in order to gain insights and key information of a medical product/device/equipment which the customers are going to usage. Surveys are conducted in the form of questionnaire designed by our own analyst team. Surveys plays an important role in primary research because surveys helps us to identify the key target audiences of the market. Additionally, surveys helps to identify the key target audience engaged with the market. Our survey team conducts the survey by targeting the key audience, thus gaining insights from them. Based on the perspectives of the customers, this information is utilized to formulate market strategies. Moreover, market surveys helps us to understand the current competitive situation of the industry. To be precise, our survey process typically involve with the 360 analysis of the market. This analytical process begins by identifying the prospective customers for a product or service related to the market/industry to obtain data on how a product/service could fit into customers’ lives.

Secondary Research: The secondary data sources includes information published by the on-profit organizations such as World bank, WHO, company fillings, investor presentations, annual reports, national government documents, statistical databases, blogs, articles, white papers and others. From the annual report, we analyse a company’s revenue to understand the key segment and market share of that organization in a particular region. We analyse the company websites and adopt the product mapping technique which is important for deriving the segment revenue. In the product mapping method, we select and categorize the products offered by the companies catering to domain specific market, deduce the product revenue for each of the companies so as to get overall estimation of the market size. We also source data and analyses trends based on information received from supply side and demand side intermediaries in the value chain. The supply side denotes the data gathered from supplier, distributor, wholesaler and the demand side illustrates the data gathered from the end customers for respective market domain.

The supply side for a domain specific market is analysed by:
The demand side for the market is estimated through:
In-house Library: Apart from these third-party sources, we have our in-house library of qualitative and quantitative information. Our in-house database includes market data for various industry and domains. These data are updated on regular basis as per the changing market scenario. Our library includes, historic databases, internal audit reports and archives.
Sometimes there are instances where there is no metadata or raw data available for any domain specific market. For those cases, we use our expertise to forecast and estimate the market size in order to generate comprehensive data sets. Our analyst team adopt a robust research technique in order to produce the estimates:
Data Synthesis: This stage involves the analysis & mapping of all the information obtained from the previous step. It also involves in scrutinizing the data for any discrepancy observed while data gathering related to the market. The data is collected with consideration to the heterogeneity of sources. Robust scientific techniques are in place for synthesizing disparate data sets and provide the essential contextual information that can orient market strategies. The Brainy Insights has extensive experience in data synthesis where the data passes through various stages:


Market Deduction & Formulation: The final stage comprises of assigning data points at appropriate market spaces so as to deduce feasible conclusions. Analyst perspective & subject matter expert based holistic form of market sizing coupled with industry analysis also plays a crucial role in this stage.
This stage involves in finalization of the market size and numbers that we have collected from data integration step. With data interpolation, it is made sure that there is no gap in the market data. Successful trend analysis is done by our analysts using extrapolation techniques, which provide the best possible forecasts for the market.
Data Validation & Market Feedback: Validation is the most important step in the process. Validation & re-validation via an intricately designed process helps us finalize data-points to be used for final calculations.

The Brainy Insights interacts with leading companies and experts of the concerned domain to develop the analyst team’s market understanding and expertise. It improves and substantiates every single data presented in the market reports. The data validation interview and discussion panels are typically composed of the most experienced industry members. The participants include, however, are not limited to:
Moreover, we always validate our data and findings through primary respondents from all the major regions we are working on.


Free Customization
Fortune 500 Clients
Free Yearly Update On Purchase Of Multi/Corporate License
Companies Served Till Date