- +1-315-215-1633
- sales@thebrainyinsights.com

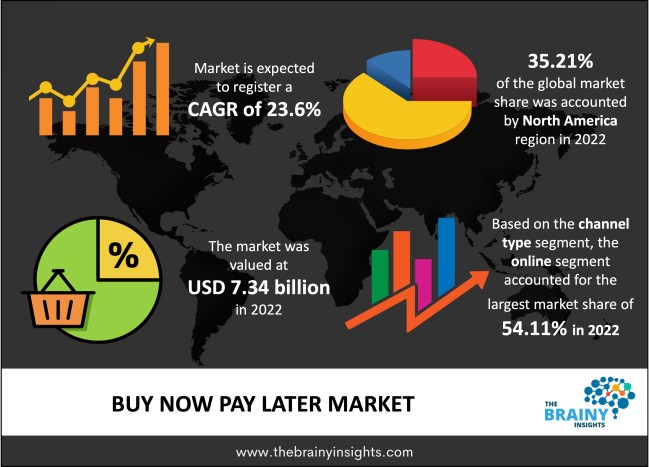
The global buy now pay later market is expected to reach USD 61.09 billion by 2032, at a CAGR of 23.6% from 2023 to 2032. The growth of the e-commerce industry has led to a high adoption rate of buy now pay later. The option of buy now pay later has been an advantage for the e-commerce layers, as most mid-income consumer groups opt for this service, eventually leading to higher sales.
Customers who use buy now, pay later methods can spread their payments. The customers either pay nothing or a small fraction of the amount at purchase. The option of buy now pay later is frequently utilized by retailers looking to increase conversion who sell high-end goods and services like luxury goods or airline tickets, retailers of low-priced goods and services who wish to reach out to potential new customers who might not have credit cards and boost the average cart size. The concept of buy now, pay later divides purchases into equal instalments. Customers often complete a quick online application, which does not affect their credit score unless they miss their timely payments. Directly from the service dashboard, the consumer can make manual instalment payments. By default, BNPL services provide several options, such as banking UPI, debit card, credit card, etc., for EMI payments or full repayment of the outstanding debt.
Get an overview of this study by requesting a free sample
eCommerce routinely experiences a large influx of new trends, which significantly contribute to the growth of the e-commerce sector. The option to pay over time in fixed monthly payments is one such trend percolating in the e-commerce world. With this form of payment, once can acquire ownership of a product by paying for it in regular instalments over a predetermined time frame. Customers on a tight budget benefit greatly from this method of financing because it enables them to purchase expensive things. The customer finds out they can purchase the item in instalments when looking at the price on the display page. The consumer decides to purchase the item using the pay-over-time option because paying the large amount in full at once can be difficult for them, especially when there is a 0% APR offer.
The consumer can be charged a late fine for failing to pay the amount during the given period. The late fees increase exponentially if the customers do not pay the required amount. Due to this factor, many consumers do not opt for the buy now pay later option while purchasing. This limits the market growth of buy now pay later.
The demand for online purchasing has increased in the recent decade due to the growing number of e-commerce websites. The growth of e-commerce websites has increased due to accessibility and internet penetration. With the growing adoption of smartphones, consumers are more willing to buy most goods online. The highest growth rates are seen in the U.S., UK, Germany, France, China, Japan, South Korea, etc., due to consumers' increasing per capita income. Advances in internet marketing have benefited the global buy now pay later substantially. To attract consumers and engage current customers, many buy-now-pay-later brand marketers use new online campaigns and aggressively utilize social media marketing strategies. Buy now pay later has been able to attract more consumers. Also, there is an increase in digital payment in the region, which is driving e-commerce immensely. Consumers found it easy to purchase various products at the buy now pay later option. Thus, with increasing e-commerce platforms, the market for buy now pay later is growing.
Integrating buy now pay later in the existing payment gateway is too costly, especially for mid-scale and small-scale companies. The integration also depends upon the current payment system, and the cost can vary depending on it. Further, the cost of innovation also adds to the total cost.
The global buy now pays later market has been segmented based on channel type, enterprise type, application, and region.
The regions analyzed for the market include North America, Europe, South America, Asia Pacific, the Middle East, and Africa. North America emerged as the largest market for the global buy now pay later market, with a 35.21% share of the market revenue in 2022.
North America region Buy Now Pay Later Market Share in 2022 - 35.21%
www.thebrainyinsights.com
Check the geographical analysis of this market by requesting a free sample
The key players are now concentrating on implementing strategies such as adopting new technology, product innovations, mergers & acquisitions, joint venture, alliances, and partnerships to improve their market position in the global buy now pay later industry.
As per The Brainy Insights, the size of the buy now pay later market was valued at USD 7.34 billion in 2022 to USD 61.09 billion by 2032.
Global buy now pay later market is growing at a CAGR of 23.6% during the forecast period 2023-2032.
North America region emerged as the largest market for the buy now pay later.
The market's growth will be influenced by the rising demand for no EMI instalment-based payments.
High late fees on delayed payment could hamper the market growth.
Increasing adoption by retailers of buy now pay later will provide huge opportunities to the market.
The global buy now pay later market has been segmented based on channel type, enterprise type, application, and regions. The online segment led the market in 2022. The retail segment led the market in 2022.
Key players are Affirm, Afterpay, Klarna, LatitutePay, Openpay, PayPal, Prepay Inc., QuadPay Inc., Sizzle, and Splitit.
1. Introduction
1.1. Objectives of the Study
1.2. Market Definition
1.3. Research Scope
1.4. Currency
1.5. Key Target Audience
2. Research Methodology and Assumptions
3. Executive Summary
4. Premium Insights
4.1. Porter’s Five Forces Analysis
4.2. Value Chain Analysis
4.3. Top Investment Pockets
4.3.1. Market Attractiveness Analysis by Channel Type
4.3.2. Market Attractiveness Analysis by Enterprise Type
4.3.3. Market Attractiveness Analysis by Application
4.3.4. Market Attractiveness Analysis by Region
4.4. Industry Trends
5. Market Dynamics
5.1. Market Evaluation
5.2. Drivers
5.2.1. The rising demand for no EMI instalment-based payments
5.3. Restraints
5.3.1. High late fees on delayed repayment
5.4. Opportunities
5.4.1. Increasing adoption by retailers
5.5. Challenges
5.5.1. Integration of BNPL is expensive
6. Global Buy Now Pay Later Market Analysis and Forecast, By Channel Type
6.1. Segment Overview
6.2. Point-Of-Sales (POS)
6.3. Online
7. Global Buy Now Pay Later Market Analysis and Forecast, By Enterprise Type
7.1. Segment Overview
7.2. Large Enterprise
7.3. Small & Medium Enterprise
8. Global Buy Now Pay Later Market Analysis and Forecast, By Application
8.1. Segment Overview
8.2. Retail
8.3. Consumer Electronics
8.4. Healthcare
8.5. Leisure & Entertainment
8.6. Fashion & Garment
8.7. Others
9. Global Buy Now Pay Later Market Analysis and Forecast, By Regional Analysis
9.1. Segment Overview
9.2. North America
9.2.1. U.S.
9.2.2. Canada
9.2.3. Mexico
9.3. Europe
9.3.1. Germany
9.3.2. France
9.3.3. U.K.
9.3.4. Italy
9.3.5. Spain
9.4. Asia-Pacific
9.4.1. Japan
9.4.2. China
9.4.3. India
9.5. South America
9.5.1. Brazil
9.6. Middle East and Africa
9.6.1. UAE
9.6.2. South Africa
10. Global Buy Now Pay Later Market-Competitive Landscape
10.1. Overview
10.2. Market Share of Key Players in the Buy Now Pay Later Market
10.2.1. Global Company Market Share
10.2.2. North America Company Market Share
10.2.3. Europe Company Market Share
10.2.4. APAC Company Market Share
10.3. Competitive Situations and Trends
10.3.1. Product Launches and Developments
10.3.2. Partnerships, Collaborations, and Agreements
10.3.3. Mergers & Acquisitions
10.3.4. Expansions
11. Company Profiles
11.1. Affirm
11.1.1. Business Overview
11.1.2. Company Snapshot
11.1.3. Company Market Share Analysis
11.1.4. Company Product Portfolio
11.1.5. Recent Developments
11.1.6. SWOT Analysis
11.2. Afterpay
11.2.1. Business Overview
11.2.2. Company Snapshot
11.2.3. Company Market Share Analysis
11.2.4. Company Product Portfolio
11.2.5. Recent Developments
11.2.6. SWOT Analysis
11.3. Klarna
11.3.1. Business Overview
11.3.2. Company Snapshot
11.3.3. Company Market Share Analysis
11.3.4. Company Product Portfolio
11.3.5. Recent Developments
11.3.6. SWOT Analysis
11.4. LatitudePay
11.4.1. Business Overview
11.4.2. Company Snapshot
11.4.3. Company Market Share Analysis
11.4.4. Company Product Portfolio
11.4.5. Recent Developments
11.4.6. SWOT Analysis
11.5. Openpay
11.5.1. Business Overview
11.5.2. Company Snapshot
11.5.3. Company Market Share Analysis
11.5.4. Company Product Portfolio
11.5.5. Recent Developments
11.5.6. SWOT Analysis
11.6. PayPal
11.6.1. Business Overview
11.6.2. Company Snapshot
11.6.3. Company Market Share Analysis
11.6.4. Company Product Portfolio
11.6.5. Recent Developments
11.6.6. SWOT Analysis
11.7. Prepay Inc.
11.7.1. Business Overview
11.7.2. Company Snapshot
11.7.3. Company Market Share Analysis
11.7.4. Company Product Portfolio
11.7.5. Recent Developments
11.7.6. SWOT Analysis
11.8. QuadPay Inc.
11.8.1. Business Overview
11.8.2. Company Snapshot
11.8.3. Company Market Share Analysis
11.8.4. Company Product Portfolio
11.8.5. Recent Developments
11.8.6. SWOT Analysis
11.9. Sizzle
11.9.1. Business Overview
11.9.2. Company Snapshot
11.9.3. Company Market Share Analysis
11.9.4. Company Product Portfolio
11.9.5. Recent Developments
11.9.6. SWOT Analysis
11.10. Splitit
11.10.1. Business Overview
11.10.2. Company Snapshot
11.10.3. Company Market Share Analysis
11.10.4. Company Product Portfolio
11.10.5. Recent Developments
11.10.6. SWOT Analysis
List of Table
1. Global Buy Now Pay Later Market, By Channel Type, 2019-2032 (USD Billion)
2. Global Point-Of-Sales (POS) Buy Now Pay Later Market, By Region, 2019-2032 (USD Billion)
3. Global Online Buy Now Pay Later Market, By Region, 2019-2032 (USD Billion)
4. Global Buy Now Pay Later Market, By Enterprise Type, 2019-2032 (USD Billion)
5. Global Large Enterprise Buy Now Pay Later Market, By Region, 2019-2032 (USD Billion)
6. Global Small & Medium Enterprise Buy Now Pay Later Market, By Region, 2019-2032 (USD Billion)
7. Global Buy Now Pay Later Market, By Application, 2019-2032 (USD Billion)
8. Global Retail Buy Now Pay Later Market, By Region, 2019-2032 (USD Billion)
9. Global Consumer Electronics Buy Now Pay Later Market, By Region, 2019-2032 (USD Billion)
10. Global Healthcare Buy Now Pay Later Market, By Region, 2019-2032 (USD Billion)
11. Global Leisure & Entertainment Buy Now Pay Later Market, By Region, 2019-2032 (USD Billion)
12. Global Fashion & Garment Buy Now Pay Later Market, By Region, 2019-2032 (USD Billion)
13. Global Others Buy Now Pay Later Market, By Region, 2019-2032 (USD Billion)
14. Global Buy Now Pay Later Market, By Region, 2019-2032 (USD Billion)
15. North America Buy Now Pay Later Market, By Channel Type, 2019-2032 (USD Billion)
16. North America Buy Now Pay Later Market, By Enterprise Type, 2019-2032 (USD Billion)
17. North America Buy Now Pay Later Market, By Application, 2019-2032 (USD Billion)
18. U.S. Buy Now Pay Later Market, By Channel Type, 2019-2032 (USD Billion)
19. U.S. Buy Now Pay Later Market, By Enterprise Type, 2019-2032 (USD Billion)
20. U.S. Buy Now Pay Later Market, By Application, 2019-2032 (USD Billion)
21. Canada Buy Now Pay Later Market, By Channel Type, 2019-2032 (USD Billion)
22. Canada Buy Now Pay Later Market, By Enterprise Type, 2019-2032 (USD Billion)
23. Canada Buy Now Pay Later Market, By Application, 2019-2032 (USD Billion)
24. Mexico Buy Now Pay Later Market, By Channel Type, 2019-2032 (USD Billion)
25. Mexico Buy Now Pay Later Market, By Enterprise Type, 2019-2032 (USD Billion)
26. Mexico Buy Now Pay Later Market, By Application, 2019-2032 (USD Billion)
27. Europe Buy Now Pay Later Market, By Channel Type, 2019-2032 (USD Billion)
28. Europe Buy Now Pay Later Market, By Enterprise Type, 2019-2032 (USD Billion)
29. Europe Buy Now Pay Later Market, By Application, 2019-2032 (USD Billion)
30. Germany Buy Now Pay Later Market, By Channel Type, 2019-2032 (USD Billion)
31. Germany Buy Now Pay Later Market, By Enterprise Type, 2019-2032 (USD Billion)
32. Germany Buy Now Pay Later Market, By Application, 2019-2032 (USD Billion)
33. France Buy Now Pay Later Market, By Channel Type, 2019-2032 (USD Billion)
34. France Buy Now Pay Later Market, By Enterprise Type, 2019-2032 (USD Billion)
35. France Buy Now Pay Later Market, By Application, 2019-2032 (USD Billion)
36. U.K. Buy Now Pay Later Market, By Channel Type, 2019-2032 (USD Billion)
37. U.K. Buy Now Pay Later Market, By Enterprise Type, 2019-2032 (USD Billion)
38. U.K. Buy Now Pay Later Market, By Application, 2019-2032 (USD Billion)
39. Italy Buy Now Pay Later Market, By Channel Type, 2019-2032 (USD Billion)
40. Italy Buy Now Pay Later Market, By Enterprise Type, 2019-2032 (USD Billion)
41. Italy Buy Now Pay Later Market, By Application, 2019-2032 (USD Billion)
42. Spain Buy Now Pay Later Market, By Channel Type, 2019-2032 (USD Billion)
43. Spain Buy Now Pay Later Market, By Enterprise Type, 2019-2032 (USD Billion)
44. Spain Buy Now Pay Later Market, By Application, 2019-2032 (USD Billion)
45. Asia Pacific Buy Now Pay Later Market, By Channel Type, 2019-2032 (USD Billion)
46. Asia Pacific Buy Now Pay Later Market, By Enterprise Type, 2019-2032 (USD Billion)
47. Asia Pacific Buy Now Pay Later Market, By Application, 2019-2032 (USD Billion)
48. Japan Buy Now Pay Later Market, By Channel Type, 2019-2032 (USD Billion)
49. Japan Buy Now Pay Later Market, By Enterprise Type, 2019-2032 (USD Billion)
50. Japan Buy Now Pay Later Market, By Application, 2019-2032 (USD Billion)
51. China Buy Now Pay Later Market, By Channel Type, 2019-2032 (USD Billion)
52. China Buy Now Pay Later Market, By Enterprise Type, 2019-2032 (USD Billion)
53. China Buy Now Pay Later Market, By Application, 2019-2032 (USD Billion)
54. India Buy Now Pay Later Market, By Channel Type, 2019-2032 (USD Billion)
55. India Buy Now Pay Later Market, By Enterprise Type, 2019-2032 (USD Billion)
56. India Buy Now Pay Later Market, By Application, 2019-2032 (USD Billion)
57. South America Buy Now Pay Later Market, By Channel Type, 2019-2032 (USD Billion)
58. South America Buy Now Pay Later Market, By Enterprise Type, 2019-2032 (USD Billion)
59. South America Buy Now Pay Later Market, By Application, 2019-2032 (USD Billion)
60. Brazil Buy Now Pay Later Market, By Channel Type, 2019-2032 (USD Billion)
61. Brazil Buy Now Pay Later Market, By Enterprise Type, 2019-2032 (USD Billion)
62. Brazil Buy Now Pay Later Market, By Application, 2019-2032 (USD Billion)
63. Middle East and Africa Buy Now Pay Later Market, By Channel Type, 2019-2032 (USD Billion)
64. Middle East and Africa Buy Now Pay Later Market, By Enterprise Type, 2019-2032 (USD Billion)
65. Middle East and Africa Buy Now Pay Later Market, By Application, 2019-2032 (USD Billion)
66. UAE Buy Now Pay Later Market, By Channel Type, 2019-2032 (USD Billion)
67. UAE Buy Now Pay Later Market, By Enterprise Type, 2019-2032 (USD Billion)
68. UAE Buy Now Pay Later Market, By Application, 2019-2032 (USD Billion)
69. South Africa Buy Now Pay Later Market, By Channel Type, 2019-2032 (USD Billion)
70. South Africa Buy Now Pay Later Market, By Enterprise Type, 2019-2032 (USD Billion)
71. South Africa Buy Now Pay Later Market, By Application, 2019-2032 (USD Billion)
List of Figures
1. Global Buy Now Pay Later Market Segmentation
2. Buy Now Pay Later Market: Research Methodology
3. Market Size Estimation Methodology: Bottom-Up Approach
4. Market Size Estimation Methodology: Top-Down Approach
5. Data Triangulation
6. Porter’s Five Forces Analysis
7. Value Chain Analysis
8. Global Buy Now Pay Later Market Attractiveness Analysis by Channel Type
9. Global Buy Now Pay Later Market Attractiveness Analysis by Enterprise Type
10. Global Buy Now Pay Later Market Attractiveness Analysis by Application
11. Global Buy Now Pay Later Market Attractiveness Analysis by Region
12. Global Buy Now Pay Later Market: Dynamics
13. Global Buy Now Pay Later Market Share by Channel Type (2023 & 2032)
14. Global Buy Now Pay Later Market Share by Enterprise Type (2023 & 2032)
15. Global Buy Now Pay Later Market Share by Application (2023 & 2032)
16. Global Buy Now Pay Later Market Share by Regions (2023 & 2032)
17. Global Buy Now Pay Later Market Share by Company (2022)
This study forecasts revenue at global, regional, and country levels from 2019 to 2032. The Brainy Insights has segmented the global buy now pay later market based on below mentioned segments:
Global Buy Now Pay Later Market By Channel Type:
Global Buy Now Pay Later Market By Enterprise Type:
Global Buy Now Pay Later Market By Application:
Global Buy Now Pay Later Market by Region:
Research has its special purpose to undertake marketing efficiently. In this competitive scenario, businesses need information across all industry verticals; the information about customer wants, market demand, competition, industry trends, distribution channels etc. This information needs to be updated regularly because businesses operate in a dynamic environment. Our organization, The Brainy Insights incorporates scientific and systematic research procedures in order to get proper market insights and industry analysis for overall business success. The analysis consists of studying the market from a miniscule level wherein we implement statistical tools which helps us in examining the data with accuracy and precision.
Our research reports feature both; quantitative and qualitative aspects for any market. Qualitative information for any market research process are fundamental because they reveal the customer needs and wants, usage and consumption for any product/service related to a specific industry. This in turn aids the marketers/investors in knowing certain perceptions of the customers. Qualitative research can enlighten about the different product concepts and designs along with unique service offering that in turn, helps define marketing problems and generate opportunities. On the other hand, quantitative research engages with the data collection process through interviews, e-mail interactions, surveys and pilot studies. Quantitative aspects for the market research are useful to validate the hypotheses generated during qualitative research method, explore empirical patterns in the data with the help of statistical tools, and finally make the market estimations.
The Brainy Insights offers comprehensive research and analysis, based on a wide assortment of factual insights gained through interviews with CXOs and global experts and secondary data from reliable sources. Our analysts and industry specialist assume vital roles in building up statistical tools and analysis models, which are used to analyse the data and arrive at accurate insights with exceedingly informative research discoveries. The data provided by our organization have proven precious to a diverse range of companies, facilitating them to address issues such as determining which products/services are the most appealing, whether or not customers use the product in the manner anticipated, the purchasing intentions of the market and many others.
Our research methodology encompasses an idyllic combination of primary and secondary initiatives. Key phases involved in this process are listed below:

The phase involves the gathering and collecting of market data and its related information with the help of different sources & research procedures.

The data procurement stage involves in data gathering and collecting through various data sources.
This stage involves in extensive research. These data sources includes:
Purchased Database: Purchased databases play a crucial role in estimating the market sizes irrespective of the domain. Our purchased database includes:
Primary Research: The Brainy Insights interacts with leading companies and experts of the concerned domain to develop the analyst team’s market understanding and expertise. It improves and substantiates every single data presented in the market reports. Primary research mainly involves in telephonic interviews, E-mail interactions and face-to-face interviews with the raw material providers, manufacturers/producers, distributors, & independent consultants. The interviews that we conduct provides valuable data on market size and industry growth trends prevailing in the market. Our organization also conducts surveys with the various industry experts in order to gain overall insights of the industry/market. For instance, in healthcare industry we conduct surveys with the pharmacists, doctors, surgeons and nurses in order to gain insights and key information of a medical product/device/equipment which the customers are going to usage. Surveys are conducted in the form of questionnaire designed by our own analyst team. Surveys plays an important role in primary research because surveys helps us to identify the key target audiences of the market. Additionally, surveys helps to identify the key target audience engaged with the market. Our survey team conducts the survey by targeting the key audience, thus gaining insights from them. Based on the perspectives of the customers, this information is utilized to formulate market strategies. Moreover, market surveys helps us to understand the current competitive situation of the industry. To be precise, our survey process typically involve with the 360 analysis of the market. This analytical process begins by identifying the prospective customers for a product or service related to the market/industry to obtain data on how a product/service could fit into customers’ lives.

Secondary Research: The secondary data sources includes information published by the on-profit organizations such as World bank, WHO, company fillings, investor presentations, annual reports, national government documents, statistical databases, blogs, articles, white papers and others. From the annual report, we analyse a company’s revenue to understand the key segment and market share of that organization in a particular region. We analyse the company websites and adopt the product mapping technique which is important for deriving the segment revenue. In the product mapping method, we select and categorize the products offered by the companies catering to domain specific market, deduce the product revenue for each of the companies so as to get overall estimation of the market size. We also source data and analyses trends based on information received from supply side and demand side intermediaries in the value chain. The supply side denotes the data gathered from supplier, distributor, wholesaler and the demand side illustrates the data gathered from the end customers for respective market domain.

The supply side for a domain specific market is analysed by:
The demand side for the market is estimated through:
In-house Library: Apart from these third-party sources, we have our in-house library of qualitative and quantitative information. Our in-house database includes market data for various industry and domains. These data are updated on regular basis as per the changing market scenario. Our library includes, historic databases, internal audit reports and archives.
Sometimes there are instances where there is no metadata or raw data available for any domain specific market. For those cases, we use our expertise to forecast and estimate the market size in order to generate comprehensive data sets. Our analyst team adopt a robust research technique in order to produce the estimates:
Data Synthesis: This stage involves the analysis & mapping of all the information obtained from the previous step. It also involves in scrutinizing the data for any discrepancy observed while data gathering related to the market. The data is collected with consideration to the heterogeneity of sources. Robust scientific techniques are in place for synthesizing disparate data sets and provide the essential contextual information that can orient market strategies. The Brainy Insights has extensive experience in data synthesis where the data passes through various stages:


Market Deduction & Formulation: The final stage comprises of assigning data points at appropriate market spaces so as to deduce feasible conclusions. Analyst perspective & subject matter expert based holistic form of market sizing coupled with industry analysis also plays a crucial role in this stage.
This stage involves in finalization of the market size and numbers that we have collected from data integration step. With data interpolation, it is made sure that there is no gap in the market data. Successful trend analysis is done by our analysts using extrapolation techniques, which provide the best possible forecasts for the market.
Data Validation & Market Feedback: Validation is the most important step in the process. Validation & re-validation via an intricately designed process helps us finalize data-points to be used for final calculations.

The Brainy Insights interacts with leading companies and experts of the concerned domain to develop the analyst team’s market understanding and expertise. It improves and substantiates every single data presented in the market reports. The data validation interview and discussion panels are typically composed of the most experienced industry members. The participants include, however, are not limited to:
Moreover, we always validate our data and findings through primary respondents from all the major regions we are working on.


Free Customization
Fortune 500 Clients
Free Yearly Update On Purchase Of Multi/Corporate License
Companies Served Till Date