- +1-315-215-1633
- sales@thebrainyinsights.com

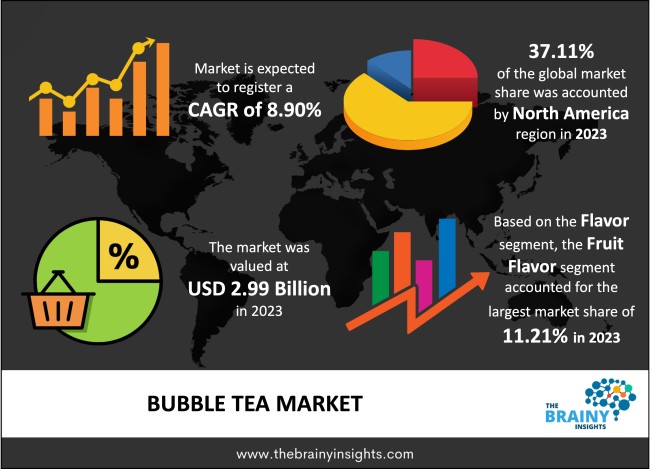
The global bubble tea market was valued at USD 2.99 billion in 2023 and grew at a CAGR of 8.90% from 2024 to 2033. The market is expected to reach USD 7.02 billion by 2033. Increased use of coffee and tea as nootropic beverages by working people and students is a key driver of industry growth. Additionally, the low-calorie and fat-free composition of these beverages is increasing in demand. The demand for bubble tea is probably being driven by the rising popularity of other kinds of hot beverages. Additionally, according to health professionals, moderate use of these beverages enhances mental clarity and brain function. Due to its unique flavors and accessibility of flavors like fruits, chocolate, coffee, and basic classic, bubble tea is becoming more and more popular.
The popularity of bubble tea continues to be high in the region where it first emerged before spreading to other Western nations like Canada and the U.K. The drink's unique recipe has led to its current status as a staple. This well-liked sweetened tea is blended with premium milk, tapioca pearls for sweetness, creamer, fruit powder, and sweeteners. It is promoted as Taiwan's existence within the food service business; bubble tea has become a cultural symbol for the entire globe and represents Taiwan's culinary innovation. Based on one of the studies, the U.S. currently have more than 3,000 bubble tea stores, and it is estimated that this drink will generate a revenue of USD 2.2 Billion in the next ten years. Bubble tea's expansion is broadly attributed to its demand among Gen Z and new additions such as fewer sugar options, low-calorie contents and zero-fat teas. These factors are also driving the bubble tea sector globally.
Get an overview of this study by requesting a free sample
Throughout the world, bubble tea has become a popular and in-demand beverage. The unique flavor, diversity of tastes, and enjoyable experience of consuming it with pearls of tapioca or other toppings attract customers. The rising popularity of bubble tea has been a key factor in the market's expansion. Additionally, the flavors, toppings, and presentation of bubble tea have undergone ongoing innovation and variety. To adapt to shifting consumer tastes, manufacturers and merchants are always developing fresh and innovative combinations. This ongoing product innovation has supported customer interest and stimulated market growth.
Many varieties of bubble tea include a lot of sugar, and some may also have artificial preservatives or chemicals. Concern about the possible side effects of consuming too much sugar and artificial additives is rising as people become more health conscious. Some people may choose to consume less bubble tea or switch to healthier options due to health problems linked to high sugar intake, such as obesity and diabetes.
The food and beverage industries are experiencing an increase in consumer demand for healthier and more useful beverages. By providing low-sugar or sugar-free options, utilizing natural sweeteners, and including useful components like superfoods, vitamins, or probiotics, bubble tea manufacturers may take advantage of this potential. Businesses that sell bubble tea may reach a larger client base and stand out in the market by catering to health-conscious customers.
The bubble tea market in North America dominated the market in 2023 with a market share of 37.11%. The strong demand and consumption of tea drinks with fruity tastes might be responsible for the high proportion. In recent years, the number of bubble tea stores has increased all throughout the United States. During the projection period, the U.S. is anticipated to have the largest market share in the North American regional market.
North America Region Bubble Tea Market Share in 2023 - 37.11%
www.thebrainyinsights.com
Check the geographical analysis of this market by requesting a free sample
The fruit flavor segment is likely to dominate the global market, with the highest CAGR of 11.21% over the forecast period. Throughout the projected period, it is anticipated to hold on to the number one place. The primary element promoting the segment's expansion is the accessibility of a variety of fruit tastes, including strawberries, mangoes, passion fruits, watermelon, pineapples, cantaloupe, avocados, peach, coconuts, lychee, grapes, honeydew, kiwi, and banana. In addition, the fruit taste of the tea is packed with vitamins and antioxidants and works wonders to remove toxins from the body.
The black tea segment dominated the market in 2023 with a market share of 41.23%. Black tea's genuine, all-natural taste is credited with its expansion. Additionally, the beverage enhances intestinal health and lowers blood sugar levels and bad cholesterol. Additionally, it serves as a fantastic source of antioxidants. Black tea has a significant amount of antioxidants, which enhance gastrointestinal and cardiovascular wellness as well as reduce cholesterol, blood sugar, and blood pressure.
| Attribute | Description |
|---|---|
| Market Size | Revenue (USD Billion) |
| Market size value in 2023 | USD 2.99 Billion |
| Market size value in 2033 | USD 7.02 Billion |
| CAGR (2024 to 2033) | 8.90% |
| Historical data | 2020-2022 |
| Base Year | 2023 |
| Forecast | 2024-2033 |
| Region | The regions analyzed for the market are Asia Pacific, Europe, South America, North America, and Middle East & Africa. Furthermore, the regions are further analyzed at the country level. |
| Segments | Flavor, Type, Region |
As per The Brainy Insights, the size of the bubble tea market was valued at USD 2.99 billion in 2023 to USD 7.02 billion by 2033.
The global bubble tea market is growing at a CAGR of 8.90 % during the forecast period 2024-2033.
The North American region emerged as the largest market for the bubble tea.
The rising popularity of bubble tea will influence the market's growth.
1. Introduction
1.1. Objectives of the Study
1.2. Market Definition
1.3. Research Scope
1.4. Currency
1.5. Key Target Audience
2. Research Methodology and Assumptions
3. Executive Summary
4. Premium Insights
4.1. Porter’s Five Forces Analysis
4.2. Value Chain Analysis
4.3. Top Investment Pockets
4.3.1. Market Attractiveness Analysis by Flavor
4.3.2. Market Attractiveness Analysis by Type
4.3.3. Market Attractiveness Analysis by Region
4.4. Industry Trends
5. Market Dynamics
5.1. Market Evaluation
5.2. Drivers
5.2.1. Rising popularity of bubble tea
5.3. Restraints
5.3.1. Health issues due to excessive consumption
5.4. Opportunities
5.4.1. Increase in consumer demand for healthier and more useful beverages
6. Global Bubble Tea Market Analysis and Forecast, By Flavor
6.1. Segment Overview
6.2. Coffee
6.3. Fruit
6.4. Strawberry
6.5. Taro
6.6. Classic
7. Global Bubble Tea Market Analysis and Forecast, By Type
7.1. Segment Overview
7.2. Black Tea
7.3. Green Tea
7.4. Oolong Tea
8. Global Bubble Tea Market Analysis and Forecast, By Regional Analysis
8.1. Segment Overview
8.2. North America
8.2.1. U.S.
8.2.2. Canada
8.2.3. Mexico
8.3. Europe
8.3.1. Germany
8.3.2. France
8.3.3. U.K.
8.3.4. Italy
8.3.5. Spain
8.4. Asia-Pacific
8.4.1. Japan
8.4.2. China
8.4.3. India
8.5. South America
8.5.1. Brazil
8.6. Middle East and Africa
8.6.1. UAE
8.6.2. South Africa
9. Global Bubble Tea Market-Competitive Landscape
9.1. Overview
9.2. Market Share of Key Players in the Bubble Tea Market
9.2.1. Global Company Market Share
9.2.2. North America Company Market Share
9.2.3. Europe Company Market Share
9.2.4. APAC Company Market Share
9.3. Competitive Situations and Trends
9.3.1. Product Launches and Developments
9.3.2. Partnerships, Collaborations, and Agreements
9.3.3. Mergers & Acquisitions
9.3.4. Expansions
10. Company Profiles
10.1. ChaTime
10.1.1. Business Overview
10.1.2. Company Snapshot
10.1.3. Company Market Share Analysis
10.1.4. Company Product Portfolio
10.1.5. Recent Developments
10.1.6. SWOT Analysis
10.2. Lollicup USA, Inc.
10.2.1. Business Overview
10.2.2. Company Snapshot
10.2.3. Company Market Share Analysis
10.2.4. Company Product Portfolio
10.2.5. Recent Developments
10.2.6. SWOT Analysis
10.3. Bubble Tea Supply, Inc.
10.3.1. Business Overview
10.3.2. Company Snapshot
10.3.3. Company Market Share Analysis
10.3.4. Company Product Portfolio
10.3.5. Recent Developments
10.3.6. SWOT Analysis
10.4. T Bun International
10.4.1. Business Overview
10.4.2. Company Snapshot
10.4.3. Company Market Share Analysis
10.4.4. Company Product Portfolio
10.4.5. Recent Developments
10.4.6. SWOT Analysis
10.5. Ten Ren’s Tea Time
10.5.1. Business Overview
10.5.2. Company Snapshot
10.5.3. Company Market Share Analysis
10.5.4. Company Product Portfolio
10.5.5. Recent Developments
10.5.6. SWOT Analysis
10.6. Troika JC
10.6.1. Business Overview
10.6.2. Company Snapshot
10.6.3. Company Market Share Analysis
10.6.4. Company Product Portfolio
10.6.5. Recent Developments
10.6.6. SWOT Analysis
10.7. Bobabox Ltd.
10.7.1. Business Overview
10.7.2. Company Snapshot
10.7.3. Company Market Share Analysis
10.7.4. Company Product Portfolio
10.7.5. Recent Developments
10.7.6. SWOT Analysis
10.8. Bubble Tea House Company
10.8.1. Business Overview
10.8.2. Company Snapshot
10.8.3. Company Market Share Analysis
10.8.4. Company Product Portfolio
10.8.5. Recent Developments
10.8.6. SWOT Analysis
10.9. Fokus, Inc.
10.9.1. Business Overview
10.9.2. Company Snapshot
10.9.3. Company Market Share Analysis
10.9.4. Company Product Portfolio
10.9.5. Recent Developments
10.9.6. SWOT Analysis
10.10. Gong Cha
10.10.1. Business Overview
10.10.2. Company Snapshot
10.10.3. Company Market Share Analysis
10.10.4. Company Product Portfolio
10.10.5. Recent Developments
10.10.6. SWOT Analysis
List of Table
1. Global Bubble Tea Market, By Flavor, 2020-2033 (USD Billion)
2. Global Coffee, Bubble Tea Market, By Region, 2020-2033 (USD Billion)
3. Global Fruit, Bubble Tea Market, By Region, 2020-2033 (USD Billion)
4. Global Strawberry, Bubble Tea Market, By Region, 2020-2033 (USD Billion)
5. Global Taro, Bubble Tea Market, By Region, 2020-2033 (USD Billion)
6. Global Classic, Bubble Tea Market, By Region, 2020-2033 (USD Billion)
7. Global Bubble Tea Market, By Type, 2020-2033 (USD Billion)
8. Global Black Tea, Bubble Tea Market, By Region, 2020-2033 (USD Billion)
9. Global Green Tea, Bubble Tea Market, By Region, 2020-2033 (USD Billion)
10. Global Oolong Tea, Bubble Tea Market, By Region, 2020-2033 (USD Billion)
11. Global Bubble Tea Market, By Region, 2020-2033 (USD Billion)
12. North America Bubble Tea Market, By Flavor, 2020-2033 (USD Billion)
13. North America Bubble Tea Market, By Type, 2020-2033 (USD Billion)
14. U.S. Bubble Tea Market, By Flavor, 2020-2033 (USD Billion)
15. U.S. Bubble Tea Market, By Type, 2020-2033 (USD Billion)
16. Canada Bubble Tea Market, By Flavor, 2020-2033 (USD Billion)
17. Canada Bubble Tea Market, By Type, 2020-2033 (USD Billion)
18. Mexico Bubble Tea Market, By Flavor, 2020-2033 (USD Billion)
19. Mexico Bubble Tea Market, By Type, 2020-2033 (USD Billion)
20. Europe Bubble Tea Market, By Flavor, 2020-2033 (USD Billion)
21. Europe Bubble Tea Market, By Type, 2020-2033 (USD Billion)
22. Germany Bubble Tea Market, By Flavor, 2020-2033 (USD Billion)
23. Germany Bubble Tea Market, By Type, 2020-2033 (USD Billion)
24. France Bubble Tea Market, By Flavor, 2020-2033 (USD Billion)
25. France Bubble Tea Market, By Type, 2020-2033 (USD Billion)
26. U.K. Bubble Tea Market, By Flavor, 2020-2033 (USD Billion)
27. U.K. Bubble Tea Market, By Type, 2020-2033 (USD Billion)
28. Italy Bubble Tea Market, By Flavor, 2020-2033 (USD Billion)
29. Italy Bubble Tea Market, By Type, 2020-2033 (USD Billion)
30. Spain Bubble Tea Market, By Flavor, 2020-2033 (USD Billion)
31. Spain Bubble Tea Market, By Type, 2020-2033 (USD Billion)
32. Asia Pacific Bubble Tea Market, By Flavor, 2020-2033 (USD Billion)
33. Asia Pacific Bubble Tea Market, By Type, 2020-2033 (USD Billion)
34. Japan Bubble Tea Market, By Flavor, 2020-2033 (USD Billion)
35. Japan Bubble Tea Market, By Type, 2020-2033 (USD Billion)
36. China Bubble Tea Market, By Flavor, 2020-2033 (USD Billion)
37. China Bubble Tea Market, By Type, 2020-2033 (USD Billion)
38. India Bubble Tea Market, By Flavor, 2020-2033 (USD Billion)
39. India Bubble Tea Market, By Type, 2020-2033 (USD Billion)
40. South America Bubble Tea Market, By Flavor, 2020-2033 (USD Billion)
41. South America Bubble Tea Market, By Type, 2020-2033 (USD Billion)
42. Brazil Bubble Tea Market, By Flavor, 2020-2033 (USD Billion)
43. Brazil Bubble Tea Market, By Type, 2020-2033 (USD Billion)
44. Middle East and Africa Bubble Tea Market, By Flavor, 2020-2033 (USD Billion)
45. Middle East and Africa Bubble Tea Market, By Type, 2020-2033 (USD Billion)
46. UAE Bubble Tea Market, By Flavor, 2020-2033 (USD Billion)
47. UAE Bubble Tea Market, By Type, 2020-2033 (USD Billion)
48. South Africa Bubble Tea Market, By Flavor, 2020-2033 (USD Billion)
49. South Africa Bubble Tea Market, By Type, 2020-2033 (USD Billion)
List of Figures
1. Global Bubble Tea Market Segmentation
2. Bubble Tea Market: Research Methodology
3. Market Size Estimation Methodology: Bottom-Up Approach
4. Market Size Estimation Methodology: Top-Down Approach
5. Data Triangulation
6. Porter’s Five Forces Analysis
7. Value Chain Analysis
8. Global Bubble Tea Market Attractiveness Analysis by Flavor
9. Global Bubble Tea Market Attractiveness Analysis by Type
10. Global Bubble Tea Market Attractiveness Analysis by Region
11. Global Bubble Tea Market: Dynamics
12. Global Bubble Tea Market Share by Flavor (2023 & 2033)
13. Global Bubble Tea Market Share by Type (2023 & 2033)
14. Global Bubble Tea Market Share by Regions (2023 & 2033)
15. Global Bubble Tea Market Share by Company (2023)
This study forecasts revenue at global, regional, and country levels from 2020 to 2033. The Brainy Insights has segmented the global bubble tea market based on below-mentioned segments:
Global Bubble Tea Market by Flavor:
Global Bubble Tea Market by Type:
Global Bubble Tea Market by Region:
Research has its special purpose to undertake marketing efficiently. In this competitive scenario, businesses need information across all industry verticals; the information about customer wants, market demand, competition, industry trends, distribution channels etc. This information needs to be updated regularly because businesses operate in a dynamic environment. Our organization, The Brainy Insights incorporates scientific and systematic research procedures in order to get proper market insights and industry analysis for overall business success. The analysis consists of studying the market from a miniscule level wherein we implement statistical tools which helps us in examining the data with accuracy and precision.
Our research reports feature both; quantitative and qualitative aspects for any market. Qualitative information for any market research process are fundamental because they reveal the customer needs and wants, usage and consumption for any product/service related to a specific industry. This in turn aids the marketers/investors in knowing certain perceptions of the customers. Qualitative research can enlighten about the different product concepts and designs along with unique service offering that in turn, helps define marketing problems and generate opportunities. On the other hand, quantitative research engages with the data collection process through interviews, e-mail interactions, surveys and pilot studies. Quantitative aspects for the market research are useful to validate the hypotheses generated during qualitative research method, explore empirical patterns in the data with the help of statistical tools, and finally make the market estimations.
The Brainy Insights offers comprehensive research and analysis, based on a wide assortment of factual insights gained through interviews with CXOs and global experts and secondary data from reliable sources. Our analysts and industry specialist assume vital roles in building up statistical tools and analysis models, which are used to analyse the data and arrive at accurate insights with exceedingly informative research discoveries. The data provided by our organization have proven precious to a diverse range of companies, facilitating them to address issues such as determining which products/services are the most appealing, whether or not customers use the product in the manner anticipated, the purchasing intentions of the market and many others.
Our research methodology encompasses an idyllic combination of primary and secondary initiatives. Key phases involved in this process are listed below:

The phase involves the gathering and collecting of market data and its related information with the help of different sources & research procedures.

The data procurement stage involves in data gathering and collecting through various data sources.
This stage involves in extensive research. These data sources includes:
Purchased Database: Purchased databases play a crucial role in estimating the market sizes irrespective of the domain. Our purchased database includes:
Primary Research: The Brainy Insights interacts with leading companies and experts of the concerned domain to develop the analyst team’s market understanding and expertise. It improves and substantiates every single data presented in the market reports. Primary research mainly involves in telephonic interviews, E-mail interactions and face-to-face interviews with the raw material providers, manufacturers/producers, distributors, & independent consultants. The interviews that we conduct provides valuable data on market size and industry growth trends prevailing in the market. Our organization also conducts surveys with the various industry experts in order to gain overall insights of the industry/market. For instance, in healthcare industry we conduct surveys with the pharmacists, doctors, surgeons and nurses in order to gain insights and key information of a medical product/device/equipment which the customers are going to usage. Surveys are conducted in the form of questionnaire designed by our own analyst team. Surveys plays an important role in primary research because surveys helps us to identify the key target audiences of the market. Additionally, surveys helps to identify the key target audience engaged with the market. Our survey team conducts the survey by targeting the key audience, thus gaining insights from them. Based on the perspectives of the customers, this information is utilized to formulate market strategies. Moreover, market surveys helps us to understand the current competitive situation of the industry. To be precise, our survey process typically involve with the 360 analysis of the market. This analytical process begins by identifying the prospective customers for a product or service related to the market/industry to obtain data on how a product/service could fit into customers’ lives.

Secondary Research: The secondary data sources includes information published by the on-profit organizations such as World bank, WHO, company fillings, investor presentations, annual reports, national government documents, statistical databases, blogs, articles, white papers and others. From the annual report, we analyse a company’s revenue to understand the key segment and market share of that organization in a particular region. We analyse the company websites and adopt the product mapping technique which is important for deriving the segment revenue. In the product mapping method, we select and categorize the products offered by the companies catering to domain specific market, deduce the product revenue for each of the companies so as to get overall estimation of the market size. We also source data and analyses trends based on information received from supply side and demand side intermediaries in the value chain. The supply side denotes the data gathered from supplier, distributor, wholesaler and the demand side illustrates the data gathered from the end customers for respective market domain.

The supply side for a domain specific market is analysed by:
The demand side for the market is estimated through:
In-house Library: Apart from these third-party sources, we have our in-house library of qualitative and quantitative information. Our in-house database includes market data for various industry and domains. These data are updated on regular basis as per the changing market scenario. Our library includes, historic databases, internal audit reports and archives.
Sometimes there are instances where there is no metadata or raw data available for any domain specific market. For those cases, we use our expertise to forecast and estimate the market size in order to generate comprehensive data sets. Our analyst team adopt a robust research technique in order to produce the estimates:
Data Synthesis: This stage involves the analysis & mapping of all the information obtained from the previous step. It also involves in scrutinizing the data for any discrepancy observed while data gathering related to the market. The data is collected with consideration to the heterogeneity of sources. Robust scientific techniques are in place for synthesizing disparate data sets and provide the essential contextual information that can orient market strategies. The Brainy Insights has extensive experience in data synthesis where the data passes through various stages:


Market Deduction & Formulation: The final stage comprises of assigning data points at appropriate market spaces so as to deduce feasible conclusions. Analyst perspective & subject matter expert based holistic form of market sizing coupled with industry analysis also plays a crucial role in this stage.
This stage involves in finalization of the market size and numbers that we have collected from data integration step. With data interpolation, it is made sure that there is no gap in the market data. Successful trend analysis is done by our analysts using extrapolation techniques, which provide the best possible forecasts for the market.
Data Validation & Market Feedback: Validation is the most important step in the process. Validation & re-validation via an intricately designed process helps us finalize data-points to be used for final calculations.

The Brainy Insights interacts with leading companies and experts of the concerned domain to develop the analyst team’s market understanding and expertise. It improves and substantiates every single data presented in the market reports. The data validation interview and discussion panels are typically composed of the most experienced industry members. The participants include, however, are not limited to:
Moreover, we always validate our data and findings through primary respondents from all the major regions we are working on.


Free Customization
Fortune 500 Clients
Free Yearly Update On Purchase Of Multi/Corporate License
Companies Served Till Date