- +1-315-215-1633
- sales@thebrainyinsights.com

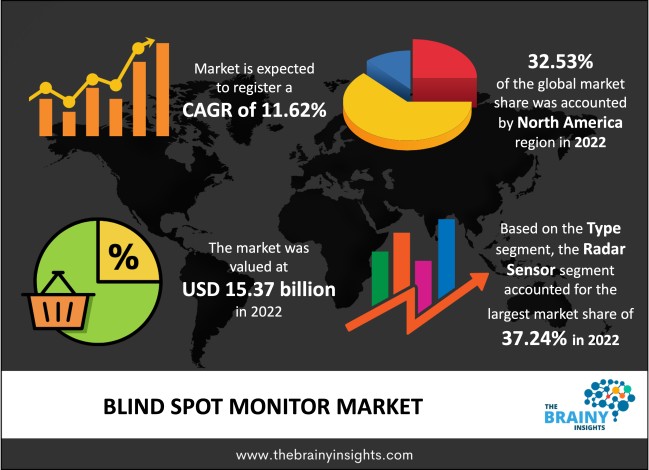
The global blind spot monitor market was valued at USD 15.37 billion in 2022, which is anticipated to grow at a CAGR of 11.62% from 2023 to 2032. Factors projected to fuel market expansion over the forecast period include rising premium car demand and expanding adoption of safety services. The introduction of strict government programmes related to vehicle safety, rising consumer demand for active safety systems, rising OEM adoption of advanced technologies, rising OEM adoption of smart mirrors in the automotive industry, and rising premium vehicle demand are the key market drivers.
The driver's side and rear of other vehicles are detected by the blind spot monitor by a sensor system mounted on the vehicle. Blind spot monitors, however, are an option that can be able to do more than keep an eye on the vehicles' sides and backs. Additionally, they can have cross-traffic warnings, which warn drivers who are reversing out of a parking space when another vehicle is coming from the sides. One of the most helpful techniques for safety is blind spot monitoring. The chances of crossing into another car are reduced if people pay attention to the audio and visual warnings. Blind spot monitoring systems with collision prevention capabilities are even more valuable as they actively steer and brake during a drive, adding an extra layer of security. Commercial vehicles are large and can have poor visibility despite having many mirrors on them. Frequently, the driver cannot see the critical spaces next to the cars. The blind spot monitoring scans the detecting zone for important objects using radar sensors located at the side of the cabin. To help the driver navigate, the system alerts the driver whenever such an object is found. The kind of feature that should be standard is blind spot monitoring, which is present on every Mercedes-Benz vehicle. The market for blind spot monitors is expanding due to rising consumer demand for safety features, expanding industrialization, and rising demand for automated vehicles. The sensors are designed to enhance an obstacle's ability to be detected. Additionally, the market is experiencing development due to rising government spending, rising knowledge regarding the need to drive safely, and rising multi-camera system growth potential. However, the market's expansion may be hampered by the security threat and expensive cost of technology. Vendors are incorporating cutting-edge technology, such as sensor technology, into automobiles for safety reasons, but accomplishing this tends to drive up vehicle prices, which could have a negative impact on the market's expansion.
Get an overview of this study by requesting a free sample
Growing demand as a result of several advantages- The blind spot monitoring system can keep a check on the region, easing the driver's workload and preventing potentially hazardous situations. The majority of luxury cars are equipped with cutting-edge sensors that control the blind spot monitor's operation. Blind spot warnings can save drivers from slamming into another vehicle moving in the same direction in a different lane. The market for blind spot monitors is projected to experience increased demand as consumer awareness of car safety grows. Growing investment in vehicle technologies will likely continue to develop the technology and give consumers even better features.
High costs- The blind spot monitor has expensive and complicated parts. It has shown ineffective performance in adverse conditions. It has low blind spot monitor reliability. The problems will vary based on the vehicle; however, some systems are not built to function effectively at low speeds. This indicates that the system can only be used to a certain extent or is entirely useless at slower speeds.
The regions analyzed for the market include North America, Europe, South America, Asia Pacific, the Middle East, and Africa. North America emerged as the most significant global blind spot monitor market, with a 32.53% market revenue share in 2022. The need for cutting-edge vehicle safety technologies, such as Blind spot monitors, is being driven by the rising middle class and the growing working population. Additionally, end users are becoming more aware of cutting-edge safety features due to more strict government regulations regarding vehicle and road safety. When implementing cutting-edge technology, the US always benefits from being the first to do such a thing.
North America Region Blind Spot Monitor Market Share in 2022 - 32.53%
www.thebrainyinsights.com
Check the geographical analysis of this market by requesting a free sample
The type segment is divided into radar sensor, camera-based sensor, and ultrasonic sensor. The radar sensor segment dominated the market, with a market share of around 37.24% in 2022. An electromagnetic wave-based sensor called a radar sensor uses electromagnetic waves to find objects. There are several uses for radar sensors, including in the military, security, and automotive industries. Radar devices operate by first producing electromagnetic waves, which are then picked up as they reflect off various objects.
The application segment is divided into passenger car, electric vehicle, and commercial vehicle. The passenger car segment dominated the market, with a market share of around 35.91% in 2022. A blind spot monitor is a valuable tool for passenger vehicles. When changing lanes, an electrical device called a blind spot monitor alerts the driver of an approaching car in the adjacent lane. It detects other vehicles using sensors and warns the driver with a visible indication in the rear-view mirror or an audible warning. By minimizing blind spots and raising awareness of oncoming traffic, blind spot monitors can be helpful in accident prevention.
| Attribute | Description |
|---|---|
| Market Size | Revenue (USD Billion) |
| Market size value in 2022 | USD 15.37 Billion |
| Market size value in 2032 | USD 46.14 Billion |
| CAGR (2023 to 2032) | 11.62% |
| Historical data | 2019-2021 |
| Base Year | 2022 |
| Forecast | 2023-2032 |
| Region | The regions analyzed for the market are Asia Pacific, Europe, South America, North America, and Middle East & Africa. Furthermore, the regions are further analyzed at the country level. |
| Segments | Type, Application |
As per The Brainy Insights, the size of the blind spot monitor market was valued at USD 15.37 Billion in 2022 & USD 46.14 Billion by 2032.
Global blind spot monitor market is growing at a CAGR of 11.62% during the forecast period 2023-2032.
North America region emerged as the largest market for the blind spot monitor.
Growing demand as a result of several advantages is a significant driving factor for the growth of the blind spot monitor market.
High costs is a significant challenge for the growth of the blind spot monitor market.
1. Introduction
1.1. Objective of the Study
1.2. Market Definition
1.3. Research Scope
1.4. Currency
1.5. Key Target Audience
2. Research Methodology and Assumptions
3. Executive Summary
4. Premium Insights
4.1. Porter’s Five Forces Analysis
4.2. Value Chain Analysis
4.3. Top Investment Pockets
4.3.1. Market Attractiveness Analysis By Type
4.3.2. Market Attractiveness Analysis By Application
4.3.3. Market Attractiveness Analysis By Region
4.4. Industry Trends
5. Market Dynamics
5.1. Market Evaluation
5.2. Drivers
5.2.1. Growing demand as a result of several advantages
5.3. Challenges
5.3.1. High costs
6. Global Blind Spot Monitor Market Analysis and Forecast, By Type
6.1. Segment Overview
6.2. Radar Sensor
6.3. Camera-based Sensor
6.4. Ultrasonic Sensor
7. Global Blind Spot Monitor Market Analysis and Forecast, By Application
7.1. Segment Overview
7.2. Passenger Car
7.3. Electric Vehicle
7.4. Commercial Vehicle
8. Global Blind Spot Monitor Market Analysis and Forecast, By Regional Analysis
8.1. Segment Overview
8.2. North America
8.2.1. U.S.
8.2.2. Canada
8.2.3. Mexico
8.3. Europe
8.3.1. Germany
8.3.2. France
8.3.3. U.K.
8.3.4. Italy
8.3.5. Spain
8.4. Asia-Pacific
8.4.1. Japan
8.4.2. China
8.4.3. India
8.5. South America
8.5.1. Brazil
8.6. Middle East and Africa
8.6.1. UAE
8.6.2. South Africa
9. Global Blind Spot Monitor Market-Competitive Landscape
9.1. Overview
9.2. Market Share of Key Players in the Blind Spot Monitor Market
9.2.1. Global Company Market Share
9.2.2. North America Company Market Share
9.2.3. Europe Company Market Share
9.2.4. APAC Company Market Share
9.3. Competitive Situations and Trends
9.3.1. Product Launches and Developments
9.3.2. Partnerships, Collaborations, and Agreements
9.3.3. Mergers & Acquisitions
9.3.4. Expansions
10. Company Profiles
10.1. ZF Friedrichshafen AG
10.1.1. Business Overview
10.1.2. Company Snapshot
10.1.3. Company Market Share Analysis
10.1.4. Company Product Portfolio
10.1.5. Recent Developments
10.1.6. SWOT Analysis
10.2. DENSO CORPORATION
10.2.1. Business Overview
10.2.2. Company Snapshot
10.2.3. Company Market Share Analysis
10.2.4. Company Product Portfolio
10.2.5. Recent Developments
10.2.6. SWOT Analysis
10.3. Siemens AG
10.3.1. Business Overview
10.3.2. Company Snapshot
10.3.3. Company Market Share Analysis
10.3.4. Company Product Portfolio
10.3.5. Recent Developments
10.3.6. SWOT Analysis
10.4. Autolive Inc.
10.4.1. Business Overview
10.4.2. Company Snapshot
10.4.3. Company Market Share Analysis
10.4.4. Company Product Portfolio
10.4.5. Recent Developments
10.4.6. SWOT Analysis
10.5. Valeo
10.5.1. Business Overview
10.5.2. Company Snapshot
10.5.3. Company Market Share Analysis
10.5.4. Company Product Portfolio
10.5.5. Recent Developments
10.5.6. SWOT Analysis
10.6. Xiamen Autostar Electronics CO. Ltd.
10.6.1. Business Overview
10.6.2. Company Snapshot
10.6.3. Company Market Share Analysis
10.6.4. Company Product Portfolio
10.6.5. Recent Developments
10.6.6. SWOT Analysis
10.7. Continental AG
10.7.1. Business Overview
10.7.2. Company Snapshot
10.7.3. Company Market Share Analysis
10.7.4. Company Product Portfolio
10.7.5. Recent Developments
10.7.6. SWOT Analysis
10.8. Preco Electronics
10.8.1. Business Overview
10.8.2. Company Snapshot
10.8.3. Company Market Share Analysis
10.8.4. Company Product Portfolio
10.8.5. Recent Developments
10.8.6. SWOT Analysis
10.9. Mobileye
10.9.1. Business Overview
10.9.2. Company Snapshot
10.9.3. Company Market Share Analysis
10.9.4. Company Product Portfolio
10.9.5. Recent Developments
10.9.6. SWOT Analysis
10.10. Smartmicro
10.10.1. Business Overview
10.10.2. Company Snapshot
10.10.3. Company Market Share Analysis
10.10.4. Company Product Portfolio
10.10.5. Recent Developments
10.10.6. SWOT Analysis
10.11. Robert Bosch GmbH
10.11.1. Business Overview
10.11.2. Company Snapshot
10.11.3. Company Market Share Analysis
10.11.4. Company Product Portfolio
10.11.5. Recent Developments
10.11.6. SWOT Analysis
10.12. Ficosa Internacional SA
10.12.1. Business Overview
10.12.2. Company Snapshot
10.12.3. Company Market Share Analysis
10.12.4. Company Product Portfolio
10.12.5. Recent Developments
10.12.6. SWOT Analysis
10.13. Delphi Automotive LLP
10.13.1. Business Overview
10.13.2. Company Snapshot
10.13.3. Company Market Share Analysis
10.13.4. Company Product Portfolio
10.13.5. Recent Developments
10.13.6. SWOT Analysis
List of Table
1. Global Blind Spot Monitor Market, By Type, 2019-2032 (USD Billion)
2. Global Radar Sensor, Blind Spot Monitor Market, By Region, 2019-2032 (USD Billion)
3. Global Camera-based Sensor, Blind Spot Monitor Market, By Region, 2019-2032 (USD Billion)
4. Global Ultrasonic Sensor, Blind Spot Monitor Market, By Region, 2019-2032 (USD Billion)
5. Global Blind Spot Monitor Market, By Application, 2019-2032 (USD Billion)
6. Global Passenger Car, Blind Spot Monitor Market, By Region, 2019-2032 (USD Billion)
7. Global Electric Vehicle, Blind Spot Monitor Market, By Region, 2019-2032 (USD Billion)
8. Global Commercial Vehicle, Blind Spot Monitor Market, By Region, 2019-2032 (USD Billion)
9. Global Blind Spot Monitor Market, By Region, 2019-2032 (USD Billion)
10. North America Blind Spot Monitor Market, By Type, 2019-2032 (USD Billion)
11. North America Blind Spot Monitor Market, By Application, 2019-2032 (USD Billion)
12. U.S. Blind Spot Monitor Market, By Type, 2019-2032 (USD Billion)
13. U.S. Blind Spot Monitor Market, By Application, 2019-2032 (USD Billion)
14. Canada Blind Spot Monitor Market, By Type, 2019-2032 (USD Billion)
15. Canada Blind Spot Monitor Market, By Application, 2019-2032 (USD Billion)
16. Mexico Blind Spot Monitor Market, By Type, 2019-2032 (USD Billion)
17. Mexico Blind Spot Monitor Market, By Application, 2019-2032 (USD Billion)
18. Europe Blind Spot Monitor Market, By Type, 2019-2032 (USD Billion)
19. Europe Blind Spot Monitor Market, By Application, 2019-2032 (USD Billion)
20. Germany Blind Spot Monitor Market, By Type, 2019-2032 (USD Billion)
21. Germany Blind Spot Monitor Market, By Application, 2019-2032 (USD Billion)
22. France Blind Spot Monitor Market, By Type, 2019-2032 (USD Billion)
23. France Blind Spot Monitor Market, By Application, 2019-2032 (USD Billion)
24. U.K. Blind Spot Monitor Market, By Type, 2019-2032 (USD Billion)
25. U.K. Blind Spot Monitor Market, By Application, 2019-2032 (USD Billion)
26. Italy Blind Spot Monitor Market, By Type, 2019-2032 (USD Billion)
27. Italy Blind Spot Monitor Market, By Application, 2019-2032 (USD Billion)
28. Spain Blind Spot Monitor Market, By Type, 2019-2032 (USD Billion)
29. Spain Blind Spot Monitor Market, By Application, 2019-2032 (USD Billion)
30. Asia Pacific Blind Spot Monitor Market, By Type, 2019-2032 (USD Billion)
31. Asia Pacific Blind Spot Monitor Market, By Application, 2019-2032 (USD Billion)
32. Japan Blind Spot Monitor Market, By Type, 2019-2032 (USD Billion)
33. Japan Blind Spot Monitor Market, By Application, 2019-2032 (USD Billion)
34. China Blind Spot Monitor Market, By Type, 2019-2032 (USD Billion)
35. China Blind Spot Monitor Market, By Application, 2019-2032 (USD Billion)
36. India Blind Spot Monitor Market, By Type, 2019-2032 (USD Billion)
37. India Blind Spot Monitor Market, By Application, 2019-2032 (USD Billion)
38. South America Blind Spot Monitor Market, By Type, 2019-2032 (USD Billion)
39. South America Blind Spot Monitor Market, By Application, 2019-2032 (USD Billion)
40. Brazil Blind Spot Monitor Market, By Type, 2019-2032 (USD Billion)
41. Brazil Blind Spot Monitor Market, By Application, 2019-2032 (USD Billion)
42. Middle East and Africa Blind Spot Monitor Market, By Type, 2019-2032 (USD Billion)
43. Middle East and Africa Blind Spot Monitor Market, By Application, 2019-2032 (USD Billion)
44. UAE Blind Spot Monitor Market, By Type, 2019-2032 (USD Billion)
45. UAE Blind Spot Monitor Market, By Application, 2019-2032 (USD Billion)
46. South Africa Blind Spot Monitor Market, By Type, 2019-2032 (USD Billion)
47. South Africa Blind Spot Monitor Market, By Application, 2019-2032 (USD Billion)
List of Figures
1. Global Blind Spot Monitor Market Segmentation
2. Blind Spot Monitor Market: Research Methodology
3. Market Size Estimation Methodology: Bottom-Up Approach
4. Market Size Estimation Methodology: Top-Down Approach
5. Data Triangulation
6. Porter’s Five Forces Analysis
7. Value Chain Analysis
8. Global Blind Spot Monitor Market Attractiveness Analysis By Type
9. Global Blind Spot Monitor Market Attractiveness Analysis By Application
10. Global Blind Spot Monitor Market Attractiveness Analysis By Region
11. Global Blind Spot Monitor Market: Dynamics
12. Global Blind Spot Monitor Market Share By Type (2023 & 2032)
13. Global Blind Spot Monitor Market Share by Application (2023 & 2032)
14. Global Blind Spot Monitor Market Share by Regions (2023 & 2032)
15. Global Blind Spot Monitor Market Share by Company (2022)
This study forecasts revenue at global, regional, and country levels from 2019 to 2032. The Brainy Insights has segmented the global blind spot monitor market based on below mentioned segments:
Global Blind Spot Monitor by Type:
Global Blind Spot Monitor by Application:
Global Blind Spot Monitor by Region:
Research has its special purpose to undertake marketing efficiently. In this competitive scenario, businesses need information across all industry verticals; the information about customer wants, market demand, competition, industry trends, distribution channels etc. This information needs to be updated regularly because businesses operate in a dynamic environment. Our organization, The Brainy Insights incorporates scientific and systematic research procedures in order to get proper market insights and industry analysis for overall business success. The analysis consists of studying the market from a miniscule level wherein we implement statistical tools which helps us in examining the data with accuracy and precision.
Our research reports feature both; quantitative and qualitative aspects for any market. Qualitative information for any market research process are fundamental because they reveal the customer needs and wants, usage and consumption for any product/service related to a specific industry. This in turn aids the marketers/investors in knowing certain perceptions of the customers. Qualitative research can enlighten about the different product concepts and designs along with unique service offering that in turn, helps define marketing problems and generate opportunities. On the other hand, quantitative research engages with the data collection process through interviews, e-mail interactions, surveys and pilot studies. Quantitative aspects for the market research are useful to validate the hypotheses generated during qualitative research method, explore empirical patterns in the data with the help of statistical tools, and finally make the market estimations.
The Brainy Insights offers comprehensive research and analysis, based on a wide assortment of factual insights gained through interviews with CXOs and global experts and secondary data from reliable sources. Our analysts and industry specialist assume vital roles in building up statistical tools and analysis models, which are used to analyse the data and arrive at accurate insights with exceedingly informative research discoveries. The data provided by our organization have proven precious to a diverse range of companies, facilitating them to address issues such as determining which products/services are the most appealing, whether or not customers use the product in the manner anticipated, the purchasing intentions of the market and many others.
Our research methodology encompasses an idyllic combination of primary and secondary initiatives. Key phases involved in this process are listed below:

The phase involves the gathering and collecting of market data and its related information with the help of different sources & research procedures.

The data procurement stage involves in data gathering and collecting through various data sources.
This stage involves in extensive research. These data sources includes:
Purchased Database: Purchased databases play a crucial role in estimating the market sizes irrespective of the domain. Our purchased database includes:
Primary Research: The Brainy Insights interacts with leading companies and experts of the concerned domain to develop the analyst team’s market understanding and expertise. It improves and substantiates every single data presented in the market reports. Primary research mainly involves in telephonic interviews, E-mail interactions and face-to-face interviews with the raw material providers, manufacturers/producers, distributors, & independent consultants. The interviews that we conduct provides valuable data on market size and industry growth trends prevailing in the market. Our organization also conducts surveys with the various industry experts in order to gain overall insights of the industry/market. For instance, in healthcare industry we conduct surveys with the pharmacists, doctors, surgeons and nurses in order to gain insights and key information of a medical product/device/equipment which the customers are going to usage. Surveys are conducted in the form of questionnaire designed by our own analyst team. Surveys plays an important role in primary research because surveys helps us to identify the key target audiences of the market. Additionally, surveys helps to identify the key target audience engaged with the market. Our survey team conducts the survey by targeting the key audience, thus gaining insights from them. Based on the perspectives of the customers, this information is utilized to formulate market strategies. Moreover, market surveys helps us to understand the current competitive situation of the industry. To be precise, our survey process typically involve with the 360 analysis of the market. This analytical process begins by identifying the prospective customers for a product or service related to the market/industry to obtain data on how a product/service could fit into customers’ lives.

Secondary Research: The secondary data sources includes information published by the on-profit organizations such as World bank, WHO, company fillings, investor presentations, annual reports, national government documents, statistical databases, blogs, articles, white papers and others. From the annual report, we analyse a company’s revenue to understand the key segment and market share of that organization in a particular region. We analyse the company websites and adopt the product mapping technique which is important for deriving the segment revenue. In the product mapping method, we select and categorize the products offered by the companies catering to domain specific market, deduce the product revenue for each of the companies so as to get overall estimation of the market size. We also source data and analyses trends based on information received from supply side and demand side intermediaries in the value chain. The supply side denotes the data gathered from supplier, distributor, wholesaler and the demand side illustrates the data gathered from the end customers for respective market domain.

The supply side for a domain specific market is analysed by:
The demand side for the market is estimated through:
In-house Library: Apart from these third-party sources, we have our in-house library of qualitative and quantitative information. Our in-house database includes market data for various industry and domains. These data are updated on regular basis as per the changing market scenario. Our library includes, historic databases, internal audit reports and archives.
Sometimes there are instances where there is no metadata or raw data available for any domain specific market. For those cases, we use our expertise to forecast and estimate the market size in order to generate comprehensive data sets. Our analyst team adopt a robust research technique in order to produce the estimates:
Data Synthesis: This stage involves the analysis & mapping of all the information obtained from the previous step. It also involves in scrutinizing the data for any discrepancy observed while data gathering related to the market. The data is collected with consideration to the heterogeneity of sources. Robust scientific techniques are in place for synthesizing disparate data sets and provide the essential contextual information that can orient market strategies. The Brainy Insights has extensive experience in data synthesis where the data passes through various stages:


Market Deduction & Formulation: The final stage comprises of assigning data points at appropriate market spaces so as to deduce feasible conclusions. Analyst perspective & subject matter expert based holistic form of market sizing coupled with industry analysis also plays a crucial role in this stage.
This stage involves in finalization of the market size and numbers that we have collected from data integration step. With data interpolation, it is made sure that there is no gap in the market data. Successful trend analysis is done by our analysts using extrapolation techniques, which provide the best possible forecasts for the market.
Data Validation & Market Feedback: Validation is the most important step in the process. Validation & re-validation via an intricately designed process helps us finalize data-points to be used for final calculations.

The Brainy Insights interacts with leading companies and experts of the concerned domain to develop the analyst team’s market understanding and expertise. It improves and substantiates every single data presented in the market reports. The data validation interview and discussion panels are typically composed of the most experienced industry members. The participants include, however, are not limited to:
Moreover, we always validate our data and findings through primary respondents from all the major regions we are working on.


Free Customization
Fortune 500 Clients
Free Yearly Update On Purchase Of Multi/Corporate License
Companies Served Till Date