- +1-315-215-1633
- sales@thebrainyinsights.com

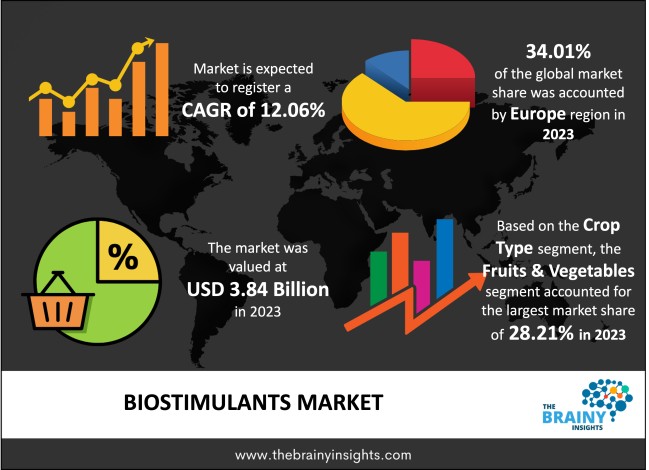
The global biostimulants market was valued at USD 3.84 billion in 2023 and growing at a CAGR of 12.06% from 2024 to 2033. The market is expected to reach USD 11.98 billion by 2033. The organic food industry is expanding at a healthy rate and is the primary driving factor behind developing the biostimulant market. Similarly, strict rules on the usage of chemicals in the agriculture industry, high instances of soil degradation, and the need for sustainable & ecologically friendly options to promote growth and productivity in the agriculture domain. Biostimulants can be substances or microorganisms added to the plants to improve their attributes and increase the yield. There is also an increased demand for sustainably grown food, with lesser concentrations of synthetic chemicals and higher concentrations of biologicals. Therefore, the rising demand for organic and natural goods is impacting the market growth. Biostimulants contain a various spectrum of active components, which have humic acids, microbial inoculants, fulvic acids, seaweed extracts, amino acids, and others which comprise vitamins, trace minerals, and polysaccharides.
Biostimulants are synthetic or natural substances used in plants, soil, and seeds. These substances cause transitions in critical and structural procedures to impact plant growth via improved tolerance to abiotic stresses and improve seed and grain yield and quality. Biostimulants decrease the need for fertilizers and improve plant growth and resistance to water and abiotic stresses. In little concentrations, these substances are efficient, favoring the excellent performance of the plant’s essential functions and permitting high yields and fine-quality products. In expansion, biostimulants used on plants improve nutrition efficiency, plant quality traits, and abiotic stress tolerance, regardless of their nutrient contents. Various types of research have been created to assess the biostimulants in enhancing plant growth subjected to the saline environment, stresses, expansion of seedlings, etc. Similarly, different raw materials have been utilized in biostimulant compositions, like hormones, plant growth-promoting bacteria, algae extracts, and humic acids. However, biostimulants in plant growth as per the raw material used in their compositions and their influences on plants subjected to abiotic stresses. Biostimulants present a potentially new method for controlling and changing physiological functions in plants to promote growth, mitigate stress-induced limitations, and improve yield. The results of biostimulants are still not apparent. They can act on plant productivity as a direct response of plants or soils to the biostimulant application or an indirect reaction from the biostimulant on the soil and plant microbiome with following effects on plant productivity.
Get an overview of this study by requesting a free sample
In June 2021: UPL Australia founded a unique range of Biostimulant products based on GoActiv Technology, created to handle specific physiological or abiotic stresses in vegetables, vines, fruits, and tree crops. GoActiv Technology is founded on a 100% pure extract from the Ascophyllum nodosum seaweed species.
In March 2021: Gowan Company revealed the finalization of the acquisition of Isagro S.p.A. Isagro is now a personally owned company managed by Gowan. In the future, Gowan will incorporate the Isagro business. The purchase develops Gowan’s commercial prospects, deepens scientific capability, and presents chemical synthesis.
Helps in Abiotic Stress Tolerance- Due to global climate change, abiotic stresses like salinity, extreme temperature, drought, and nutrient depletion are impacting agricultural output and causing a yield gap. As per the current climate change scenario, these factors will further reduce crop productivity and eventually pressure food security. Microbial biostimulants are a favorable biological mechanism for enhancing tolerance or resistance to adverse environmental and soil conditions.
Produce Quality Improvement-Applying microbial plant biostimulants can change primary and secondary metabolism in plants. Therefore, it helps accumulate antioxidant molecules, which is helpful for humans. According to studies, it enhances the nutritional and functional quality of different fruits and vegetables, enhancing shelf-life.
Advertising Low-Grade Bio Stimulant Products- The lack of clarity in patent security rules in different nations has led to most low-grade products. However, the biostimulants market has fixed barriers to entry and has permitted many opponents to start operations; the market has broken into smaller bags of market holdings, ultimately leading to inferior products in the market by regional or local manufacturers taking advantage of the increasing need for biostimulants. The low prices of these products from SMEs also lure farmers into buying them, affecting biostimulants' sales.
Advanced technology for biostimulants in agriculture- In the modern agriculture system, biostimulants are acquired from various naturally occurring microorganisms and their biochemical products, like enzymes, organic acids, hormones, and proteins. When interacting with the plant-soil continuum, these substances improve the availability or absorption of vital nutrients used in fertilizers or already living in soil or crop residues. The additional advanced technology utilized by various manufacturers is protein hydrolysates, humic acid, nano surfactant additives, and seaweed with different action modes. So, from the current outlook, using these advanced technologies in organic farming will help in crop productivity growth and soil fertility, protect against pathogens, and raise the farmer's income.
The regions analyzed for the market include North America, Europe, South America, Asia Pacific, the Middle East, and Africa. Europe emerged as the largest market for the global biostimulants market, with a 34.07% share of the market revenue in 2023.
The European biostimulants market is pushed by the increasing significance of a sustainable agriculture approach and the development of the latest innovative products that target precise agronomic demands. Italy, France, and Spain are the primary drivers of more increased consumption of biostimulants in the region. The European countries are also the leading wholesaler of biostimulants to worldwide markets. Additionally, the poor regulatory framework for the industry in the region has led to the growth of multiple startups for biostimulants.
Europe Region Biostimulants Market Share in 2023 - 34.01%
www.thebrainyinsights.com
Check the geographical analysis of this market by requesting a free sample
The crop type segment is divided into ornamentals, cereals, turf, and fruits & vegetables. The fruits & vegetables segment dominated the market, with a market share of around 28.21% in 2023. Biostimulants enhance crop quality parameters like sugars (BRIX), color, firmness, and post-harvest quality. It also improves crop uniformity and fruit size. Biostimulants promote cell division in young fruits. Similarly, they improve the post-harvest life of fruits. Biostimulants are utilized as fruit coloring prompters, particularly for apples, cherries, oranges, and grapes.
The active ingredient segment is divided into microbial amendments, seaweed extracts, amino acids, and humic substances. The amino acids segment dominated the market, with a market share of around 25.33% in 2023. Before, biostimulants were prepared using a single active ingredient specific to a function. With the increasing awareness of sustainability and research activities, manufacturers have been producing formulations with a combination of multiple functional components like amino acids so that an exceptional product can cater to multifunctionality.
The application method type segment is divided into soil, seed, and foliar. The foliar segment dominated the market, with a market share of around 33.11% in 2023. The advantages of foliar treatment include more rapid absorption of nutrients and high cellular activity. The foliar treatment contains the direct application of biostimulants on plant leaves to help quickly absorb nutrients from the surface. The absorption is promoted by the epidermis and stomata present on the surface of the leaves. Biostimulants utilized for foliar treatment are in the form of liquid to maintain easy application and absorption.
| Attribute | Description |
|---|---|
| Market Size | Revenue (USD Billion) |
| Market size value in 2023 | USD 3.84 Billion |
| Market size value in 2033 | USD 11.98 Billion |
| CAGR (2024 to 2033) | 12.06% |
| Historical data | 2020-2022 |
| Base Year | 2023 |
| Forecast | 2024-2033 |
| Region | The regions analyzed for the market are Europe, North America, Asia Pacific, South America, and Middle East & Africa. Furthermore, the regions are further analyzed at the country level. |
| Segments | Crop Type, Active Ingredient, Application Method |
As per The Brainy Insights, the size of the Biostimulants market was valued at USD 3.84 billion in 2023 to USD 11.98 billion by 2033.
Global Biostimulants market is growing at a CAGR of 12.06% during the forecast period 2024-2033.
Europe region emerged as the largest market for the biostimulants market.
1. Introduction
1.1. Objectives of the Study
1.2. Market Definition
1.3. Research Scope
1.4. Currency
1.5. Key Target Audience
2. Research Methodology and Assumptions
3. Executive Summary
4. Premium Insights
4.1. Porter’s Five Forces Analysis
4.2. Value Chain Analysis
4.3. Top Investment Pockets
4.3.1. Market Attractiveness Analysis by Crop Type
4.3.2. Market Attractiveness Analysis by Active Ingredient
4.3.3. Market Attractiveness Analysis by Application Method
4.3.4. Market Attractiveness Analysis by Region
4.4. Industry Trends
5. Market Dynamics
5.1. Market Evaluation
5.2. Drivers
5.2.1. Helps in abiotic stress tolerance to propel market growth
5.3. Restraints
5.3.1. Advertising low-grade bio stimulant products to restrict the market
5.4. Opportunities
5.4.1. Advance technology for biostimulants in agriculture
6. Global Biostimulants Market Analysis and Forecast, By Crop Type:
6.1. Segment Overview
6.2. Ornamentals
6.3. Cereals
6.4. Turf
6.5. Fruits & Vegetables
7. Global Biostimulants Market Analysis and Forecast, By Active Ingredient
7.1. Segment Overview
7.2. Microbial Amendments
7.3. Seaweed Extracts
7.4. Amino Acids
7.5. Humic Substances
8. Global Biostimulants Market Analysis and Forecast, By Application Method
8.1. Segment Overview
8.2. Soil
8.3. Seed
8.4. Foliar
9. Global Biostimulants Market Analysis and Forecast, By Regional Analysis
9.1. Segment Overview
9.2. North America
9.2.1. U.S.
9.2.2. Canada
9.2.3. Mexico
9.3. Europe
9.3.1. Germany
9.3.2. France
9.3.3. U.K.
9.3.4. Italy
9.3.5. Spain
9.4. Asia-Pacific
9.4.1. Japan
9.4.2. China
9.4.3. India
9.5. South America
9.5.1. Brazil
9.6. Middle East and Africa
9.6.1. UAE
9.6.2. South Africa
10. Global Biostimulants Market-Competitive Landscape
10.1. Overview
10.2. Market Share of Key Players in the Biostimulants Market
10.2.1. Global Company Market Share
10.2.2. North America Company Market Share
10.2.3. Europe Company Market Share
10.2.4. APAC Company Market Share
10.3. Competitive Situations and Trends
10.3.1. Product Launches and Developments
10.3.2. Partnerships, Collaborations, and Agreements
10.3.3. Mergers & Acquisitions
10.3.4. Expansions
11. Company Profiles
11.1. Valagro SpA
11.1.1. Business Overview
11.1.2. Company Snapshot
11.1.3. Company Market Share Analysis
11.1.4. Company Product Portfolio
11.1.5. Recent Developments
11.1.6. SWOT Analysis
11.2. Sapec Agro S.A.
11.2.1. Business Overview
11.2.2. Company Snapshot
11.2.3. Company Market Share Analysis
11.2.4. Company Product Portfolio
11.2.5. Recent Developments
11.2.6. SWOT Analysis
11.3. Platform Specialty Products Corp
11.3.1. Business Overview
11.3.2. Company Snapshot
11.3.3. Company Market Share Analysis
11.3.4. Company Product Portfolio
11.3.5. Recent Developments
11.3.6. SWOT Analysis
11.4. Novozymes A/S
11.4.1. Business Overview
11.4.2. Company Snapshot
11.4.3. Company Market Share Analysis
11.4.4. Company Product Portfolio
11.4.5. Recent Developments
11.4.6. SWOT Analysis
11.5. Koppert B.V
11.5.1. Business Overview
11.5.2. Company Snapshot
11.5.3. Company Market Share Analysis
11.5.4. Company Product Portfolio
11.5.5. Recent Developments
11.5.6. SWOT Analysis
11.6. Italpollina SAP
11.6.1. Business Overview
11.6.2. Company Snapshot
11.6.3. Company Market Share Analysis
11.6.4. Company Product Portfolio
11.6.5. Recent Developments
11.6.6. SWOT Analysis
11.7. Isagro Group
11.7.1. Business Overview
11.7.2. Company Snapshot
11.7.3. Company Market Share Analysis
11.7.4. Company Product Portfolio
11.7.5. Recent Developments
11.7.6. SWOT Analysis
11.8. Biostadt India Ltd.
11.8.1. Business Overview
11.8.2. Company Snapshot
11.8.3. Company Market Share Analysis
11.8.4. Company Product Portfolio
11.8.5. Recent Developments
11.8.6. SWOT Analysis
11.9. Biolchim SpA
11.9.1. Business Overview
11.9.2. Company Snapshot
11.9.3. Company Market Share Analysis
11.9.4. Company Product Portfolio
11.9.5. Recent Developments
11.9.6. SWOT Analysis
11.10. BASF SE
11.10.1. Business Overview
11.10.2. Company Snapshot
11.10.3. Company Market Share Analysis
11.10.4. Company Product Portfolio
11.10.5. Recent Developments
11.10.6. SWOT Analysis
List of Table
1. Global Biostimulants Market, By Crop Type, 2020-2033 (USD Billion)
2. Global Ornamentals Biostimulants Market, By Region, 2020-2033 (USD Billion)
3. Global Cereals Biostimulants Market, By Region, 2020-2033 (USD Billion)
4. Global Turf Biostimulants Market, By Region, 2020-2033 (USD Billion)
5. Global Fruits & Vegetables Market, By Region, 2020-2033 (USD Billion)
6. Global Biostimulants Market, By Active Ingredient, 2020-2033 (USD Billion)
7. Global Microbial Amendments Biostimulants Market, By Region, 2020-2033 (USD Billion)
8. Global Seaweed Extracts Biostimulants Market, By Region, 2020-2033 (USD Billion)
9. Global Amino Acids Biostimulants Market, By Region, 2020-2033 (USD Billion)
10. Global Humic Substances Biostimulants Market, By Region, 2020-2033 (USD Billion)
11. Global Biostimulants Market, By Application Method, 2020-2033 (USD Billion)
12. Global Soil Biostimulants Market, By Region, 2020-2033 (USD Billion)
13. Global Seed Biostimulants Market, By Region, 2020-2033 (USD Billion)
14. Global Foliar Biostimulants Market, By Region, 2020-2033 (USD Billion)
15. North America Biostimulants Market, By Crop Type, 2020-2033 (USD Billion)
16. North America Biostimulants Market, By Active Ingredient, 2020-2033 (USD Billion)
17. North America Biostimulants Market, By Application Method, 2020-2033 (USD Billion)
18. U.S. Biostimulants Market, By Crop Type, 2020-2033 (USD Billion)
19. U.S. Biostimulants Market, By Active Ingredient, 2020-2033 (USD Billion)
20. U.S. Biostimulants Market, By Application Method, 2020-2033 (USD Billion)
21. Canada Biostimulants Market, By Crop Type, 2020-2033 (USD Billion)
22. Canada Biostimulants Market, By Active Ingredient, 2020-2033 (USD Billion)
23. Canada Biostimulants Market, By Application Method, 2020-2033 (USD Billion)
24. Mexico Biostimulants Market, By Crop Type, 2020-2033 (USD Billion)
25. Mexico Biostimulants Market, By Active Ingredient, 2020-2033 (USD Billion)
26. Mexico Biostimulants Market, By Application Method, 2020-2033 (USD Billion)
27. Europe Biostimulants Market, By Crop Type, 2020-2033 (USD Billion)
28. Europe Biostimulants Market, By Active Ingredient, 2020-2033 (USD Billion)
29. Europe Biostimulants Market, By Application Method, 2020-2033 (USD Billion)
30. Germany Biostimulants Market, By Crop Type, 2020-2033 (USD Billion)
31. Germany Biostimulants Market, By Active Ingredient, 2020-2033 (USD Billion)
32. Germany Biostimulants Market, By Application Method, 2020-2033 (USD Billion)
33. France Biostimulants Market, By Crop Type 2020-2033 (USD Billion)
34. France Biostimulants Market, By Active Ingredient, 2020-2033 (USD Billion)
35. France Biostimulants Market, By Application Method, 2020-2033 (USD Billion)
36. U.K. Biostimulants Market, By Crop Type, 2020-2033 (USD Billion)
37. U.K. Biostimulants Market, By Active Ingredient, 2020-2033 (USD Billion)
38. U.K. Biostimulants Market, By Application Method, 2020-2033 (USD Billion)
39. Italy Biostimulants Market, By Crop Type, 2020-2033 (USD Billion)
40. Italy Biostimulants Market, By Active Ingredient, 2020-2033 (USD Billion)
41. Italy Biostimulants Market, By Application Method, 2020-2033 (USD Billion)
42. Spain Biostimulants Market, By Crop Type, 2020-2033 (USD Billion)
43. Spain Biostimulants Market, By Active Ingredient, 2020-2033 (USD Billion)
44. Spain Biostimulants Market, By Application Method, 2020-2033 (USD Billion)
45. Asia Pacific Biostimulants Market, By Crop Type, 2020-2033 (USD Billion)
46. Asia Pacific Biostimulants Market, By Active Ingredient, 2020-2033 (USD Billion)
47. Asia Pacific Biostimulants Market, By Application Method, 2020-2033 (USD Billion)
48. Japan Biostimulants Market, By Crop Type, 2020-2033 (USD Billion)
49. Japan Biostimulants Market, By Active Ingredient, 2020-2033 (USD Billion)
50. Japan Biostimulants Market, By Application Method, 2020-2033 (USD Billion)
51. China Biostimulants Market, By Crop Type 2020-2033 (USD Billion)
52. China Biostimulants Market, By Active Ingredient, 2020-2033 (USD Billion)
53. China Biostimulants Market, By Application Method, 2020-2033 (USD Billion)
54. India Biostimulants Market, By Crop Type 2020-2033 (USD Billion)
55. India Biostimulants Market, By Active Ingredient, 2020-2033 (USD Billion)
56. India Biostimulants Market, By Application Method, 2020-2033 (USD Billion)
57. South America Biostimulants Market, By Crop Type, 2020-2033 (USD Billion)
58. South America Biostimulants Market, By Active Ingredient, 2020-2033 (USD Billion)
59. South America Biostimulants Market, By Application Method, 2020-2033 (USD Billion)
60. Brazil Biostimulants Market, By Crop Type 2020-2033 (USD Billion)
61. Brazil Biostimulants Market, By Active Ingredient, 2020-2033 (USD Billion)
62. Brazil Biostimulants Market, By Application Method, 2020-2033 (USD Billion)
63. Middle East and Africa Biostimulants Market, By Crop Type, 2020-2033 (USD Billion)
64. Middle East and Africa Biostimulants Market, By Active Ingredient, 2020-2033 (USD Billion)
65. Middle East and Africa Biostimulants Market, By Application Method, 2020-2033 (USD Billion)
66. UAE Biostimulants Market, By Crop Type, 2020-2033 (USD Billion)
67. UAE Biostimulants Market, By Active Ingredient, 2020-2033 (USD Billion)
68. UAE Biostimulants Market, By Application Method, 2020-2033 (USD Billion)
69. South Africa Biostimulants Market, By Crop Type 2020-2033 (USD Billion)
70. South Africa Biostimulants Market, By Active Ingredient, 2020-2033 (USD Billion)
71. South Africa Biostimulants Market, By Application Method, 2020-2033 (USD Billion)
List of Figures
1. Global Biostimulants Market Segmentation
2. Biostimulants Market: Research Methodology
3. Market Size Estimation Methodology: Bottom-Up Approach
4. Market Size Estimation Methodology: Top-Down Approach
5. Data Triangulation
6. Porter’s Five Forces Analysis
7. Value Chain Analysis
8. Global Biostimulants Market Attractiveness Analysis by Crop Type
9. Global Biostimulants Market Attractiveness Analysis by Active Ingredient
10. Global Biostimulants Market Attractiveness Analysis by Application Method
11. Global Biostimulants Market Attractiveness Analysis by Region
12. Global Biostimulants Market: Dynamics
13. Global Biostimulants Market Share by Crop Type (2023 & 2033)
14. Global Biostimulants Market Share by Active Ingredient (2023 & 2033)
15. Global Biostimulants Market Share by Application Method (2023 & 2033)
16. Global Biostimulants Market Share by Regions (2023 & 2033)
17. Global Biostimulants Market Share by Company (2023)
This study forecasts revenue at global, regional, and country levels from 2020 to 2033. The Brainy Insights has segmented the global biostimulants market based on below mentioned segments:
Global Biostimulants Market by Crop Type:
Global Biostimulants Market by Active Ingredient:
Global Biostimulants Market by Application Method:
Global Biostimulants Market by Region:
Research has its special purpose to undertake marketing efficiently. In this competitive scenario, businesses need information across all industry verticals; the information about customer wants, market demand, competition, industry trends, distribution channels etc. This information needs to be updated regularly because businesses operate in a dynamic environment. Our organization, The Brainy Insights incorporates scientific and systematic research procedures in order to get proper market insights and industry analysis for overall business success. The analysis consists of studying the market from a miniscule level wherein we implement statistical tools which helps us in examining the data with accuracy and precision.
Our research reports feature both; quantitative and qualitative aspects for any market. Qualitative information for any market research process are fundamental because they reveal the customer needs and wants, usage and consumption for any product/service related to a specific industry. This in turn aids the marketers/investors in knowing certain perceptions of the customers. Qualitative research can enlighten about the different product concepts and designs along with unique service offering that in turn, helps define marketing problems and generate opportunities. On the other hand, quantitative research engages with the data collection process through interviews, e-mail interactions, surveys and pilot studies. Quantitative aspects for the market research are useful to validate the hypotheses generated during qualitative research method, explore empirical patterns in the data with the help of statistical tools, and finally make the market estimations.
The Brainy Insights offers comprehensive research and analysis, based on a wide assortment of factual insights gained through interviews with CXOs and global experts and secondary data from reliable sources. Our analysts and industry specialist assume vital roles in building up statistical tools and analysis models, which are used to analyse the data and arrive at accurate insights with exceedingly informative research discoveries. The data provided by our organization have proven precious to a diverse range of companies, facilitating them to address issues such as determining which products/services are the most appealing, whether or not customers use the product in the manner anticipated, the purchasing intentions of the market and many others.
Our research methodology encompasses an idyllic combination of primary and secondary initiatives. Key phases involved in this process are listed below:

The phase involves the gathering and collecting of market data and its related information with the help of different sources & research procedures.

The data procurement stage involves in data gathering and collecting through various data sources.
This stage involves in extensive research. These data sources includes:
Purchased Database: Purchased databases play a crucial role in estimating the market sizes irrespective of the domain. Our purchased database includes:
Primary Research: The Brainy Insights interacts with leading companies and experts of the concerned domain to develop the analyst team’s market understanding and expertise. It improves and substantiates every single data presented in the market reports. Primary research mainly involves in telephonic interviews, E-mail interactions and face-to-face interviews with the raw material providers, manufacturers/producers, distributors, & independent consultants. The interviews that we conduct provides valuable data on market size and industry growth trends prevailing in the market. Our organization also conducts surveys with the various industry experts in order to gain overall insights of the industry/market. For instance, in healthcare industry we conduct surveys with the pharmacists, doctors, surgeons and nurses in order to gain insights and key information of a medical product/device/equipment which the customers are going to usage. Surveys are conducted in the form of questionnaire designed by our own analyst team. Surveys plays an important role in primary research because surveys helps us to identify the key target audiences of the market. Additionally, surveys helps to identify the key target audience engaged with the market. Our survey team conducts the survey by targeting the key audience, thus gaining insights from them. Based on the perspectives of the customers, this information is utilized to formulate market strategies. Moreover, market surveys helps us to understand the current competitive situation of the industry. To be precise, our survey process typically involve with the 360 analysis of the market. This analytical process begins by identifying the prospective customers for a product or service related to the market/industry to obtain data on how a product/service could fit into customers’ lives.

Secondary Research: The secondary data sources includes information published by the on-profit organizations such as World bank, WHO, company fillings, investor presentations, annual reports, national government documents, statistical databases, blogs, articles, white papers and others. From the annual report, we analyse a company’s revenue to understand the key segment and market share of that organization in a particular region. We analyse the company websites and adopt the product mapping technique which is important for deriving the segment revenue. In the product mapping method, we select and categorize the products offered by the companies catering to domain specific market, deduce the product revenue for each of the companies so as to get overall estimation of the market size. We also source data and analyses trends based on information received from supply side and demand side intermediaries in the value chain. The supply side denotes the data gathered from supplier, distributor, wholesaler and the demand side illustrates the data gathered from the end customers for respective market domain.

The supply side for a domain specific market is analysed by:
The demand side for the market is estimated through:
In-house Library: Apart from these third-party sources, we have our in-house library of qualitative and quantitative information. Our in-house database includes market data for various industry and domains. These data are updated on regular basis as per the changing market scenario. Our library includes, historic databases, internal audit reports and archives.
Sometimes there are instances where there is no metadata or raw data available for any domain specific market. For those cases, we use our expertise to forecast and estimate the market size in order to generate comprehensive data sets. Our analyst team adopt a robust research technique in order to produce the estimates:
Data Synthesis: This stage involves the analysis & mapping of all the information obtained from the previous step. It also involves in scrutinizing the data for any discrepancy observed while data gathering related to the market. The data is collected with consideration to the heterogeneity of sources. Robust scientific techniques are in place for synthesizing disparate data sets and provide the essential contextual information that can orient market strategies. The Brainy Insights has extensive experience in data synthesis where the data passes through various stages:


Market Deduction & Formulation: The final stage comprises of assigning data points at appropriate market spaces so as to deduce feasible conclusions. Analyst perspective & subject matter expert based holistic form of market sizing coupled with industry analysis also plays a crucial role in this stage.
This stage involves in finalization of the market size and numbers that we have collected from data integration step. With data interpolation, it is made sure that there is no gap in the market data. Successful trend analysis is done by our analysts using extrapolation techniques, which provide the best possible forecasts for the market.
Data Validation & Market Feedback: Validation is the most important step in the process. Validation & re-validation via an intricately designed process helps us finalize data-points to be used for final calculations.

The Brainy Insights interacts with leading companies and experts of the concerned domain to develop the analyst team’s market understanding and expertise. It improves and substantiates every single data presented in the market reports. The data validation interview and discussion panels are typically composed of the most experienced industry members. The participants include, however, are not limited to:
Moreover, we always validate our data and findings through primary respondents from all the major regions we are working on.


Free Customization
Fortune 500 Clients
Free Yearly Update On Purchase Of Multi/Corporate License
Companies Served Till Date