- +1-315-215-1633
- sales@thebrainyinsights.com

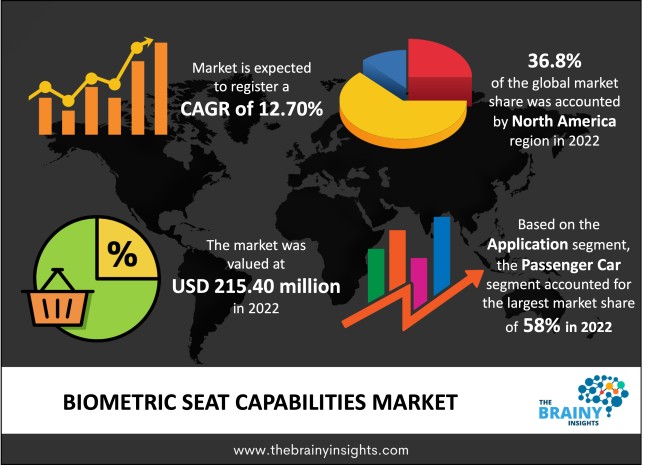
The global biometric seat capabilities market was valued at USD 215.40 million in 2022 and growing at a CAGR of 12.70% from 2023 to 2032. The potential of biometric seats in the automotive industry is anticipated to grow significantly due to rising innovations in the automotive industry, technological advancements and increasing vehicle safety concerns. Concerns and increasing trends in connected vehicles have fueled the growth of this market. Accordingly, advancements in sensors and enhanced software for biometric recognition are also fueling the growth and development of the market. The increasing production, followed by the adoption of electric vehicles, is anticipated to boost market growth and development. Furthermore, the growing industry trend towards autonomous driving is expected to aid the growth of the global biometric seat capabilities market.
Biometric seating is a revolutionary technology that provides safe and comfortable seating solutions tailored to the consumer's body shape and size. This technology uses sensors, software solutions, and hardware to detect, measure and file the user's biometric data, which include weight, height, body type and posture. Biometric seats are designed to offer an extra personalized and custom-designed consumer experience. The seat may be manufactured to provide the luxury along with highest quality safety by accumulating and studying the biometric information of any individual. The obtained Biometric data can also be used to design and manufacture the biometric seat in order to ergonomically correct seating position.
The concept behind the biometric seats is based on body scanning. The technology uses multiple sensors to record and measure the user’s biometric data. The sensors measure the consumer’s body composition, weight, height, and posture. This information is then transferred to a computer, analyzed and used to optimize body posture. Biometric seats have various characteristics to provide a comfortable and safe seating solution. These include adjustable headrests, arms, spine, and leg rests. Adjustable footrests can be positioned to support the user’s toes and ankles, thereby lessening discomfort and fatigue.
Get an overview of this study by requesting a free sample
Rising Demand for Convenience and Security- The primary factor which is fueling the development of the global biometric seat capability market is the growing demand for security and convenience. The demand for safe, secure and reliable authentication has grown over the years within the automotive industry. Biometric seat capabilities provide additional safety and convenience by providing a fast and secure way to control and access the seats of any vehicle. Biometric seat capabilities are becoming increasingly prevalent in automobiles as technology advances. The rising priority of customization demand is another factor propelling the growth of the global biometric seat capability market. As consumers grow more sentient of their preferences and needs, they seek methods and ways to tailor their automobiles to their specific requirements. Biometric seat capabilities offer customization to the consumers at a personalized level by providing a safe and secure way to personalize a vehicle's seat setup. This factor has raised the demand for biometric seat capabilities, providing a safe and convenient method of accessing and operating car seats.
High Cost of Implementation- The global biometric seat capabilities market is experiencing significant growth due to the characteristics to enhance passenger safety, reliability and comfort & personalization while minimizing operational costs. However, some challenges could hinder its expansion. One of this industry's primary limitations is the high implementation cost. It is because the technology requires modern hardware and software to be installed in seats and trained personnel to manage and maintain the system. This factor could pose a significant obstacle for smaller businesses investing in this technology. Additionally, the system requires annual maintenance and updates, which can further increase the total cost of ownership.
Technological Advancements- The global biometric seat capabilities market is expected to experience a boost in growth and development owing to continuous technological advancements. Biometric seat capabilities, which involve integrating biometric technologies into seating systems, have emerged as a promising area of development. By utilizing biometric data like fingerprints and facial recognition, users can quickly and accurately identify themselves and gain access to their seats. Recent improvements in iris scanning, facial recognition, and fingerprint scanning have created secure means of vehicle verification. This has resulted in personalized and safe seat designs catering to individual users' needs, increasing demand for biometric seat capabilities. These capabilities provide an easy-to-use yet secure way of accessing car seats while ensuring convenience and safety for users. These factors are anticipated to positively impact the market growth and development.
The regions analyzed for the market include Europe, North America, South America, Asia Pacific, and Middle East & Africa. North America emerged as the largest market for the global biometric seat capabilities market, with a 36.8% share of the market revenue in 2022. The North American market is experiencing a surge in growth due to the rising popularity of self-driving autonomous cars coupled with the growth in number of travellers across the region. This regional growth is further fueled by the development of biometric seat capabilities, which have become increasingly popular for security and convenience. The demand for personalized driving experiences has also contributed to this trend. Regional market players are implementing various strategies such as mergers, acquisitions, partnerships, and strategic alliances to stay competitive.
North America Region Biometric Seat Capabilities Market Share in 2022 - 36.8%
www.thebrainyinsights.com
Check the geographical analysis of this market by requesting a free sample
The component segment is divided into display, sensor, camera and others. The sensor segment dominated the market, with a market share of around 39% in 2022. The rising adoption of self-driving cars is the primary factor for the segment's growth and development. Also, biometric seats and their sensors are found more in premium and luxury cars. The demand for sensors is expected to rise with the increase in sales of high-end and luxury automobiles, particularly in emerging markets and developing countries.
The application segment is divided into commercial vehicles and passenger cars. The passenger car segment dominated the market, with a market share of around 58% in 2022. The growing adoption of passenger cars amongst the population is the primary factor for the segment growth. Passenger cars are considered to be efficient and effective in urban and sub-urban areas within developing countries like India. Additionally, government rebate programs and initiatives are expected to fuel the demand for the BEV (battery electric vehicles) in India. Furthermore, segment growth is attributable to rising awareness of safety and security among car owners coupled with the desire for more improved and significant vehicle comfort. The growing demand for luxury vehicles has also increased the demand for biometric seat capabilities in passenger cars.
| Attribute | Description |
|---|---|
| Market Size | Revenue (USD Million) |
| Market size value in 2022 | USD 215.40 Million |
| Market size value in 2032 | USD 712.02 Million |
| CAGR (2023 to 2032) | 12.70% |
| Historical data | 2019-2021 |
| Base Year | 2022 |
| Forecast | 2023-2032 |
| Regional Segments | The regions analyzed for the market are Asia Pacific, Europe, South America, North America, and Middle East & Africa. Furthermore, the regions are further analyzed at the country level. |
| Segments | Component, Application |
As per The Brainy Insights, the size of the global biometric seat capabilities market was valued at USD 215.40 Million in 2022 to USD 712.02 billion by 2032.
The global biometric seat capabilities market is growing at a CAGR of 12.70% during the forecast period 2023-2032.
The market's growth will be influenced by the rising demand for improved comfort and safety requirements.
The high implementation cost could hamper the market growth.
1. INTRODUCTION
1.1. OBJECTIVES OF THE STUDY
1.2. MARKET DEFINITION
1.3. RESEARCH SCOPE
1.4. CURRENCY
1.5. KEY TARGET AUDIENCE
2. RESEARCH METHODOLOGY AND ASSUMPTIONS
3. EXECUTIVE SUMMARY
4. PREMIUM INSIGHTS
4.1. PORTER’S FIVE FORCES ANALYSIS
4.2. VALUE CHAIN ANALYSIS
4.3. TOP INVESTMENT POCKETS
4.3.1. MARKET ATTRACTIVENESS ANALYSIS BY COMPONENT
4.3.2. MARKET ATTRACTIVENESS ANALYSIS BY APPLICATION
4.3.3. MARKET ATTRACTIVENESS ANALYSIS BY REGION
4.4. INDUSTRY TRENDS
5. MARKET DYNAMICS
5.1. MARKET EVALUATION
5.2. DRIVERS
5.2.1. RISING DEMAND FOR CONVENIENCE AND SECURITY
5.3. RESTRAINTS
5.3.1. HIGH COST OF IMPLEMENTATION
5.4. OPPORTUNITIES
5.4.1. THE TECHNOLOGICAL ADVANCEMENTS IN BIOMETRIC SEAT CAPABILITIES
6. GLOBAL BIOMETRIC SEAT CAPABILITIES MARKET ANALYSIS AND FORECAST, BY COMPONENT
6.1. SEGMENT OVERVIEW
6.2. DISPLAY
6.3. SENSORS
6.4. CAMERA
6.5. OTHERS
7. GLOBAL BIOMETRIC SEAT CAPABILITIES MARKET ANALYSIS AND FORECAST, BY APPLICATION
7.1. SEGMENT OVERVIEW
7.2. PASSENGER CARS
7.3. COMMERCIAL VEHICLES
8. GLOBAL BIOMETRIC SEAT CAPABILITIES MARKET ANALYSIS AND FORECAST, BY REGIONAL ANALYSIS
8.1. SEGMENT OVERVIEW
8.2. NORTH AMERICA
8.2.1. U.S.
8.2.2. CANADA
8.2.3. MEXICO
8.3. EUROPE
8.3.1. GERMANY
8.3.2. FRANCE
8.3.3. U.K.
8.3.4. ITALY
8.3.5. SPAIN
8.4. ASIA-PACIFIC
8.4.1. JAPAN
8.4.2. CHINA
8.4.3. INDIA
8.5. SOUTH AMERICA
8.5.1. BRAZIL
8.6. MIDDLE EAST AND AFRICA
8.6.1. UAE
8.6.2. SOUTH AFRICA
9. GLOBAL BIOMETRIC SEAT CAPABILITIES MARKET-COMPETITIVE LANDSCAPE
9.1. OVERVIEW
9.2. MARKET SHARE OF KEY PLAYERS IN THE BIOMETRIC SEAT CAPABILITIES MARKET
9.2.1. GLOBAL COMPANY MARKET SHARE
9.2.2. NORTH AMERICA COMPANY MARKET SHARE
9.2.3. EUROPE COMPANY MARKET SHARE
9.2.4. APAC COMPANY MARKET SHARE
9.3. COMPETITIVE SITUATIONS AND TRENDS
9.3.1. PRODUCT LAUNCHES AND DEVELOPMENTS
9.3.2. PARTNERSHIPS, COLLABORATIONS, AND AGREEMENTS
9.3.3. MERGERS & ACQUISITIONS
9.3.4. EXPANSIONS
10. COMPANY PROFILES
10.1. ZF FRIEDRICHSHAFEN
10.1.1. BUSINESS OVERVIEW
10.1.2. COMPANY SNAPSHOT
10.1.3. COMPANY MARKET SHARE ANALYSIS
10.1.4. COMPANY PRODUCT PORTFOLIO
10.1.5. RECENT DEVELOPMENTS
10.1.6. SWOT ANALYSIS
10.2. PANASONIC CORPORATION
10.2.1. BUSINESS OVERVIEW
10.2.2. COMPANY SNAPSHOT
10.2.3. COMPANY MARKET SHARE ANALYSIS
10.2.4. COMPANY PRODUCT PORTFOLIO
10.2.5. RECENT DEVELOPMENTS
10.2.6. SWOT ANALYSIS
10.3. ROBERT BOSCH GMBH
10.3.1. BUSINESS OVERVIEW
10.3.2. COMPANY SNAPSHOT
10.3.3. COMPANY MARKET SHARE ANALYSIS
10.3.4. COMPANY PRODUCT PORTFOLIO
10.3.5. RECENT DEVELOPMENTS
10.3.6. SWOT ANALYSIS
10.4. FAURECIA
10.4.1. BUSINESS OVERVIEW
10.4.2. COMPANY SNAPSHOT
10.4.3. COMPANY MARKET SHARE ANALYSIS
10.4.4. COMPANY PRODUCT PORTFOLIO
10.4.5. RECENT DEVELOPMENTS
10.4.6. SWOT ANALYSIS
10.5. DENSO CORPORATION
10.5.1. BUSINESS OVERVIEW
10.5.2. COMPANY SNAPSHOT
10.5.3. COMPANY MARKET SHARE ANALYSIS
10.5.4. COMPANY PRODUCT PORTFOLIO
10.5.5. RECENT DEVELOPMENTS
10.5.6. SWOT ANALYSIS
10.6. VALEO
10.6.1. BUSINESS OVERVIEW
10.6.2. COMPANY SNAPSHOT
10.6.3. COMPANY MARKET SHARE ANALYSIS
10.6.4. COMPANY PRODUCT PORTFOLIO
10.6.5. RECENT DEVELOPMENTS
10.6.6. SWOT ANALYSIS
10.7. HITACHI LTD.
10.7.1. BUSINESS OVERVIEW
10.7.2. COMPANY SNAPSHOT
10.7.3. COMPANY MARKET SHARE ANALYSIS
10.7.4. COMPANY PRODUCT PORTFOLIO
10.7.5. RECENT DEVELOPMENTS
10.7.6. SWOT ANALYSIS
10.8. CONTINENTAL AG
10.8.1. BUSINESS OVERVIEW
10.8.2. COMPANY SNAPSHOT
10.8.3. COMPANY MARKET SHARE ANALYSIS
10.8.4. COMPANY PRODUCT PORTFOLIO
10.8.5. RECENT DEVELOPMENTS
10.8.6. SWOT ANALYSIS
10.9. SYNAPTICS INC.
10.9.1. BUSINESS OVERVIEW
10.9.2. COMPANY SNAPSHOT
10.9.3. COMPANY MARKET SHARE ANALYSIS
10.9.4. COMPANY PRODUCT PORTFOLIO
10.9.5. RECENT DEVELOPMENTS
10.9.6. SWOT ANALYSIS
10.10. FORD MOTOR COMPANY
10.10.1. BUSINESS OVERVIEW
10.10.2. COMPANY SNAPSHOT
10.10.3. COMPANY MARKET SHARE ANALYSIS
10.10.4. COMPANY PRODUCT PORTFOLIO
10.10.5. RECENT DEVELOPMENTS
10.10.6. SWOT ANALYSIS
10.11. FUJITSU
10.11.1. BUSINESS OVERVIEW
10.11.2. COMPANY SNAPSHOT
10.11.3. COMPANY MARKET SHARE ANALYSIS
10.11.4. COMPANY PRODUCT PORTFOLIO
10.11.5. RECENT DEVELOPMENTS
10.11.6. SWOT ANALYSIS
10.12. LEAR CORPORATION
10.12.1. BUSINESS OVERVIEW
10.12.2. COMPANY SNAPSHOT
10.12.3. COMPANY MARKET SHARE ANALYSIS
10.12.4. COMPANY PRODUCT PORTFOLIO
10.12.5. RECENT DEVELOPMENTS
10.12.6. SWOT ANALYSIS
10.13. MITSUBISHI ELECTRIC CORPORATION
10.13.1. BUSINESS OVERVIEW
10.13.2. COMPANY SNAPSHOT
10.13.3. COMPANY MARKET SHARE ANALYSIS
10.13.4. COMPANY PRODUCT PORTFOLIO
10.13.5. RECENT DEVELOPMENTS
10.13.6. SWOT ANALYSIS
List of Table
1. GLOBAL BIOMETRIC SEAT CAPABILITIES MARKET, BY COMPONENT, 2019-2032 (USD MILLION)
2. GLOBAL DISPLAY BIOMETRIC SEAT CAPABILITIES MARKET, BY REGION, 2019-2032 (USD MILLION)
3. GLOBAL SENSORS BIOMETRIC SEAT CAPABILITIES MARKET, BY REGION, 2019-2032 (USD MILLION)
4. GLOBAL CAMERA BIOMETRIC SEAT CAPABILITIES MARKET, BY REGION, 2019-2032 (USD MILLION)
5. GLOBAL OTHERS BIOMETRIC SEAT CAPABILITIES MARKET, BY REGION, 2019-2032 (USD MILLION)
6. GLOBAL BIOMETRIC SEAT CAPABILITIES MARKET, BY APPLICATION, 2019-2032 (USD MILLION)
7. GLOBAL PASSENGER CARS BIOMETRIC SEAT CAPABILITIES MARKET, BY REGION, 2019-2032 (USD MILLION)
8. GLOBAL COMMERCIAL VEHICLES BIOMETRIC SEAT CAPABILITIES MARKET, BY REGION, 2019-2032 (USD MILLION)
9. GLOBAL BIOMETRIC SEAT CAPABILITIES MARKET, BY REGION, 2019-2032 (USD MILLION)
10. NORTH AMERICA BIOMETRIC SEAT CAPABILITIES MARKET, BY COMPONENT, 2019-2032 (USD MILLION)
11. NORTH AMERICA BIOMETRIC SEAT CAPABILITIES MARKET, BY APPLICATION, 2019-2032 (USD MILLION)
12. U.S. BIOMETRIC SEAT CAPABILITIES MARKET, BY COMPONENT, 2019-2032 (USD MILLION)
13. U.S. BIOMETRIC SEAT CAPABILITIES MARKET, BY APPLICATION, 2019-2032 (USD MILLION)
14. CANADA BIOMETRIC SEAT CAPABILITIES MARKET, BY COMPONENT, 2019-2032 (USD MILLION)
15. CANADA BIOMETRIC SEAT CAPABILITIES MARKET, BY APPLICATION, 2019-2032 (USD MILLION)
16. MEXICO BIOMETRIC SEAT CAPABILITIES MARKET, BY COMPONENT, 2019-2032 (USD MILLION)
17. MEXICO BIOMETRIC SEAT CAPABILITIES MARKET, BY APPLICATION, 2019-2032 (USD MILLION)
18. EUROPE BIOMETRIC SEAT CAPABILITIES MARKET, BY COMPONENT, 2019-2032 (USD MILLION)
19. EUROPE BIOMETRIC SEAT CAPABILITIES MARKET, BY APPLICATION, 2019-2032 (USD MILLION)
20. GERMANY BIOMETRIC SEAT CAPABILITIES MARKET, BY COMPONENT, 2019-2032 (USD MILLION)
21. GERMANY BIOMETRIC SEAT CAPABILITIES MARKET, BY APPLICATION, 2019-2032 (USD MILLION)
22. FRANCE BIOMETRIC SEAT CAPABILITIES MARKET, BY COMPONENT, 2019-2032 (USD MILLION)
23. FRANCE BIOMETRIC SEAT CAPABILITIES MARKET, BY APPLICATION, 2019-2032 (USD MILLION)
24. U.K. BIOMETRIC SEAT CAPABILITIES MARKET, BY COMPONENT, 2019-2032 (USD MILLION)
25. U.K. BIOMETRIC SEAT CAPABILITIES MARKET, BY APPLICATION, 2019-2032 (USD MILLION)
26. ITALY BIOMETRIC SEAT CAPABILITIES MARKET, BY COMPONENT, 2019-2032 (USD MILLION)
27. ITALY BIOMETRIC SEAT CAPABILITIES MARKET, BY APPLICATION, 2019-2032 (USD MILLION)
28. SPAIN BIOMETRIC SEAT CAPABILITIES MARKET, BY COMPONENT, 2019-2032 (USD MILLION)
29. SPAIN BIOMETRIC SEAT CAPABILITIES MARKET, BY APPLICATION, 2019-2032 (USD MILLION)
30. ASIA PACIFIC BIOMETRIC SEAT CAPABILITIES MARKET, BY COMPONENT, 2019-2032 (USD MILLION)
31. ASIA PACIFIC BIOMETRIC SEAT CAPABILITIES MARKET, BY APPLICATION, 2019-2032 (USD MILLION)
32. JAPAN BIOMETRIC SEAT CAPABILITIES MARKET, BY COMPONENT, 2019-2032 (USD MILLION)
33. JAPAN BIOMETRIC SEAT CAPABILITIES MARKET, BY APPLICATION, 2019-2032 (USD MILLION)
34. CHINA BIOMETRIC SEAT CAPABILITIES MARKET, BY COMPONENT, 2019-2032 (USD MILLION)
35. CHINA BIOMETRIC SEAT CAPABILITIES MARKET, BY APPLICATION, 2019-2032 (USD MILLION)
36. INDIA BIOMETRIC SEAT CAPABILITIES MARKET, BY COMPONENT, 2019-2032 (USD MILLION)
37. INDIA BIOMETRIC SEAT CAPABILITIES MARKET, BY APPLICATION, 2019-2032 (USD MILLION)
38. SOUTH AMERICA BIOMETRIC SEAT CAPABILITIES MARKET, BY COMPONENT, 2019-2032 (USD MILLION)
39. SOUTH AMERICA BIOMETRIC SEAT CAPABILITIES MARKET, BY APPLICATION, 2019-2032 (USD MILLION)
40. BRAZIL BIOMETRIC SEAT CAPABILITIES MARKET, BY COMPONENT, 2019-2032 (USD MILLION)
41. BRAZIL BIOMETRIC SEAT CAPABILITIES MARKET, BY APPLICATION, 2019-2032 (USD MILLION)
42. MIDDLE EAST AND AFRICA BIOMETRIC SEAT CAPABILITIES MARKET, BY COMPONENT, 2019-2032 (USD MILLION)
43. MIDDLE EAST AND AFRICA BIOMETRIC SEAT CAPABILITIES MARKET, BY APPLICATION, 2019-2032 (USD MILLION)
44. UAE BIOMETRIC SEAT CAPABILITIES MARKET, BY COMPONENT, 2019-2032 (USD MILLION)
45. UAE BIOMETRIC SEAT CAPABILITIES MARKET, BY APPLICATION, 2019-2032 (USD MILLION)
46. SOUTH AFRICA BIOMETRIC SEAT CAPABILITIES MARKET, BY COMPONENT, 2019-2032 (USD MILLION)
47. SOUTH AFRICA BIOMETRIC SEAT CAPABILITIES MARKET, BY APPLICATION, 2019-2032 (USD MILLION)
List of Figures
1. GLOBAL BIOMETRIC SEAT CAPABILITIES MARKET SEGMENTATION
2. BIOMETRIC SEAT CAPABILITIES MARKET: RESEARCH METHODOLOGY
3. MARKET SIZE ESTIMATION METHODOLOGY: BOTTOM-UP APPROACH
4. MARKET SIZE ESTIMATION METHODOLOGY: TOP-DOWN APPROACH
5. DATA TRIANGULATION
6. PORTER’S FIVE FORCES ANALYSIS
7. VALUE CHAIN ANALYSIS
8. GLOBAL BIOMETRIC SEAT CAPABILITIES MARKET ATTRACTIVENESS ANALYSIS BY COMPONENT
9. GLOBAL BIOMETRIC SEAT CAPABILITIES MARKET ATTRACTIVENESS ANALYSIS BY APPLICATION
10. GLOBAL BIOMETRIC SEAT CAPABILITIES MARKET ATTRACTIVENESS ANALYSIS BY REGION
11. GLOBAL BIOMETRIC SEAT CAPABILITIES MARKET: DYNAMICS
12. GLOBAL BIOMETRIC SEAT CAPABILITIES MARKET SHARE BY COMPONENT (2022 & 2032)
13. GLOBAL BIOMETRIC SEAT CAPABILITIES MARKET SHARE BY APPLICATION (2022 & 2032)
14. GLOBAL BIOMETRIC SEAT CAPABILITIES MARKET SHARE BY REGIONS (2022 & 2032)
15. GLOBAL BIOMETRIC SEAT CAPABILITIES MARKET SHARE BY COMPANY (2022)
This study forecasts revenue at global, regional, and country levels from 2019 to 2032. The Brainy Insights has segmented the global biometric seat capabilities market based on below mentioned segments:
Global Biometric Seat Capabilities Market by Component:
Global Biometric Seat Capabilities Market by Application:
Global Biometric seat capabilities Market by Region:
Research has its special purpose to undertake marketing efficiently. In this competitive scenario, businesses need information across all industry verticals; the information about customer wants, market demand, competition, industry trends, distribution channels etc. This information needs to be updated regularly because businesses operate in a dynamic environment. Our organization, The Brainy Insights incorporates scientific and systematic research procedures in order to get proper market insights and industry analysis for overall business success. The analysis consists of studying the market from a miniscule level wherein we implement statistical tools which helps us in examining the data with accuracy and precision.
Our research reports feature both; quantitative and qualitative aspects for any market. Qualitative information for any market research process are fundamental because they reveal the customer needs and wants, usage and consumption for any product/service related to a specific industry. This in turn aids the marketers/investors in knowing certain perceptions of the customers. Qualitative research can enlighten about the different product concepts and designs along with unique service offering that in turn, helps define marketing problems and generate opportunities. On the other hand, quantitative research engages with the data collection process through interviews, e-mail interactions, surveys and pilot studies. Quantitative aspects for the market research are useful to validate the hypotheses generated during qualitative research method, explore empirical patterns in the data with the help of statistical tools, and finally make the market estimations.
The Brainy Insights offers comprehensive research and analysis, based on a wide assortment of factual insights gained through interviews with CXOs and global experts and secondary data from reliable sources. Our analysts and industry specialist assume vital roles in building up statistical tools and analysis models, which are used to analyse the data and arrive at accurate insights with exceedingly informative research discoveries. The data provided by our organization have proven precious to a diverse range of companies, facilitating them to address issues such as determining which products/services are the most appealing, whether or not customers use the product in the manner anticipated, the purchasing intentions of the market and many others.
Our research methodology encompasses an idyllic combination of primary and secondary initiatives. Key phases involved in this process are listed below:

The phase involves the gathering and collecting of market data and its related information with the help of different sources & research procedures.

The data procurement stage involves in data gathering and collecting through various data sources.
This stage involves in extensive research. These data sources includes:
Purchased Database: Purchased databases play a crucial role in estimating the market sizes irrespective of the domain. Our purchased database includes:
Primary Research: The Brainy Insights interacts with leading companies and experts of the concerned domain to develop the analyst team’s market understanding and expertise. It improves and substantiates every single data presented in the market reports. Primary research mainly involves in telephonic interviews, E-mail interactions and face-to-face interviews with the raw material providers, manufacturers/producers, distributors, & independent consultants. The interviews that we conduct provides valuable data on market size and industry growth trends prevailing in the market. Our organization also conducts surveys with the various industry experts in order to gain overall insights of the industry/market. For instance, in healthcare industry we conduct surveys with the pharmacists, doctors, surgeons and nurses in order to gain insights and key information of a medical product/device/equipment which the customers are going to usage. Surveys are conducted in the form of questionnaire designed by our own analyst team. Surveys plays an important role in primary research because surveys helps us to identify the key target audiences of the market. Additionally, surveys helps to identify the key target audience engaged with the market. Our survey team conducts the survey by targeting the key audience, thus gaining insights from them. Based on the perspectives of the customers, this information is utilized to formulate market strategies. Moreover, market surveys helps us to understand the current competitive situation of the industry. To be precise, our survey process typically involve with the 360 analysis of the market. This analytical process begins by identifying the prospective customers for a product or service related to the market/industry to obtain data on how a product/service could fit into customers’ lives.

Secondary Research: The secondary data sources includes information published by the on-profit organizations such as World bank, WHO, company fillings, investor presentations, annual reports, national government documents, statistical databases, blogs, articles, white papers and others. From the annual report, we analyse a company’s revenue to understand the key segment and market share of that organization in a particular region. We analyse the company websites and adopt the product mapping technique which is important for deriving the segment revenue. In the product mapping method, we select and categorize the products offered by the companies catering to domain specific market, deduce the product revenue for each of the companies so as to get overall estimation of the market size. We also source data and analyses trends based on information received from supply side and demand side intermediaries in the value chain. The supply side denotes the data gathered from supplier, distributor, wholesaler and the demand side illustrates the data gathered from the end customers for respective market domain.

The supply side for a domain specific market is analysed by:
The demand side for the market is estimated through:
In-house Library: Apart from these third-party sources, we have our in-house library of qualitative and quantitative information. Our in-house database includes market data for various industry and domains. These data are updated on regular basis as per the changing market scenario. Our library includes, historic databases, internal audit reports and archives.
Sometimes there are instances where there is no metadata or raw data available for any domain specific market. For those cases, we use our expertise to forecast and estimate the market size in order to generate comprehensive data sets. Our analyst team adopt a robust research technique in order to produce the estimates:
Data Synthesis: This stage involves the analysis & mapping of all the information obtained from the previous step. It also involves in scrutinizing the data for any discrepancy observed while data gathering related to the market. The data is collected with consideration to the heterogeneity of sources. Robust scientific techniques are in place for synthesizing disparate data sets and provide the essential contextual information that can orient market strategies. The Brainy Insights has extensive experience in data synthesis where the data passes through various stages:


Market Deduction & Formulation: The final stage comprises of assigning data points at appropriate market spaces so as to deduce feasible conclusions. Analyst perspective & subject matter expert based holistic form of market sizing coupled with industry analysis also plays a crucial role in this stage.
This stage involves in finalization of the market size and numbers that we have collected from data integration step. With data interpolation, it is made sure that there is no gap in the market data. Successful trend analysis is done by our analysts using extrapolation techniques, which provide the best possible forecasts for the market.
Data Validation & Market Feedback: Validation is the most important step in the process. Validation & re-validation via an intricately designed process helps us finalize data-points to be used for final calculations.

The Brainy Insights interacts with leading companies and experts of the concerned domain to develop the analyst team’s market understanding and expertise. It improves and substantiates every single data presented in the market reports. The data validation interview and discussion panels are typically composed of the most experienced industry members. The participants include, however, are not limited to:
Moreover, we always validate our data and findings through primary respondents from all the major regions we are working on.


Free Customization
Fortune 500 Clients
Free Yearly Update On Purchase Of Multi/Corporate License
Companies Served Till Date