- +1-315-215-1633
- sales@thebrainyinsights.com

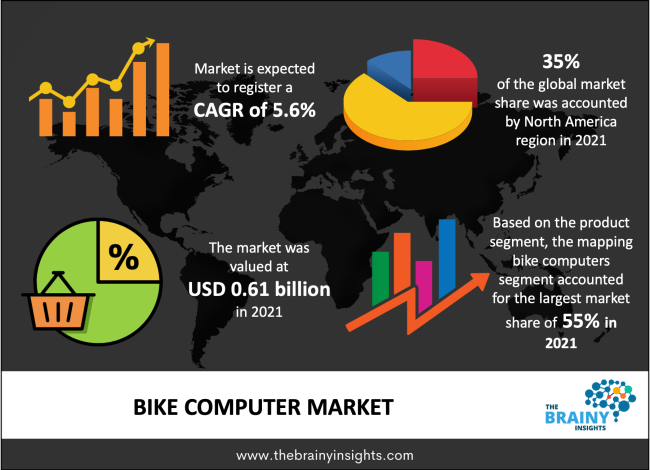
The Bike Computer market was estimated at around 0.61 billion in 2021, growing at a CAGR of nearly 5.6% during 2022-2030. The market is projected to reach approximately USD 1.9 billion by 2030.
A bike computer is a directional device that can be fitted to the handlebars of a bike or bicycle. This bike computer utilizes GPS to gather satellite signals, enabling users to monitor their rides and track their performance more effectively. Additionally, it has the benefits of enabling the development of new routes as well as the capacity to follow pre-planned routes for real-time advancement. GPS cycle computers track positions and accurately calculate distance, speed, and time without the use of cables or magnets. They may record routes and upload them to your ride monitoring service so that you can analyses your performance for fun and training. Significant improvements have been made to this wireless bike computer.
Get an overview of this study by requesting a free sample
Bike Computer demand has decreased significantly as a result of COVID-19 due to supply chain interruptions and nationwide lockdowns. The hardest hit industries during the pandemic were the automotive and construction sectors, which had an impact on the industry. China's industrial sector, on the other hand, has had strong demand growth as a result of the continuation of production activities after the lockdowns.
The segment held by utilities is primarily propelled by expanding financial incentives and regulatory assistance from governments around the world. The COVID-19 pandemic has the biggest impact on the currently owned by utilities COVID-19 Impact on Bike Computers. Due to supply chain challenges and restricted access to sites as a result of the COVID-19 epidemic, the majority of projects in China, the US, Germany, and South Korea are behind schedule. The impact of the COVID-19 pandemic in China, Japan, and India is expected to have a significant impact on Asia-Pacific. The enormous hub of this deadly illness is China. When it comes to the chemical sector, China is a significant nation.
Increasing Health Consciousness to accelerate the market’s growth
The bike computer market is expanding as a result of rising health consciousness in society, recent developments in smart wearables, and consumer awareness of these products. People's heightened awareness is motivating industry operators to offer clients modern, cutting-edge goods.
Rising demand and rising use of smart cycling gear:
A significant driver propelling the bike computers market over the projected period of 2022–2027 is the rising demand and rising adoption of smart cycling gear. The need for inexpensive, user-friendly bike computers with GPS capabilities is steadily rising. One of the elements affecting the growth of the cycling industry is the increasing popularity of cycling sports events and contests among the public. High demand has been reduced by the shift toward analogue GPS bicycle computers, and market expansion has also been facilitated by rising acceptance of shared commuter bicycles as well as rising engagement in cycling competitions and sports.
The Bike Computer Market is divided into wired and wireless, based on Product Type. The wired Bike Computers use satellite signals to navigate and determine their exact location in any conditions. In addition to displaying the data, the Mapping computers also produce the images. It is better to use bike computers for mapping. The market share of mapping bike computers is higher than that of non-mapping computers. In 2022, the Mapping segment will be worth around 320 Mn. With a CAGR of 5%, the mapping market is anticipated to reach 500 million people and holds a larger market share of approximately 60%. During the projected period, it will be crucial to see growth in the market share of cycle computers in the non-mapping sector. The Bike Computer Market is divided into three categories: Sports, Athletics, and Fitness and Commuting. These are the market's two main bike computers applications. With a market share of more than 53%, Commuting and Fitness have the largest percentage.
Throughout the projection period, Asia-Pacific is expected to remain one of the most alluring markets, and this region accounts for the majority revenue share in the market. With a 32% market share in 2021, the North American area will rule the industry. Through the projection period, the North American area is anticipated to experience considerable growth at a CAGR of 4.5%. The two biggest markets in North America are the US and Canada. Due to growing disposable wealth and a significant population of people interested in outdoor sporting activities, North America is currently dominating the GPS cycle computer industry. For instance, the number of e-bikes sold in the United States between January and November 2021 was about 368,000, up from the 273,000 units sold during the entire year of 2020. Businesses in the industry in question across North America are anticipated to benefit greatly from such increases in sales of conventional bikes and e-bikes.
The global Bike Computer market is segmented as follows:
By Product
By Application
By Region/Geography
| Attribute | Description |
|---|---|
| Base Year | 2021 |
| Forecast period | 2022-2030 |
| Report Coverage | Revenue estimation and forecast, company profile, competitive landscape, growth factors, and recent trends |
| Regional scope | North America, Europe, Asia Pacific, Middle East & Africa, and Latin America |
| Market Size(unit) | USD Billion |
| CAGR (2022 to 2030) | 5.6% |
| Segments Covered |
By Product |
1. Introduction
1.1. Objectives of the Study
1.2. Market Definition
1.3. Research Scope
2. Research Methodology and Assumptions
3. Executive Summary
4. Premium Insights
4.1. Porter’s Five Forces Analysis
4.2. Value Chain Analysis
4.3. Top Investment Pockets
4.3.1. Market Attractiveness Analysis By Product
4.3.2. Market Attractiveness Analysis By Application
4.4. Industry Trends
5. Market Dynamics
5.1. Market Evaluation
5.2. Drivers
5.2.1. Increasing Health Consciousness to accelerate the market’s growth
5.2.2. Rising demand and rising use of smart cycling gear
5.3. Restrains
5.3.1. Lack of awareness in rural areas
5.4. Opportunities
5.4.1. Growing market
6. Global Bike Computer Market Analysis and Forecast, By Product
6.1. Segment Overview
6.2. Wired
6.3. Wiredless
7. Global Bike Computer Market Analysis and Forecast, By Application
7.1. Segment Overview
7.2. Commuting & Fitness
7.3. Athletes & Sports
8. Global Bike Computer Market Analysis and Forecast, By Regional Analysis
8.1. Segment Overview
8.2. North America
8.2.1. U.S.
8.2.2. Canada
8.2.3. Mexico
8.3. Europe
8.3.1. Germany
8.3.2. France
8.3.3. U.K.
8.3.4. Italy
8.3.5. Spain
8.3.6. Rest of Europe
8.4. Asia-Pacific
8.4.1. Japan
8.4.2. China
8.4.3. India
8.4.4. Australia
8.4.5. South Korea
8.4.6. Rest of Asia-Pacific
8.5. South America
8.5.1. Brazil
8.5.2. Argentina
8.5.3. Rest of South America
8.6. Middle East and Africa
8.6.1. UAE
8.6.2. South Africa
8.6.3. Egypt
8.6.4. Kuwait
8.6.5. Saudi Arabia
8.6.6. Rest of Middle East & Africa
9. Global Bike Computer Market-Competitive Landscape
9.1. Overview
9.2. Market Share of Key Players in the Bike Computer market
9.2.1. Global Company Market Share
9.2.2. North America Company Market Share
9.2.3. Europe Company Market Share
9.2.4. APAC Company Market Share
9.3. Competitive Situations and Trends
9.3.1. Product Launches and Developments
9.3.2. Partnerships, Collaborations, and Agreements
9.3.3. Mergers & Acquisitions
9.3.4. Expansions
10. Company Profiles
10.1. SIGMA-ELEKTRO EmbH
10.1.1. Business Overview
10.1.2. Company Snapshot
10.1.3. Company Market Share Analysis
10.1.4. Company Application Portfolio
10.1.5. Recent Developments
10.1.6. SWOT Analysis
10.2. BBB Cycling
10.2.1. Business Overview
10.2.2. Company Snapshot
10.2.3. Company Market Share Analysis
10.2.4. Company Application Portfolio
10.2.5. Recent Developments
10.2.6. SWOT Analysis
10.3. Cycle Parts Gmbh
10.3.1. Business Overview
10.3.2. Company Snapshot
10.3.3. Company Market Share Analysis
10.3.4. Company Application Portfolio
10.3.5. Recent Developments
10.3.6. SWOT Analysis
10.4. Bryton Inc.
10.4.1. Business Overview
10.4.2. Company Snapshot
10.4.3. Company Market Share Analysis
10.4.4. Company Application Portfolio
10.4.5. Recent Developments
10.4.6. SWOT Analysis
10.5. BION Inc.
10.5.1. Business Overview
10.5.2. Company Snapshot
10.5.3. Company Market Share Analysis
10.5.4. Company Application Portfolio
10.5.5. Recent Developments
10.5.6. SWOT Analysis
10.6. XOSS
10.6.1. Business Overview
10.6.2. Company Snapshot
10.6.3. Company Market Share Analysis
10.6.4. Company Application Portfolio
10.6.5. Recent Developments
10.6.6. SWOT Analysis
10.7. Cambria Bike
10.7.1. Business Overview
10.7.2. Company Snapshot
10.7.3. Company Market Share Analysis
10.7.4. Company Application Portfolio
10.7.5. Recent Developments
10.7.6. SWOT Analysis
10.8. Evans Cycle
10.8.1. Business Overview
10.8.2. Company Snapshot
10.8.3. Company Market Share Analysis
10.8.4. Company Application Portfolio
10.8.5. Recent Developments
10.8.6. SWOT Analysis
10.9. Wahoo Fitness
10.9.1. Business Overview
10.9.2. Company Snapshot
10.9.3. Company Market Share Analysis
10.9.4. Company Application Portfolio
10.9.5. Recent Developments
10.9.6. SWOT Analysis
10.10. Giant Bicycles
10.10.1. Business Overview
10.10.2. Company Snapshot
10.10.3. Company Market Share Analysis
10.10.4. Company Application Portfolio
10.10.5. Recent Developments
10.10.6. SWOT Analysis
List of Table
1. Global Bike Computer Market, By Product, 2022-2030(USD Billion)
2. Global Wired Bike Computer Market, By Region, 2022-2030(USD Billion)
3. Global Wiredless Bike Computer Market, By Region, 2022-2030(USD Billion)
4. Global Bike Computer Market, By Application, 2022-2030(USD Billion)
5. Global Commuting & Fitness Bike Computer Market, By Region, 2022-2030(USD Billion)
6. Global Athletes & Sports Bike Computer Market, By Region, 2022-2030(USD Billion)
7. Global Bike Computer Market, By Region, 2022-2030(USD Billion)
8. Global Bike Computer Market, By North America, 2022-2030(USD Billion)
9. North America Bike Computer Market, By Product, 2022-2030(USD Billion)
10. North America Bike Computer Market, By Application, 2022-2030(USD Billion)
11. U.S. Bike Computer Market, By Product, 2022-2030(USD Billion)
12. U.S. Bike Computer Market, By Application, 2022-2030(USD Billion)
13. Canada Bike Computer Market, By Product, 2022-2030(USD Billion)
14. Canada Bike Computer Market, By Application, 2022-2030(USD Billion)
15. Mexico Bike Computer Market, By Product, 2022-2030(USD Billion)
16. Mexico Bike Computer Market, By Application, 2022-2030(USD Billion)
17. Europe Bike Computer Market, By Product, 2022-2030(USD Billion)
18. Europe Bike Computer Market, By Application, 2022-2030(USD Billion)
19. Germany Bike Computer Market, By Product, 2022-2030(USD Billion)
20. Germany Bike Computer Market, By Application, 2022-2030(USD Billion)
21. France Bike Computer Market, By Product, 2022-2030(USD Billion)
22. France Bike Computer Market, By Application, 2022-2030(USD Billion)
23. U.K. Bike Computer Market, By Product, 2022-2030(USD Billion)
24. U.K. Bike Computer Market, By Application, 2022-2030(USD Billion)
25. Italy Bike Computer Market, By Product, 2022-2030(USD Billion)
26. Italy Bike Computer Market, By Application, 2022-2030(USD Billion)
27. Spain Bike Computer Market, By Product, 2022-2030(USD Billion)
28. Spain Bike Computer Market, By Application, 2022-2030(USD Billion)
29. Rest of Europe Bike Computer Market, By Product, 2022-2030(USD Billion)
30. Rest of Europe Bike Computer Market, By Application, 2022-2030(USD Billion)
31. Asia Pacific Bike Computer Market, By Product, 2022-2030(USD Billion)
32. Asia Pacific Bike Computer Market, By Application, 2022-2030(USD Billion)
33. Japan Bike Computer Market, By Product, 2022-2030(USD Billion)
34. Japan Bike Computer Market, By Application, 2022-2030(USD Billion)
35. China Bike Computer Market, By Product, 2022-2030(USD Billion)
36. China Bike Computer Market, By Application, 2022-2030(USD Billion)
37. India Bike Computer Market, By Product, 2022-2030(USD Billion)
38. India Bike Computer Market, By Application, 2022-2030(USD Billion)
39. Australia Bike Computer Market, By Product, 2022-2030(USD Billion)
40. Australia Bike Computer Market, By Application, 2022-2030(USD Billion)
41. South Korea Bike Computer Market, By Product, 2022-2030(USD Billion)
42. South Korea Bike Computer Market, By Application, 2022-2030(USD Billion)
43. Rest of Asia-Pacific Bike Computer Market, By Product, 2022-2030(USD Billion)
44. Rest of Asia-Pacific Bike Computer Market, By Application, 2022-2030(USD Billion)
45. South America Bike Computer Market, By Product, 2022-2030(USD Billion)
46. South America Bike Computer Market, By Application, 2022-2030(USD Billion)
47. Brazil Bike Computer Market, By Product, 2022-2030(USD Billion)
48. Brazil Bike Computer Market, By Application, 2022-2030(USD Billion)
49. Argentina Bike Computer Market, By Product, 2022-2030(USD Billion)
50. Argentina Bike Computer Market, By Application, 2022-2030(USD Billion)
51. Rest of Latin America Bike Computer Market, By Product, 2022-2030(USD Billion)
52. Rest of Latin America Bike Computer Market, By Application, 2022-2030(USD Billion)
53. Middle East and Africa Bike Computer Market, By Product, 2022-2030(USD Billion)
54. Middle East and Africa Bike Computer Market, By Application, 2022-2030(USD Billion)
55. UAE Bike Computer Market, By Product, 2022-2030(USD Billion)
56. UAE Bike Computer Market, By Application, 2022-2030(USD Billion)
57. South Africa Bike Computer Market, By Product, 2022-2030(USD Billion)
58. South Africa Bike Computer Market, By Application, 2022-2030(USD Billion)
59. Egypt Bike Computer Market, By Product, 2022-2030(USD Billion)
60. Egypt Bike Computer Market, By Application, 2022-2030(USD Billion)
61. Kuwait Bike Computer Market, By Product, 2022-2030(USD Billion)
62. Kuwait Bike Computer Market, By Application, 2022-2030(USD Billion)
63. Saudi Arabia Bike Computer Market, By Product, 2022-2030(USD Billion)
64. Saudi Arabia Bike Computer Market, By Application, 2022-2030(USD Billion)
65. Rest of Middle East Bike Computer Market, By Product, 2022-2030(USD Billion)
66. Rest of Middle East Bike Computer Market, By Application, 2022-2030(USD Billion)
List of Figures
1. Global Bike Computer Market Segmentation
2. Bike Computer Market: Research Methodology
3. Market Size Estimation Methodology: Bottom-Up Approach
4. Market Size Estimation Methodology: Top-Down Approach
5. Data Triangulation
6. Porter’s Five Forces Analysis
7. Value Chain Analysis
8. Global Bike Computer Market Attractiveness Analysis By Product
9. Global Bike Computer Market Attractiveness Analysis By Application
10. Global Bike Computer Market Attractiveness Analysis By Region
11. Global Bike Computer Market: Dynamics
12. Global Bike Computer Market Share By Product(2022 & 2030)
13. Global Bike Computer Market Share By Application(2022 & 2030)
14. Global Bike Computer Market Share by Regions (2022 & 2030)
15. Global Bike Computer Market Share by Company (2021)
By Product
By Application
By Region/Geography
Research has its special purpose to undertake marketing efficiently. In this competitive scenario, businesses need information across all industry verticals; the information about customer wants, market demand, competition, industry trends, distribution channels etc. This information needs to be updated regularly because businesses operate in a dynamic environment. Our organization, The Brainy Insights incorporates scientific and systematic research procedures in order to get proper market insights and industry analysis for overall business success. The analysis consists of studying the market from a miniscule level wherein we implement statistical tools which helps us in examining the data with accuracy and precision.
Our research reports feature both; quantitative and qualitative aspects for any market. Qualitative information for any market research process are fundamental because they reveal the customer needs and wants, usage and consumption for any product/service related to a specific industry. This in turn aids the marketers/investors in knowing certain perceptions of the customers. Qualitative research can enlighten about the different product concepts and designs along with unique service offering that in turn, helps define marketing problems and generate opportunities. On the other hand, quantitative research engages with the data collection process through interviews, e-mail interactions, surveys and pilot studies. Quantitative aspects for the market research are useful to validate the hypotheses generated during qualitative research method, explore empirical patterns in the data with the help of statistical tools, and finally make the market estimations.
The Brainy Insights offers comprehensive research and analysis, based on a wide assortment of factual insights gained through interviews with CXOs and global experts and secondary data from reliable sources. Our analysts and industry specialist assume vital roles in building up statistical tools and analysis models, which are used to analyse the data and arrive at accurate insights with exceedingly informative research discoveries. The data provided by our organization have proven precious to a diverse range of companies, facilitating them to address issues such as determining which products/services are the most appealing, whether or not customers use the product in the manner anticipated, the purchasing intentions of the market and many others.
Our research methodology encompasses an idyllic combination of primary and secondary initiatives. Key phases involved in this process are listed below:

The phase involves the gathering and collecting of market data and its related information with the help of different sources & research procedures.

The data procurement stage involves in data gathering and collecting through various data sources.
This stage involves in extensive research. These data sources includes:
Purchased Database: Purchased databases play a crucial role in estimating the market sizes irrespective of the domain. Our purchased database includes:
Primary Research: The Brainy Insights interacts with leading companies and experts of the concerned domain to develop the analyst team’s market understanding and expertise. It improves and substantiates every single data presented in the market reports. Primary research mainly involves in telephonic interviews, E-mail interactions and face-to-face interviews with the raw material providers, manufacturers/producers, distributors, & independent consultants. The interviews that we conduct provides valuable data on market size and industry growth trends prevailing in the market. Our organization also conducts surveys with the various industry experts in order to gain overall insights of the industry/market. For instance, in healthcare industry we conduct surveys with the pharmacists, doctors, surgeons and nurses in order to gain insights and key information of a medical product/device/equipment which the customers are going to usage. Surveys are conducted in the form of questionnaire designed by our own analyst team. Surveys plays an important role in primary research because surveys helps us to identify the key target audiences of the market. Additionally, surveys helps to identify the key target audience engaged with the market. Our survey team conducts the survey by targeting the key audience, thus gaining insights from them. Based on the perspectives of the customers, this information is utilized to formulate market strategies. Moreover, market surveys helps us to understand the current competitive situation of the industry. To be precise, our survey process typically involve with the 360 analysis of the market. This analytical process begins by identifying the prospective customers for a product or service related to the market/industry to obtain data on how a product/service could fit into customers’ lives.

Secondary Research: The secondary data sources includes information published by the on-profit organizations such as World bank, WHO, company fillings, investor presentations, annual reports, national government documents, statistical databases, blogs, articles, white papers and others. From the annual report, we analyse a company’s revenue to understand the key segment and market share of that organization in a particular region. We analyse the company websites and adopt the product mapping technique which is important for deriving the segment revenue. In the product mapping method, we select and categorize the products offered by the companies catering to domain specific market, deduce the product revenue for each of the companies so as to get overall estimation of the market size. We also source data and analyses trends based on information received from supply side and demand side intermediaries in the value chain. The supply side denotes the data gathered from supplier, distributor, wholesaler and the demand side illustrates the data gathered from the end customers for respective market domain.

The supply side for a domain specific market is analysed by:
The demand side for the market is estimated through:
In-house Library: Apart from these third-party sources, we have our in-house library of qualitative and quantitative information. Our in-house database includes market data for various industry and domains. These data are updated on regular basis as per the changing market scenario. Our library includes, historic databases, internal audit reports and archives.
Sometimes there are instances where there is no metadata or raw data available for any domain specific market. For those cases, we use our expertise to forecast and estimate the market size in order to generate comprehensive data sets. Our analyst team adopt a robust research technique in order to produce the estimates:
Data Synthesis: This stage involves the analysis & mapping of all the information obtained from the previous step. It also involves in scrutinizing the data for any discrepancy observed while data gathering related to the market. The data is collected with consideration to the heterogeneity of sources. Robust scientific techniques are in place for synthesizing disparate data sets and provide the essential contextual information that can orient market strategies. The Brainy Insights has extensive experience in data synthesis where the data passes through various stages:


Market Deduction & Formulation: The final stage comprises of assigning data points at appropriate market spaces so as to deduce feasible conclusions. Analyst perspective & subject matter expert based holistic form of market sizing coupled with industry analysis also plays a crucial role in this stage.
This stage involves in finalization of the market size and numbers that we have collected from data integration step. With data interpolation, it is made sure that there is no gap in the market data. Successful trend analysis is done by our analysts using extrapolation techniques, which provide the best possible forecasts for the market.
Data Validation & Market Feedback: Validation is the most important step in the process. Validation & re-validation via an intricately designed process helps us finalize data-points to be used for final calculations.

The Brainy Insights interacts with leading companies and experts of the concerned domain to develop the analyst team’s market understanding and expertise. It improves and substantiates every single data presented in the market reports. The data validation interview and discussion panels are typically composed of the most experienced industry members. The participants include, however, are not limited to:
Moreover, we always validate our data and findings through primary respondents from all the major regions we are working on.


Free Customization
Fortune 500 Clients
Free Yearly Update On Purchase Of Multi/Corporate License
Companies Served Till Date