- +1-315-215-1633
- sales@thebrainyinsights.com

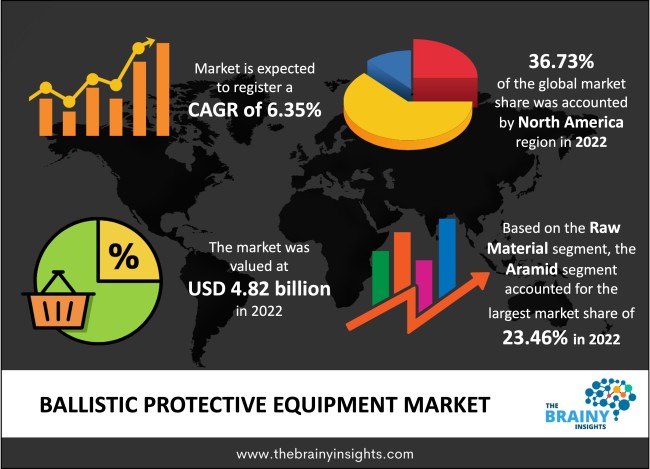
The global ballistic protective equipment market was valued at USD 4.82 Billion in 2022, which is anticipated to grow at a CAGR of 6.35% from 2023 to 2032. Market expansion is anticipated to be driven by rising concerns about enhancing military endurance. Increased competition among governments to show their strength, rising defence spending due to developing regional economies, and other factors are also anticipated to support market expansion. In addition, it is expected that throughout the projected period, rising technological innovation will continue to fuel consumer desire for cutting-edge gadgets and devices, driving market growth.
A type of personal armor known as ballistic protective equipment gives protection from projectile weapons, such as various kinds of bullets and shrapnel. The person wearing it is shielded against ballistic risks. Law enforcement professionals, soldiers, and citizens who face the possibility of ballistic injury can benefit from ballistic protection. One branch of mechanics known as ballistics investigates the launching, flight, behaviour, and impacts of projectiles, particularly bullets, unguided bombs, and rockets. Using objects moving with their momentum and the pull of gravity, mechanical science is used to create and accelerate projectiles to fulfil a particular function. Ballistic protective equipment is frequently used in the defence field to guard against explosive threats. The rise in terrorist attacks and the demand for ballistic protection among civilians and law enforcement officials worldwide contribute to the market's expansion. A significant factor anticipated to propel the growth of the global ballistic protective equipment market during the forecast period is the rising demand for self-protection tools and equipment among the defence and law enforcement sectors. Another factor that is anticipated to encourage market expansion is the growing need for self-defence tools during anti-terrorist attacks. Ballistic protective equipment offers robust protection due to its extensive product line and use of premium materials. Due to the advantages of ballistic protective equipment, rising concerns about personal safety among military personnel are also anticipated to promote market expansion. The ballistics helmet, for instance, shields troops' and people's heads from cranial impacts caused by explosion shock waves. Additionally, the development of raw materials such as ultra-high molecular weight polyethylene (UHMWPE) for ballistic products and technological advancements in ballistic protective equipment for the manufacture of lightweight, flexible, and thin protective gear is expected to encourage the growth of the global ballistic protective equipment market. However, the global market's growth is anticipated to be constrained by the high price and heavy weight of ballistic armor. The target market's expansion is also anticipated to be limited to some extent due to the high initial cost related to industrial infrastructure. Due to factors like instability, growing political unrest, and an increase in terrorist attacks, the market for ballistic protective equipment is expected to rise significantly throughout the forecast period. In addition, increased domestic conflict is predicted to fuel market expansion for ballistic protective equipment.
Get an overview of this study by requesting a free sample
Increased terrorist activity and rising usage of lightweight composite materials- Armed forces are required to purchase ballistic equipment to ensure the safety of military personnel due to border conflicts and increased terrorist attacks. Compared to metal ballistic protection armors, composite armors are lighter. Composite armor is stronger despite being more expensive than other ballistic protection armor types. Government legislation and policies have governed accountability for dangerous incidents and occurrences at sites. Due to this, it has become necessary to take the initiative to make personal protection equipment and clothing a norm and standard within the field.
High costs- Ballistic armor's heavyweight and expensive cost are two significant factors expected to hamper the expansion of the global market.
Technological development- Technological developments in ballistic protective equipment have made it possible to create flexible, lightweight, and thin protective gear. The global market for ballistic protective equipment is also predicted to rise due to recent developments in raw materials, such as ultra-high molecular weight polyethylene (UHMWPE), in ballistic products. As the market for lightweight equipment grows, manufacturers are forced to make their ballistic products lighter by using better raw materials and creating breathable armor. This is expected to open up new investment options for those involved in this field.
The infrastructure for manufacturing is related to a high primary rate- The ballistic protective equipment market is expected to be challenged by the high primary rate associated with manufacturing infrastructure.
The regions analyzed for the market include North America, Europe, South America, Asia Pacific, the Middle East, and Africa. North America emerged as the most significant global ballistic protective equipment market, with a 36.73% market revenue share in 2022. The demand for ballistic protective equipment is anticipated to increase throughout the forecast period due to continuous modernization initiatives by federal agencies in the defence and law enforcement sectors. The increasing concern about terrorist attacks is an important reason the American military is present in the Middle East, particularly Iraq and Syria. Another major force behind the growth of the ballistic protective equipment market is the United States' high defence spending.
North America Region Ballistic Protective Equipment Market Share in 2022 - 36.73%
www.thebrainyinsights.com
Check the geographical analysis of this market by requesting a free sample
The raw material segment is divided into composites, aramid, steel, UHMWPE, and others. The aramid segment dominated the market, with a market share of around 23.46% in 2022. The primary factor driving the high market penetration of aramid fibre and related blends is their ease of moulding in producing body armor and ballistic helmets.
The product segment is divided into soft armor, head protection, and hard armor. The soft armor segment dominated the market, with a market share of around 36.28% in 2022. Exoskeletons, integrated undersuit systems, and soft ballistic protection plates are three innovations that are expected to increase demand for soft armor and make it more versatile and quick for a variety of tasks.
The end-use segment is divided into law enforcement & security, defense, and commercial. The defense segment dominated the market, with a market share of around 35.75% in 2022. It is because of the high demand for solid body armor and ballistic helmets. The significant penetration of product demand in the defence industry results from many counterterrorism efforts that numerous nations have adopted over the past few years.
| Attribute | Description |
|---|---|
| Market Size | Revenue (USD Billion) |
| Market size value in 2022 | USD 4.82 Billion |
| Market size value in 2032 | USD 8.92 Billion |
| CAGR (2023 to 2032) | 6.35% |
| Historical data | 2019-2021 |
| Base Year | 2022 |
| Forecast | 2023-2032 |
| Region | The regions analyzed for the market are Asia Pacific, Europe, South America, North America, and Middle East & Africa. Furthermore, the regions are further analyzed at the country level. |
| Segments | Raw Material, Product, End-use |
As per The Brainy Insights, the size of the ballistic protective equipment market was valued at USD 4.82 Billion in 2022 & USD 8.92 Billion by 2032.
Global ballistic protective equipment market is growing at a CAGR of 6.35% during the forecast period 2023-2032.
North America region emerged as the largest market for the ballistic protective equipment.
Increased terrorist activity and rising usage of lightweight composite materials is a significant driving factors for the growth of the ballistic protective equipment market.
High cost is a significant restraining factor for the growth of the ballistic protective equipment market.
Technological development is a significant opportunity for the growth of the ballistic protective equipment market.
The infrastructure for manufacturing is related to a high primary rate is a significant challenge in the growth of the ballistic protective equipment market.
1. Introduction
1.1. Objective of the Study
1.2. Market Definition
1.3. Research Scope
1.4. Currency
1.5. Key Target Audience
2. Research Methodology and Assumptions
3. Executive Summary
4. Premium Insights
4.1. Porter’s Five Forces Analysis
4.2. Value Chain Analysis
4.3. Top Investment Pockets
4.3.1. Market Attractiveness Analysis By Raw Material
4.3.2. Market Attractiveness Analysis By Product
4.3.3. Market Attractiveness Analysis By End-use
4.3.4. Market Attractiveness Analysis By Region
4.4. Industry Trends
5. Market Dynamics
5.1. Market Evaluation
5.2. Drivers
5.2.1. Increased terrorist activity and rising usage of lightweight composite materials
5.3. Restraints
5.3.1. High costs
5.4. Opportunities
5.4.1. Technological development
5.5. Challenges
5.5.1. The infrastructure for manufacturing is related to a high primary rate
6. Global Ballistic Protective Equipment Market Analysis and Forecast, By Raw Material
6.1. Segment Overview
6.2. Composites
6.3. Aramid
6.4. Steel
6.5. UHMWPE
6.6. Others
7. Global Ballistic Protective Equipment Market Analysis and Forecast, By Product
7.1. Segment Overview
7.2. Soft Armor
7.3. Head Protection
7.4. Hard Armor
8. Global Ballistic Protective Equipment Market Analysis and Forecast, By End-use
8.1. Segment Overview
8.2. Law Enforcement & Security
8.3. Defense
8.4. Commercial
9. Global Ballistic Protective Equipment Market Analysis and Forecast, By Regional Analysis
9.1. Segment Overview
9.2. North America
9.2.1. U.S.
9.2.2. Canada
9.2.3. Mexico
9.3. Europe
9.3.1. Germany
9.3.2. France
9.3.3. U.K.
9.3.4. Italy
9.3.5. Spain
9.4. Asia-Pacific
9.4.1. Japan
9.4.2. China
9.4.3. India
9.5. South America
9.5.1. Brazil
9.6. Middle East and Africa
9.6.1. UAE
9.6.2. South Africa
10. Global Ballistic Protective Equipment Market-Competitive Landscape
10.1. Overview
10.2. Market Share of Key Players in the Ballistic Protective Equipment Market
10.2.1. Global Company Market Share
10.2.2. North America Company Market Share
10.2.3. Europe Company Market Share
10.2.4. APAC Company Market Share
10.3. Competitive Situations and Trends
10.3.1. Product Launches and Developments
10.3.2. Partnerships, Collaborations, and Agreements
10.3.3. Mergers & Acquisitions
10.3.4. Expansions
11. Company Profiles
11.1. Honeywell International, Inc.
11.1.1. Business Overview
11.1.2. Company Snapshot
11.1.3. Company Market Share Analysis
11.1.4. Company Product Portfolio
11.1.5. Recent Developments
11.1.6. SWOT Analysis
11.2. Rheinmetall AG
11.2.1. Business Overview
11.2.2. Company Snapshot
11.2.3. Company Market Share Analysis
11.2.4. Company Product Portfolio
11.2.5. Recent Developments
11.2.6. SWOT Analysis
11.3. Morgan Advanced Materials
11.3.1. Business Overview
11.3.2. Company Snapshot
11.3.3. Company Market Share Analysis
11.3.4. Company Product Portfolio
11.3.5. Recent Developments
11.3.6. SWOT Analysis
11.4. Craig International Ballistics
11.4.1. Business Overview
11.4.2. Company Snapshot
11.4.3. Company Market Share Analysis
11.4.4. Company Product Portfolio
11.4.5. Recent Developments
11.4.6. SWOT Analysis
11.5. Verseidag-Indutex GmbH
11.5.1. Business Overview
11.5.2. Company Snapshot
11.5.3. Company Market Share Analysis
11.5.4. Company Product Portfolio
11.5.5. Recent Developments
11.5.6. SWOT Analysis
11.6. Tactical Assault Gear (TAG)
11.6.1. Business Overview
11.6.2. Company Snapshot
11.6.3. Company Market Share Analysis
11.6.4. Company Product Portfolio
11.6.5. Recent Developments
11.6.6. SWOT Analysis
11.7. MKU Limited
11.7.1. Business Overview
11.7.2. Company Snapshot
11.7.3. Company Market Share Analysis
11.7.4. Company Product Portfolio
11.7.5. Recent Developments
11.7.6. SWOT Analysis
11.8. Mars Armor
11.8.1. Business Overview
11.8.2. Company Snapshot
11.8.3. Company Market Share Analysis
11.8.4. Company Product Portfolio
11.8.5. Recent Developments
11.8.6. SWOT Analysis
11.9. Vista Outdoor, Inc.
11.9.1. Business Overview
11.9.2. Company Snapshot
11.9.3. Company Market Share Analysis
11.9.4. Company Product Portfolio
11.9.5. Recent Developments
11.9.6. SWOT Analysis
11.10. Safariland, LLC
11.10.1. Business Overview
11.10.2. Company Snapshot
11.10.3. Company Market Share Analysis
11.10.4. Company Product Portfolio
11.10.5. Recent Developments
11.10.6. SWOT Analysis
11.11. Armor Wear
11.11.1. Business Overview
11.11.2. Company Snapshot
11.11.3. Company Market Share Analysis
11.11.4. Company Product Portfolio
11.11.5. Recent Developments
11.11.6. SWOT Analysis
11.12. Seyntex N.V.
11.12.1. Business Overview
11.12.2. Company Snapshot
11.12.3. Company Market Share Analysis
11.12.4. Company Product Portfolio
11.12.5. Recent Developments
11.12.6. SWOT Analysis
11.13. Point Blank Enterprise, Inc.
11.13.1. Business Overview
11.13.2. Company Snapshot
11.13.3. Company Market Share Analysis
11.13.4. Company Product Portfolio
11.13.5. Recent Developments
11.13.6. SWOT Analysis
11.14. Survitec Group Ltd.
11.14.1. Business Overview
11.14.2. Company Snapshot
11.14.3. Company Market Share Analysis
11.14.4. Company Product Portfolio
11.14.5. Recent Developments
11.14.6. SWOT Analysis
11.15. Hellweg International Pty. Ltd.
11.15.1. Business Overview
11.15.2. Company Snapshot
11.15.3. Company Market Share Analysis
11.15.4. Company Product Portfolio
11.15.5. Recent Developments
11.15.6. SWOT Analysis
11.16. Paul Boyé Technologies
11.16.1. Business Overview
11.16.2. Company Snapshot
11.16.3. Company Market Share Analysis
11.16.4. Company Product Portfolio
11.16.5. Recent Developments
11.16.6. SWOT Analysis
11.17. CQC Ltd.
11.17.1. Business Overview
11.17.2. Company Snapshot
11.17.3. Company Market Share Analysis
11.17.4. Company Product Portfolio
11.17.5. Recent Developments
11.17.6. SWOT Analysis
11.18. Tencate
11.18.1. Business Overview
11.18.2. Company Snapshot
11.18.3. Company Market Share Analysis
11.18.4. Company Product Portfolio
11.18.5. Recent Developments
11.18.6. SWOT Analysis
11.19. Safe Life Defense
11.19.1. Business Overview
11.19.2. Company Snapshot
11.19.3. Company Market Share Analysis
11.19.4. Company Product Portfolio
11.19.5. Recent Developments
11.19.6. SWOT Analysis
11.20. EnGarde
11.20.1. Business Overview
11.20.2. Company Snapshot
11.20.3. Company Market Share Analysis
11.20.4. Company Product Portfolio
11.20.5. Recent Developments
11.20.6. SWOT Analysis
11.21. ArmorSource LLC
11.21.1. Business Overview
11.21.2. Company Snapshot
11.21.3. Company Market Share Analysis
11.21.4. Company Product Portfolio
11.21.5. Recent Developments
11.21.6. SWOT Analysis
11.22. BAE Systems, Plc
11.22.1. Business Overview
11.22.2. Company Snapshot
11.22.3. Company Market Share Analysis
11.22.4. Company Product Portfolio
11.22.5. Recent Developments
11.22.6. SWOT Analysis
11.23. Mehler Vario System
11.23.1. Business Overview
11.23.2. Company Snapshot
11.23.3. Company Market Share Analysis
11.23.4. Company Product Portfolio
11.23.5. Recent Developments
11.23.6. SWOT Analysis
List of Table
1. Global Ballistic Protective Equipment Market, By Raw Material, 2019-2032 (USD Billion)
2. Global Composites, Ballistic Protective Equipment Market, By Region, 2019-2032 (USD Billion)
3. Global Aramid, Ballistic Protective Equipment Market, By Region, 2019-2032 (USD Billion)
4. Global Steel, Ballistic Protective Equipment Market, By Region, 2019-2032 (USD Billion)
5. Global UHMWPE, Ballistic Protective Equipment Market, By Region, 2019-2032 (USD Billion)
6. Global Others, Ballistic Protective Equipment Market, By Region, 2019-2032 (USD Billion)
7. Global Ballistic Protective Equipment Market, By Product, 2019-2032 (USD Billion)
8. Global Soft Armor, Ballistic Protective Equipment Market, By Region, 2019-2032 (USD Billion)
9. Global Head Protection, Ballistic Protective Equipment Market, By Region, 2019-2032 (USD Billion)
10. Global Hard Armor, Ballistic Protective Equipment Market, By Region, 2019-2032 (USD Billion)
11. Global Ballistic Protective Equipment Market, By End-use, 2019-2032 (USD Billion)
12. Global Law Enforcement & Security, Ballistic Protective Equipment Market, By Region, 2019-2032 (USD Billion)
13. Global Defense, Ballistic Protective Equipment Market, By Region, 2019-2032 (USD Billion)
14. Global Commercial, Ballistic Protective Equipment Market, By Region, 2019-2032 (USD Billion)
15. Global Ballistic Protective Equipment Market, By Region, 2019-2032 (USD Billion)
16. North America Ballistic Protective Equipment Market, By Raw Material, 2019-2032 (USD Billion)
17. North America Ballistic Protective Equipment Market, By Product, 2019-2032 (USD Billion)
18. North America Ballistic Protective Equipment Market, By End-use, 2019-2032 (USD Billion)
19. U.S. Ballistic Protective Equipment Market, By Raw Material, 2019-2032 (USD Billion)
20. U.S. Ballistic Protective Equipment Market, By Product, 2019-2032 (USD Billion)
21. U.S. Ballistic Protective Equipment Market, By End-use, 2019-2032 (USD Billion)
22. Canada Ballistic Protective Equipment Market, By Raw Material, 2019-2032 (USD Billion)
23. Canada Ballistic Protective Equipment Market, By Product, 2019-2032 (USD Billion)
24. Canada Ballistic Protective Equipment Market, By End-use, 2019-2032 (USD Billion)
25. Mexico Ballistic Protective Equipment Market, By Raw Material, 2019-2032 (USD Billion)
26. Mexico Ballistic Protective Equipment Market, By Product, 2019-2032 (USD Billion)
27. Mexico Ballistic Protective Equipment Market, By End-use, 2019-2032 (USD Billion)
28. Europe Ballistic Protective Equipment Market, By Raw Material, 2019-2032 (USD Billion)
29. Europe Ballistic Protective Equipment Market, By Product, 2019-2032 (USD Billion)
30. Europe Ballistic Protective Equipment Market, By End-use, 2019-2032 (USD Billion)
31. Germany Ballistic Protective Equipment Market, By Raw Material, 2019-2032 (USD Billion)
32. Germany Ballistic Protective Equipment Market, By Product, 2019-2032 (USD Billion)
33. Germany Ballistic Protective Equipment Market, By End-use, 2019-2032 (USD Billion)
34. France Ballistic Protective Equipment Market, By Raw Material, 2019-2032 (USD Billion)
35. France Ballistic Protective Equipment Market, By Product, 2019-2032 (USD Billion)
36. France Ballistic Protective Equipment Market, By End-use, 2019-2032 (USD Billion)
37. U.K. Ballistic Protective Equipment Market, By Raw Material, 2019-2032 (USD Billion)
38. U.K. Ballistic Protective Equipment Market, By Product, 2019-2032 (USD Billion)
39. U.K. Ballistic Protective Equipment Market, By End-use, 2019-2032 (USD Billion)
40. Italy Ballistic Protective Equipment Market, By Raw Material, 2019-2032 (USD Billion)
41. Italy Ballistic Protective Equipment Market, By Product, 2019-2032 (USD Billion)
42. Italy Ballistic Protective Equipment Market, By End-use, 2019-2032 (USD Billion)
43. Spain Ballistic Protective Equipment Market, By Raw Material, 2019-2032 (USD Billion)
44. Spain Ballistic Protective Equipment Market, By Product, 2019-2032 (USD Billion)
45. Spain Ballistic Protective Equipment Market, By End-use, 2019-2032 (USD Billion)
46. Asia Pacific Ballistic Protective Equipment Market, By Raw Material, 2019-2032 (USD Billion)
47. Asia Pacific Ballistic Protective Equipment Market, By Product, 2019-2032 (USD Billion)
48. Asia Pacific Ballistic Protective Equipment Market, By End-use, 2019-2032 (USD Billion)
49. Japan Ballistic Protective Equipment Market, By Raw Material, 2019-2032 (USD Billion)
50. Japan Ballistic Protective Equipment Market, By Product, 2019-2032 (USD Billion)
51. Japan Ballistic Protective Equipment Market, By End-use, 2019-2032 (USD Billion)
52. China Ballistic Protective Equipment Market, By Raw Material, 2019-2032 (USD Billion)
53. China Ballistic Protective Equipment Market, By Product, 2019-2032 (USD Billion)
54. China Ballistic Protective Equipment Market, By End-use, 2019-2032 (USD Billion)
55. India Ballistic Protective Equipment Market, By Raw Material, 2019-2032 (USD Billion)
56. India Ballistic Protective Equipment Market, By Product, 2019-2032 (USD Billion)
57. India Ballistic Protective Equipment Market, By End-use, 2019-2032 (USD Billion)
58. South America Ballistic Protective Equipment Market, By Raw Material, 2019-2032 (USD Billion)
59. South America Ballistic Protective Equipment Market, By Product, 2019-2032 (USD Billion)
60. South America Ballistic Protective Equipment Market, By End-use, 2019-2032 (USD Billion)
61. Brazil Ballistic Protective Equipment Market, By Raw Material, 2019-2032 (USD Billion)
62. Brazil Ballistic Protective Equipment Market, By Product, 2019-2032 (USD Billion)
63. Brazil Ballistic Protective Equipment Market, By End-use, 2019-2032 (USD Billion)
64. Middle East and Africa Ballistic Protective Equipment Market, By Raw Material, 2019-2032 (USD Billion)
65. Middle East and Africa Ballistic Protective Equipment Market, By Product, 2019-2032 (USD Billion)
66. Middle East and Africa Ballistic Protective Equipment Market, By End-use, 2019-2032 (USD Billion)
67. UAE Ballistic Protective Equipment Market, By Raw Material, 2019-2032 (USD Billion)
68. UAE Ballistic Protective Equipment Market, By Product, 2019-2032 (USD Billion)
69. UAE Ballistic Protective Equipment Market, By End-use, 2019-2032 (USD Billion)
70. South Africa Ballistic Protective Equipment Market, By Raw Material, 2019-2032 (USD Billion)
71. South Africa Ballistic Protective Equipment Market, By Product, 2019-2032 (USD Billion)
72. South Africa Ballistic Protective Equipment Market, By End-use, 2019-2032 (USD Billion)
List of Figures
1. Global Ballistic Protective Equipment Market Segmentation
2. Ballistic Protective Equipment Market: Research Methodology
3. Market Size Estimation Methodology: Bottom-Up Approach
4. Market Size Estimation Methodology: Top-Down Approach
5. Data Triangulation
6. Porter’s Five Forces Analysis
7. Value Chain Analysis
8. Global Ballistic Protective Equipment Market Attractiveness Analysis By Raw Material
9. Global Ballistic Protective Equipment Market Attractiveness Analysis By Product
10. Global Ballistic Protective Equipment Market Attractiveness Analysis By End-use
11. Global Ballistic Protective Equipment Market Attractiveness Analysis By Region
12. Global Ballistic Protective Equipment Market: Dynamics
13. Global Ballistic Protective Equipment Market Share by Raw Material (2023 & 2032)
14. Global Ballistic Protective Equipment Market Share by Product (2023 & 2032)
15. Global Ballistic Protective Equipment Market Share by End-use (2023 & 2032)
16. Global Ballistic Protective Equipment Market Share by Regions (2023 & 2032)
17. Global Ballistic Protective Equipment Market Share by Company (2022)
This study forecasts revenue at global, regional, and country levels from 2019 to 2032. The Brainy Insights has segmented the global ballistic protective equipment market based on below mentioned segments:
Global Ballistic Protective Equipment by Raw Material:
Global Ballistic Protective Equipment by Product:
Global Ballistic Protective Equipment by End-use:
Global Ballistic Protective Equipment by Region:
Research has its special purpose to undertake marketing efficiently. In this competitive scenario, businesses need information across all industry verticals; the information about customer wants, market demand, competition, industry trends, distribution channels etc. This information needs to be updated regularly because businesses operate in a dynamic environment. Our organization, The Brainy Insights incorporates scientific and systematic research procedures in order to get proper market insights and industry analysis for overall business success. The analysis consists of studying the market from a miniscule level wherein we implement statistical tools which helps us in examining the data with accuracy and precision.
Our research reports feature both; quantitative and qualitative aspects for any market. Qualitative information for any market research process are fundamental because they reveal the customer needs and wants, usage and consumption for any product/service related to a specific industry. This in turn aids the marketers/investors in knowing certain perceptions of the customers. Qualitative research can enlighten about the different product concepts and designs along with unique service offering that in turn, helps define marketing problems and generate opportunities. On the other hand, quantitative research engages with the data collection process through interviews, e-mail interactions, surveys and pilot studies. Quantitative aspects for the market research are useful to validate the hypotheses generated during qualitative research method, explore empirical patterns in the data with the help of statistical tools, and finally make the market estimations.
The Brainy Insights offers comprehensive research and analysis, based on a wide assortment of factual insights gained through interviews with CXOs and global experts and secondary data from reliable sources. Our analysts and industry specialist assume vital roles in building up statistical tools and analysis models, which are used to analyse the data and arrive at accurate insights with exceedingly informative research discoveries. The data provided by our organization have proven precious to a diverse range of companies, facilitating them to address issues such as determining which products/services are the most appealing, whether or not customers use the product in the manner anticipated, the purchasing intentions of the market and many others.
Our research methodology encompasses an idyllic combination of primary and secondary initiatives. Key phases involved in this process are listed below:

The phase involves the gathering and collecting of market data and its related information with the help of different sources & research procedures.

The data procurement stage involves in data gathering and collecting through various data sources.
This stage involves in extensive research. These data sources includes:
Purchased Database: Purchased databases play a crucial role in estimating the market sizes irrespective of the domain. Our purchased database includes:
Primary Research: The Brainy Insights interacts with leading companies and experts of the concerned domain to develop the analyst team’s market understanding and expertise. It improves and substantiates every single data presented in the market reports. Primary research mainly involves in telephonic interviews, E-mail interactions and face-to-face interviews with the raw material providers, manufacturers/producers, distributors, & independent consultants. The interviews that we conduct provides valuable data on market size and industry growth trends prevailing in the market. Our organization also conducts surveys with the various industry experts in order to gain overall insights of the industry/market. For instance, in healthcare industry we conduct surveys with the pharmacists, doctors, surgeons and nurses in order to gain insights and key information of a medical product/device/equipment which the customers are going to usage. Surveys are conducted in the form of questionnaire designed by our own analyst team. Surveys plays an important role in primary research because surveys helps us to identify the key target audiences of the market. Additionally, surveys helps to identify the key target audience engaged with the market. Our survey team conducts the survey by targeting the key audience, thus gaining insights from them. Based on the perspectives of the customers, this information is utilized to formulate market strategies. Moreover, market surveys helps us to understand the current competitive situation of the industry. To be precise, our survey process typically involve with the 360 analysis of the market. This analytical process begins by identifying the prospective customers for a product or service related to the market/industry to obtain data on how a product/service could fit into customers’ lives.

Secondary Research: The secondary data sources includes information published by the on-profit organizations such as World bank, WHO, company fillings, investor presentations, annual reports, national government documents, statistical databases, blogs, articles, white papers and others. From the annual report, we analyse a company’s revenue to understand the key segment and market share of that organization in a particular region. We analyse the company websites and adopt the product mapping technique which is important for deriving the segment revenue. In the product mapping method, we select and categorize the products offered by the companies catering to domain specific market, deduce the product revenue for each of the companies so as to get overall estimation of the market size. We also source data and analyses trends based on information received from supply side and demand side intermediaries in the value chain. The supply side denotes the data gathered from supplier, distributor, wholesaler and the demand side illustrates the data gathered from the end customers for respective market domain.

The supply side for a domain specific market is analysed by:
The demand side for the market is estimated through:
In-house Library: Apart from these third-party sources, we have our in-house library of qualitative and quantitative information. Our in-house database includes market data for various industry and domains. These data are updated on regular basis as per the changing market scenario. Our library includes, historic databases, internal audit reports and archives.
Sometimes there are instances where there is no metadata or raw data available for any domain specific market. For those cases, we use our expertise to forecast and estimate the market size in order to generate comprehensive data sets. Our analyst team adopt a robust research technique in order to produce the estimates:
Data Synthesis: This stage involves the analysis & mapping of all the information obtained from the previous step. It also involves in scrutinizing the data for any discrepancy observed while data gathering related to the market. The data is collected with consideration to the heterogeneity of sources. Robust scientific techniques are in place for synthesizing disparate data sets and provide the essential contextual information that can orient market strategies. The Brainy Insights has extensive experience in data synthesis where the data passes through various stages:


Market Deduction & Formulation: The final stage comprises of assigning data points at appropriate market spaces so as to deduce feasible conclusions. Analyst perspective & subject matter expert based holistic form of market sizing coupled with industry analysis also plays a crucial role in this stage.
This stage involves in finalization of the market size and numbers that we have collected from data integration step. With data interpolation, it is made sure that there is no gap in the market data. Successful trend analysis is done by our analysts using extrapolation techniques, which provide the best possible forecasts for the market.
Data Validation & Market Feedback: Validation is the most important step in the process. Validation & re-validation via an intricately designed process helps us finalize data-points to be used for final calculations.

The Brainy Insights interacts with leading companies and experts of the concerned domain to develop the analyst team’s market understanding and expertise. It improves and substantiates every single data presented in the market reports. The data validation interview and discussion panels are typically composed of the most experienced industry members. The participants include, however, are not limited to:
Moreover, we always validate our data and findings through primary respondents from all the major regions we are working on.


Free Customization
Fortune 500 Clients
Free Yearly Update On Purchase Of Multi/Corporate License
Companies Served Till Date