- +1-315-215-1633
- sales@thebrainyinsights.com

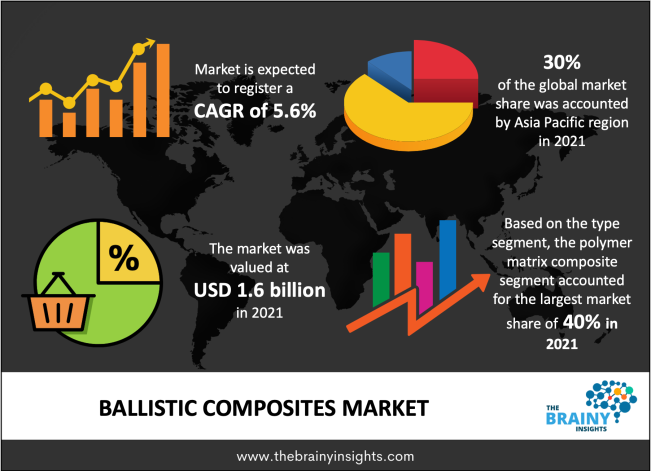
The ballistic composites market was estimated at around USD 1.6 billion in 2021, growing at a CAGR of nearly 5.6% during 2022-2030. The market is projected to reach approximately USD 2.6 billion by 2030.
High-performance fibers known as ballistic composites are able to withstand the shock and impact energy brought on by explosions. In order to increase strength and stiffness, they are composed of layered structural composites with polymer matrices reinforced with fibers made of glass, carbon, and para-aramid. Vests, helmets, shields, body armor for vehicles, and other armored items are frequently made from these composite materials as basic materials. They display a number of beneficial qualities, including durability, high thermal conductivity, and resistance to heat and corrosion. As a result, they have many uses in many different industries, including defense, automotive, aviation, and aerospace.
Get an overview of this study by requesting a free sample
The unprecedented global public health emergency known as COVID-19 has had an impact on almost every business, and the long-term effects are anticipated to have an impact on industry growth throughout the course of the projected period. The COVID-19 outbreak has made the defense industry face a number of difficulties. Supply chains and production facilities are impacted. Defense-related goods and services are less in demand. One of the most obvious consequences of the pandemic's impact on the military industry may be supply side shocks. The pandemic's first casualties are businesses with headquarters in areas where the virus has spread widely or those that depend on supply chains with hubs in these areas. The market growth of ballistic composites in 2020 will be directly impacted by COVID-19. However, it will continue to rise steadily in 2022–2030 after this year.
Escalating need for ballistic composites for personal defense to accelerate the market’s growth
The primary factor driving the growth of the ballistic composites market is the increasing demand for these materials in personal protection due to their light weight and high strength characteristics. Contrary to earlier wars, those in Iraq and Afghanistan are the result of significant investments made by private industries to counter the growing threats from around the world and satiate the military's thirst for lighter materials. With less overall body armor weight and improved comfort, soldiers are now better protected from emerging ballistic threats. Modern military vehicles are no longer only made of steel and are now lined with lightweight ballistic materials, extending their range between refueling stops and enhancing mobility. The lightweight ballistic composites used in commercial products, testing, and fiber production assist lighten the load of military vehicles, enhancing mobility. In the coming years, this aspect will fuel the market for ballistic composites.
Ballistic composites' increased R&D and mass production will also contribute to the market's future growth
With the aim of creating ever lighter-weight, higher-performing materials that can enhance soldiers' mobility, performance, and comfort, the U.S. Army Natick Soldier Research Center conducts a significant amount of research and development on ballistic composites in partnership with fiber and ceramics businesses, academic institutions, and other entities. The outer layers of the fabric stack are melted and fused together to create flat panels and molded pieces with excellent impact qualities in ballistic composite applications, which stack layers of fabric using just heat and pressure. Hard armor is made from this composite in combination with metals, ceramics, and other composites. This makes it possible to significantly reduce weight when compared to glass-filled composites and to do it at a lower cost than premium composites. In the coming years, this aspect will fuel the market for ballistic composites.
Ballistic Composites Market: Segmentation Analysis
The ballistic composites market is segmented into type, application, and end use. Based on type, the market for polymer matrix composite segment is estimated to lead the market during the forecast period. Polymer is a widely utilized substance because of attributes like low weight, high friction, and temperature resistance qualities. Body armor, helmets, and vests for protection all make use of polymer matrix composite. Due to their low cost and straightforward fabrication processes, polymer matrix composites are frequently used. The majority of automakers have conducted research into using natural fiber polymer composites in their products.
By application, the vehicle armor segment is anticipated to dominate the market during the forecast period. The need for military vehicles used in warships is rising due to rising global warfare, which is also projected to boost demand for vehicle armor throughout the projection period.
By end use, the defense segment is anticipated to dominant the ballistic composites market during the forecast period. The development and invention of technology can be primarily blamed for the rise. It is anticipated that technology advancements would enhance military capability, making it stronger overall. Now, various countries are focusing on creating their own defense mechanisms as well as those to trade with other forces.
Report Scope
| Attribute | Description |
|---|---|
| Base Year | 2021 |
| Forecast period | 2022-2030 |
| Report Coverage | Revenue estimation and forecast, company profile, competitive landscape, growth factors, and recent trends |
| CAGR | 5.6% |
| Regional scope | North America, Europe, Asia Pacific, Middle East & Africa, and Latin America |
| Market Size (unit) | USD Billion |
| Segments |
By Product |
Asia-Pacific is anticipated to be one of the most enticing markets during the projection period, accounting for the majority of the market's revenue share. With a growing understanding of the lives of deployed soldiers and vehicles, developing nations in the region are eventually concentrating on advanced combat solutions and new technology development. Although the current scenario is changing as a result of an increase in foreign direct investment for the expansion of South East Asia's economy, the economic dynamics of countries like China and India still account for the majority of the economic activity in APAC.
The global Ballistic composites market is segmented as follows:
By Type
By Application
By End use
By Region/Geography
1. Introduction
1.1. Objectives of the Study
1.2. Market Definition
1.3. Research Scope
2. Research Methodology and Assumptions
3. Executive Summary
4. Premium Insights
4.1. Porter’s Five Forces Analysis
4.2. Value Chain Analysis
4.3. Top Investment Pockets
4.3.1. Market Attractiveness Analysis By Type
4.3.2. Market Attractiveness Analysis By Application
4.3.3. Market Attractiveness Analysis By End Use
4.4. Industry Trends
5. Market Dynamics
5.1. Market Evaluation
5.2. Drivers
5.2.1. Escalating need for ballistic composites for personal defense to accelerate the market’s growth
5.2.2. Ballistic composites' increased R&D and mass production will also contribute to the market's future growth
5.3. Restrains
5.3.1. High cost and stringent standards would hamper the market
5.4. Opportunities
5.4.1. New technology adoption
6. Global Ballistic Composites Market Analysis and Forecast, By Type
6.1. Segment Overview
6.2. Polymer Matrix Composite (PMC)
6.3. Ceramic Matrix Composite (CMC)
6.4. Metal Matrix Composite (MMC)
7. Global Ballistic Composites Market Analysis and Forecast, By Application
7.1. Segment Overview
7.2. Vehicle Armor
7.3. Ballistic Body Armor
7.4. Helmets and Face Protectives
7.5. Others
8. Global Ballistic Composites Market Analysis and Forecast, By End Use
8.1. Segment Overview
8.2. Defense
8.3. Automotive
8.4. Aviation
8.5. Others
9. Global Ballistic Composites Market Analysis and Forecast, By Regional Analysis
9.1. Segment Overview
9.2. North America
9.2.1. U.S.
9.2.2. Canada
9.2.3. Mexico
9.3. Europe
9.3.1. Germany
9.3.2. France
9.3.3. U.K.
9.3.4. Italy
9.3.5. Spain
9.3.6. Rest of Europe
9.4. Asia-Pacific
9.4.1. Japan
9.4.2. China
9.4.3. India
9.4.4. Australia
9.4.5. South Korea
9.4.6. Rest of Asia-Pacific
9.5. South America
9.5.1. Brazil
9.5.2. Argentina
9.5.3. Rest of South America
9.6. Middle East and Africa
9.6.1. UAE
9.6.2. South Africa
9.6.3. Saudi Arabia
9.6.4. Rest of Middle East & Africa
10. Global Ballistic Composites Market -Competitive Landscape
10.1. Overview
10.2. Market Share of Key Players in the Ballistic Composites Market
10.2.1. Global Company Market Share
10.2.2. North America Company Market Share
10.2.3. Europe Company Market Share
10.2.4. APAC Company Market Share
10.3. Competitive Situations and Trends
10.3.1. Type Launches and Developments
10.3.2. Partnerships, Collaborations, and Agreements
10.3.3. Mergers & Acquisitions
10.3.4. Expansions
11. Company Profiles
11.1. BAE Systems
11.1.1. Business Overview
11.1.2. Company Snapshot
11.1.3. Company Market Share Analysis
11.1.4. Company End Use Portfolio
11.1.5. Recent Developments
11.1.6. SWOT Analysis
11.2. Gaffco ballistics
11.2.1. Business Overview
11.2.2. Company Snapshot
11.2.3. Company Market Share Analysis
11.2.4. Company End Use Portfolio
11.2.5. Recent Developments
11.2.6. SWOT Analysis
11.3. Gurit
11.3.1. Business Overview
11.3.2. Company Snapshot
11.3.3. Company Market Share Analysis
11.3.4. Company End Use Portfolio
11.3.5. Recent Developments
11.3.6. SWOT Analysis
11.4. ArmorSource
11.4.1. Business Overview
11.4.2. Company Snapshot
11.4.3. Company Market Share Analysis
11.4.4. Company End Use Portfolio
11.4.5. Recent Developments
11.4.6. SWOT Analysis
11.5. Royal Ten Cate NV
11.5.1. Business Overview
11.5.2. Company Snapshot
11.5.3. Company Market Share Analysis
11.5.4. Company End Use Portfolio
11.5.5. Recent Developments
11.5.6. SWOT Analysis
11.6. FY Composites OY
11.6.1. Business Overview
11.6.2. Company Snapshot
11.6.3. Company Market Share Analysis
11.6.4. Company End Use Portfolio
11.6.5. Recent Developments
11.6.6. SWOT Analysis
11.7. PRF Composite Materials
11.7.1. Business Overview
11.7.2. Company Snapshot
11.7.3. Company Market Share Analysis
11.7.4. Company End Use Portfolio
11.7.5. Recent Developments
11.7.6. SWOT Analysis
11.8. Elmon
11.8.1. Business Overview
11.8.2. Company Snapshot
11.8.3. Company Market Share Analysis
11.8.4. Company End Use Portfolio
11.8.5. Recent Developments
11.8.6. SWOT Analysis
11.9. Teijin Limited
11.9.1. Business Overview
11.9.2. Company Snapshot
11.9.3. Company Market Share Analysis
11.9.4. Company End Use Portfolio
11.9.5. Recent Developments
11.9.6. SWOT Analysis
11.10. DSM
11.10.1. Business Overview
11.10.2. Company Snapshot
11.10.3. Company Market Share Analysis
11.10.4. Company End Use Portfolio
11.10.5. Recent Developments
11.10.6. SWOT Analysis
List of Table
1. Global Ballistic Composites Market, By Type, 2022-2030(USD Million)
2. Global Polymer Matrix Composite (PMC) Ballistic Composites Market, By Region, 2022-2030(USD Million)
3. Global Ceramic Matrix Composite (CMC) Ballistic Composites Market, By Region, 2022-2030(USD Million)
4. Global Metal Matrix Composite (MMC)Ballistic Composites Market, By Region, 2022-2030(USD Million)
5. Global Ballistic Composites Market, By Application, 2022-2030(USD Million)
6. Global Vehicle Armor Ballistic Composites Market, By Region, 2022-2030(USD Million)
7. Global Ballistic Body Armor Ballistic Composites Market, By Region, 2022-2030(USD Million)
8. Global Helmets and Face Protectives Ballistic Composites Market, By Region, 2022-2030(USD Million)
9. Global Others Ballistic Composites Market, By Region, 2022-2030(USD Million)
10. Global Ballistic Composites Market, By End Use, 2022-2030(USD Million)
11. Global Defense Ballistic Composites Market, By Region, 2022-2030(USD Million)
12. Global Automotive Ballistic Composites Market, By Region, 2022-2030(USD Million)
13. Global Aviation Ballistic Composites Market, By Region, 2022-2030(USD Million)
14. Global Others Ballistic Composites Market, By Region, 2022-2030(USD Million)
15. Global Ballistic Composites Market, By Region, 2022-2030(USD Million)
16. Global Ballistic Composites Market, By North America, 2022-2030(USD Million)
17. North America Ballistic Composites Market, By Type, 2022-2030(USD Million)
18. North America Ballistic Composites Market, By Application, 2022-2030(USD Million)
19. North America Ballistic Composites Market, By End Use, 2022-2030(USD Million)
20. U.S. Ballistic Composites Market, By Type, 2022-2030(USD Million)
21. U.S. Ballistic Composites Market, By Application, 2022-2030(USD Million)
22. U.S. Ballistic Composites Market, By End Use, 2022-2030(USD Million)
23. Canada Ballistic Composites Market, By Type, 2022-2030(USD Million)
24. Canada Ballistic Composites Market, By Application, 2022-2030(USD Million)
25. Canada Ballistic Composites Market, By End Use, 2022-2030(USD Million)
26. Mexico Ballistic Composites Market, By Type, 2022-2030(USD Million)
27. Mexico Ballistic Composites Market, By Application, 2022-2030(USD Million)
28. Mexico Ballistic Composites Market, By End Use, 2022-2030(USD Million)
29. Europe Ballistic Composites Market, By Type, 2022-2030(USD Million)
30. Europe Ballistic Composites Market, By Application, 2022-2030(USD Million)
31. Europe Ballistic Composites Market, By End Use, 2022-2030(USD Million)
32. Germany Ballistic Composites Market, By Type, 2022-2030(USD Million)
33. Germany Ballistic Composites Market, By Application, 2022-2030(USD Million)
34. Germany Ballistic Composites Market, By End Use, 2022-2030(USD Million)
35. France Ballistic Composites Market, By Type, 2022-2030(USD Million)
36. France Ballistic Composites Market, By Application, 2022-2030(USD Million)
37. France Ballistic Composites Market, By End Use, 2022-2030(USD Million)
38. U.K. Ballistic Composites Market, By Type, 2022-2030(USD Million)
39. U.K. Ballistic Composites Market, By Application, 2022-2030(USD Million)
40. U.K. Ballistic Composites Market, By End Use, 2022-2030(USD Million)
41. Italy Ballistic Composites Market, By Type, 2022-2030(USD Million)
42. Italy Ballistic Composites Market, By Application, 2022-2030(USD Million)
43. Italy Ballistic Composites Market, By End Use, 2022-2030(USD Million)
44. Spain Ballistic Composites Market, By Type, 2022-2030(USD Million)
45. Spain Ballistic Composites Market, By Application, 2022-2030(USD Million)
46. Spain Ballistic Composites Market, By End Use, 2022-2030(USD Million)
47. Rest of Europe Ballistic Composites Market, By Type, 2022-2030(USD Million)
48. Rest of Europe Ballistic Composites Market, By Application, 2022-2030(USD Million)
49. Rest of Europe Ballistic Composites Market, By End Use, 2022-2030(USD Million)
50. Asia Pacific Ballistic Composites Market, By Type, 2022-2030(USD Million)
51. Asia Pacific Ballistic Composites Market, By Application, 2022-2030(USD Million)
52. Asia Pacific Ballistic Composites Market, By End Use, 2022-2030(USD Million)
53. Japan Ballistic Composites Market, By Type, 2022-2030(USD Million)
54. Japan Ballistic Composites Market, By Application, 2022-2030(USD Million)
55. Japan Ballistic Composites Market, By End Use, 2022-2030(USD Million)
56. China Ballistic Composites Market, By Type, 2022-2030(USD Million)
57. China Ballistic Composites Market, By Application, 2022-2030(USD Million)
58. China Ballistic Composites Market, By End Use, 2022-2030(USD Million)
59. India Ballistic Composites Market, By Type, 2022-2030(USD Million)
60. India Ballistic Composites Market, By Application, 2022-2030(USD Million)
61. India Ballistic Composites Market, By End Use, 2022-2030(USD Million)
62. Australia Ballistic Composites Market, By Type, 2022-2030(USD Million)
63. Australia Ballistic Composites Market, By Application, 2022-2030(USD Million)
64. Australia Ballistic Composites Market, By End Use, 2022-2030(USD Million)
65. South Korea Ballistic Composites Market, By Type, 2022-2030(USD Million)
66. South Korea Ballistic Composites Market, By Application, 2022-2030(USD Million)
67. South Korea Ballistic Composites Market, By End Use, 2022-2030(USD Million)
68. Rest of Asia-Pacific Ballistic Composites Market, By Type, 2022-2030(USD Million)
69. Rest of Asia-Pacific Ballistic Composites Market, By Application, 2022-2030(USD Million)
70. Rest of Asia-Pacific Ballistic Composites Market, By End Use, 2022-2030(USD Million)
71. South America Ballistic Composites Market, By Type, 2022-2030(USD Million)
72. South America Ballistic Composites Market, By Application, 2022-2030(USD Million)
73. South America Ballistic Composites Market, By End Use, 2022-2030(USD Million)
74. Brazil Ballistic Composites Market, By Type, 2022-2030(USD Million)
75. Brazil Ballistic Composites Market, By Application, 2022-2030(USD Million)
76. Brazil Ballistic Composites Market, By End Use, 2022-2030(USD Million)
77. Argentina Ballistic Composites Market, By Type, 2022-2030(USD Million)
78. Argentina Ballistic Composites Market, By Application, 2022-2030(USD Million)
79. Argentina Ballistic Composites Market, By End Use, 2022-2030(USD Million)
80. Rest of South America Ballistic Composites Market, By Type, 2022-2030(USD Million)
81. Rest of South America Ballistic Composites Market, By Application, 2022-2030(USD Million)
82. Rest of South America Ballistic Composites Market, By End Use, 2022-2030(USD Million)
83. Middle East and Africa Ballistic Composites Market, By Type, 2022-2030(USD Million)
84. Middle East and Africa Ballistic Composites Market, By Application, 2022-2030(USD Million)
85. Middle East and Africa Ballistic Composites Market, By End Use, 2022-2030(USD Million)
86. UAE Ballistic Composites Market, By Type, 2022-2030(USD Million)
87. UAE Ballistic Composites Market, By Application, 2022-2030(USD Million)
88. UAE Ballistic Composites Market, By End Use, 2022-2030(USD Million)
89. South Africa Ballistic Composites Market, By Type, 2022-2030(USD Million)
90. South Africa Ballistic Composites Market, By Application, 2022-2030(USD Million)
91. South Africa Ballistic Composites Market, By End Use, 2022-2030(USD Million)
92. Saudi Arabia Ballistic Composites Market, By Type, 2022-2030(USD Million)
93. Saudi Arabia Ballistic Composites Market, By Application, 2022-2030(USD Million)
94. Saudi Arabia Ballistic Composites Market, By End Use, 2022-2030(USD Million)
95. Rest of Middle East & Africa Ballistic Composites Market, By Type, 2022-2030(USD Million)
96. Rest of Middle East & Africa Ballistic Composites Market, By Application, 2022-2030(USD Million)
97. Rest of Middle East & Africa Ballistic Composites Market, By End Use, 2022-2030(USD Million)
List of Figures
1. Global Ballistic Composites Market Segmentation
2. Ballistic Composites Market: Research Methodology
3. Market Size Estimation Methodology: Bottom-Up Approach
4. Market Size Estimation Methodology: Top-Down Approach
5. Data Triangulation
6. Porter’s Five Forces Analysis
7. Value Chain Analysis
8. Global Ballistic Composites Market Attractiveness Analysis By Type
9. Global Ballistic Composites Market Attractiveness Analysis By Application
10. Global Ballistic Composites Market Attractiveness Analysis By End Use
11. Global Ballistic Composites Market Attractiveness Analysis By Region
12. Global Ballistic Composites Market: Dynamics
13. Global Ballistic Composites Market Share By Type(2022 & 2030)
14. Global Ballistic Composites Market Share By Application(2022 & 2030)
15. Global Ballistic Composites Market Share By End Use(2022 & 2030)
16. Global Ballistic Composites Market Share by Regions (2022 & 2030)
17. Global Ballistic Composites Market Share by Company (2021
By Type
By Application
By End use
By Region/Geography
Research has its special purpose to undertake marketing efficiently. In this competitive scenario, businesses need information across all industry verticals; the information about customer wants, market demand, competition, industry trends, distribution channels etc. This information needs to be updated regularly because businesses operate in a dynamic environment. Our organization, The Brainy Insights incorporates scientific and systematic research procedures in order to get proper market insights and industry analysis for overall business success. The analysis consists of studying the market from a miniscule level wherein we implement statistical tools which helps us in examining the data with accuracy and precision.
Our research reports feature both; quantitative and qualitative aspects for any market. Qualitative information for any market research process are fundamental because they reveal the customer needs and wants, usage and consumption for any product/service related to a specific industry. This in turn aids the marketers/investors in knowing certain perceptions of the customers. Qualitative research can enlighten about the different product concepts and designs along with unique service offering that in turn, helps define marketing problems and generate opportunities. On the other hand, quantitative research engages with the data collection process through interviews, e-mail interactions, surveys and pilot studies. Quantitative aspects for the market research are useful to validate the hypotheses generated during qualitative research method, explore empirical patterns in the data with the help of statistical tools, and finally make the market estimations.
The Brainy Insights offers comprehensive research and analysis, based on a wide assortment of factual insights gained through interviews with CXOs and global experts and secondary data from reliable sources. Our analysts and industry specialist assume vital roles in building up statistical tools and analysis models, which are used to analyse the data and arrive at accurate insights with exceedingly informative research discoveries. The data provided by our organization have proven precious to a diverse range of companies, facilitating them to address issues such as determining which products/services are the most appealing, whether or not customers use the product in the manner anticipated, the purchasing intentions of the market and many others.
Our research methodology encompasses an idyllic combination of primary and secondary initiatives. Key phases involved in this process are listed below:

The phase involves the gathering and collecting of market data and its related information with the help of different sources & research procedures.

The data procurement stage involves in data gathering and collecting through various data sources.
This stage involves in extensive research. These data sources includes:
Purchased Database: Purchased databases play a crucial role in estimating the market sizes irrespective of the domain. Our purchased database includes:
Primary Research: The Brainy Insights interacts with leading companies and experts of the concerned domain to develop the analyst team’s market understanding and expertise. It improves and substantiates every single data presented in the market reports. Primary research mainly involves in telephonic interviews, E-mail interactions and face-to-face interviews with the raw material providers, manufacturers/producers, distributors, & independent consultants. The interviews that we conduct provides valuable data on market size and industry growth trends prevailing in the market. Our organization also conducts surveys with the various industry experts in order to gain overall insights of the industry/market. For instance, in healthcare industry we conduct surveys with the pharmacists, doctors, surgeons and nurses in order to gain insights and key information of a medical product/device/equipment which the customers are going to usage. Surveys are conducted in the form of questionnaire designed by our own analyst team. Surveys plays an important role in primary research because surveys helps us to identify the key target audiences of the market. Additionally, surveys helps to identify the key target audience engaged with the market. Our survey team conducts the survey by targeting the key audience, thus gaining insights from them. Based on the perspectives of the customers, this information is utilized to formulate market strategies. Moreover, market surveys helps us to understand the current competitive situation of the industry. To be precise, our survey process typically involve with the 360 analysis of the market. This analytical process begins by identifying the prospective customers for a product or service related to the market/industry to obtain data on how a product/service could fit into customers’ lives.

Secondary Research: The secondary data sources includes information published by the on-profit organizations such as World bank, WHO, company fillings, investor presentations, annual reports, national government documents, statistical databases, blogs, articles, white papers and others. From the annual report, we analyse a company’s revenue to understand the key segment and market share of that organization in a particular region. We analyse the company websites and adopt the product mapping technique which is important for deriving the segment revenue. In the product mapping method, we select and categorize the products offered by the companies catering to domain specific market, deduce the product revenue for each of the companies so as to get overall estimation of the market size. We also source data and analyses trends based on information received from supply side and demand side intermediaries in the value chain. The supply side denotes the data gathered from supplier, distributor, wholesaler and the demand side illustrates the data gathered from the end customers for respective market domain.

The supply side for a domain specific market is analysed by:
The demand side for the market is estimated through:
In-house Library: Apart from these third-party sources, we have our in-house library of qualitative and quantitative information. Our in-house database includes market data for various industry and domains. These data are updated on regular basis as per the changing market scenario. Our library includes, historic databases, internal audit reports and archives.
Sometimes there are instances where there is no metadata or raw data available for any domain specific market. For those cases, we use our expertise to forecast and estimate the market size in order to generate comprehensive data sets. Our analyst team adopt a robust research technique in order to produce the estimates:
Data Synthesis: This stage involves the analysis & mapping of all the information obtained from the previous step. It also involves in scrutinizing the data for any discrepancy observed while data gathering related to the market. The data is collected with consideration to the heterogeneity of sources. Robust scientific techniques are in place for synthesizing disparate data sets and provide the essential contextual information that can orient market strategies. The Brainy Insights has extensive experience in data synthesis where the data passes through various stages:


Market Deduction & Formulation: The final stage comprises of assigning data points at appropriate market spaces so as to deduce feasible conclusions. Analyst perspective & subject matter expert based holistic form of market sizing coupled with industry analysis also plays a crucial role in this stage.
This stage involves in finalization of the market size and numbers that we have collected from data integration step. With data interpolation, it is made sure that there is no gap in the market data. Successful trend analysis is done by our analysts using extrapolation techniques, which provide the best possible forecasts for the market.
Data Validation & Market Feedback: Validation is the most important step in the process. Validation & re-validation via an intricately designed process helps us finalize data-points to be used for final calculations.

The Brainy Insights interacts with leading companies and experts of the concerned domain to develop the analyst team’s market understanding and expertise. It improves and substantiates every single data presented in the market reports. The data validation interview and discussion panels are typically composed of the most experienced industry members. The participants include, however, are not limited to:
Moreover, we always validate our data and findings through primary respondents from all the major regions we are working on.


Free Customization
Fortune 500 Clients
Free Yearly Update On Purchase Of Multi/Corporate License
Companies Served Till Date