- +1-315-215-1633
- sales@thebrainyinsights.com

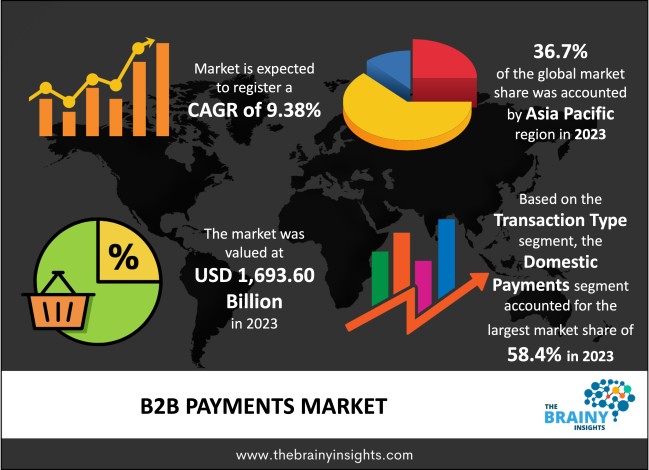
The global B2B payments market was valued at USD 1,693.60 Billion in 2023, which is anticipated to grow at a CAGR of 9.38% from 2024 to 2033. The rapid adoption of automation and digitalization, the expansion of international trade, and business sector expansion strategies have all contributed to the rise of the global B2B payments market. The expansion of cross-border business transactions involving more suppliers, retailers, and companies also contributed to the market expansion. However, the market expansion needs to be improved by payment theft in the company and the closure of other businesses. Technological developments in automation and emerging partnerships amongst market participants will generate fresh opportunities in the future.
The surge in digitalization and automation within the B2B payment system has increased the demand for networking and connections between business owners, suppliers, distributors, and retailers worldwide. The global market is being driven by an expansion of international trade, with more cross-border transactions involving multiple stakeholders such as wholesalers, retailers, and businesses. Nonetheless, commercial fraudulence in payments is set to hinder market growth. In contrast, transparency enhancements across B2B payments and collaborations between FinTech giants and operators will provide lucrative growth opportunities in the upcoming years.
Business-to-business payments, or B2B payments, are advancing quickly as technology and business circumstances place more importance on productivity, speed, and effectiveness. B2B processing is a means to handle currency exchange between two commercial entities for goods and services delivered through supply chain operations. It offers several features to end-users, such as receivable accounts, accounts payable, payroll, and procurement departments, while making routine, periodic, and safer transactions for merchants. Additionally, end users are increasingly adopting cutting-edge technologies like artificial intelligence (AI), machine learning (ML), and others to enable quicker and safer payment processes while lowering the workload for accounts payable. Business-to-business (B2B) payment encourages safer transactions for businesses demanding recurring, periodic transactions. It provides end users various functions, including accounts receivable, accounts payable, payroll, and acquisition departments. Depending on the contractual agreement between the buyer and seller, it could involve a one-time or continuous transaction. Because business-to-business (B2B) payment processing takes longer to approve and settle the transaction, B2B payments are more complicated than business-to-consumer (B2C) payments. Business-to-business (B2B) payments are financial transactions between two or more businesses. Instead of being amongst businesses and individual consumers (B2C), these payments are between businesses exchanging money, commodities, or services. For obtaining quicker payments, enhancing cash flow, and expanding more quickly, they are processed through secure gateways and provide a variety of payment options. Small and medium-sized enterprises (SMEs) drive the market worldwide. To keep up with rising demands from customers and suppliers, businesses need quicker payment settlements, real-time payment status visibility, and flexible payment choices. Another significant reason driving growth is the growing usage of automated clearing houses (ACH) for B2B payments because they are comparatively quicker and more effective. In addition, the market is growing as B2B payments are being used by big businesses to increase their market value and boost online sales of goods and services. Additionally, the growing automation of B2B payment systems for networking and interacting with suppliers, wholesalers, and retailers is fueling the market's growth.
Get an overview of this study by requesting a free sample
Increasing demand from various industries- Several industries, including healthcare and retail, witnessed a rise during the pandemic, raising demand for products and services and increasing B2B payments. During the pandemic, the shift from cash payments to digital transactions increased the demand for B2B payments. As a result, the global health crisis has moderately impacted the B2B payment business. Nonetheless, industries such as healthcare and others have contributed significantly to the expansion of B2B payments, which has benefited the B2B payments market. B2B payment providers have created new solutions and applied new technology to overcome difficulties. Some B2B payments market advancements include automating accounts payable, e-invoicing, and digitizing payments. These features have eased the execution of cashless B2B transactions from remote locations.
Effects of the COVID pandemic- Due to the novel COVID-19 epidemic, numerous sectors suffered from being in lockdown, and businesses were obliged to make several operational changes. Many businesses have faced losses and interruptions due to government restrictions on the flow of goods, transportation, import and export bans, travel restrictions, event cancellations, etc. Furthermore, due to these deviations in corporate operations, B2B payments have been impacted by low demand for goods and services, an inconsistent supply chain, and the business collapse. Furthermore, business-to-business (B2B) transactions declined due to government-imposed restrictions, leading to decreased B2B payments. Due to huge economic losses, supply constraints, and other factors, the worldwide health pandemic has generated several challenges for B2B payment service providers. These factors have resulted in a decrease in B2B payments, as businesses have either stopped paying for the acquisition of goods and services from wholesalers or have gone through difficulties in making payments, as business owners require assistance to conduct cash or in-person transactions due to travel restrictions.
The popularity of electronic payments- After the COVID-19 outbreak, business owners increased their use of digital payments, resulting in 10-year growth in only four months. The practice has extended to B2B payment setups. Digital retail transactions in B2B payments have increased rapidly. Since cash transactions were prohibited during the outbreak, most B2B payments continue with paper checks and invoices, resulting in a decline in B2B payments. Some businesses that lacked digital payment capabilities before the outbreak have started gradually adopting B2B payments, a crucial economic transition. Digitalizing the B2B payment space has made it easier for businesses to perform cross-border commercial transactions, increasing international trade and economic growth. This will also help the company survive in crucial situations.
The regions analyzed for the market include North America, Europe, South America, Asia Pacific, the Middle East, and Africa. Asia-Pacific emerged as the most significant global B2B payments market, with a 36.7% market revenue share in 2023. Asia Pacific is a huge and diverse market that includes various industries such as manufacturing, technology, retail, and finance. The region's diversified industries create many B2B transactions, resulting in a dominant position in the B2B payment market. Global enterprises and growing domestic businesses increase transaction volumes in the region.
Asia-Pacific Region B2B Payments Market Share in 2023 - 36.7%
www.thebrainyinsights.com
Check the geographical analysis of this market by requesting a free sample
The transaction type segment is divided into cross-border payments and domestic payments. The domestic payments segment dominated the market, with a market share of 58.4% in 2023. This payment option simplifies and automates domestic payment services for small and medium-sized businesses. This is a primary driver of the domestic B2B payments market's growth. Furthermore, digital B2B payment technology allows business owners to speed up the money transaction process when purchasing a product from a domestic business. This propels the market's growth. Furthermore, the rise in demand for virtual cards and online payments among business owners drives the B2B payment market forward.
The payment method segment is divided into digital and traditional. The traditional segment dominated the market, with a market share of 67.25% in 2023. When paying suppliers, business owners use various traditional payment methods, including cash and paper checks. Furthermore, the greater use of paper checks by business owners due to lower transaction fees is a crucial factor driving the rise of the B2B payment market in this area. Because cash is one of the most commonly recognized and hassle-free payment methods, most business owners have adopted cash payment processes to speed the money transaction service, promoting market expansion.
The industry vertical segment is divided into IT and telecom, energy and utilities, manufacturing, BFSI, and metals and mining. The IT and telecom segment dominated the market, with a market share of around 23.9% in 2023. The B2B payment system enables IT firm owners to make contactless payments with debit cards, credit cards, NFC cards, and mobile wallets. There is an increase in the use of B2B payment technology in the IT industry because it provides several benefits, such as faster payment processing, more business sales, and a greater customer retention rate. Increased protection of corporate owners' financial data from cyberattacks and the availability of advanced analytic tools, such as machine learning technology, to payment businesses, are some of the primary causes encouraging the adoption of B2B payment technology in this segment.
| Attribute | Description |
|---|---|
| Market Size | Revenue (USD Billion) |
| Market size value in 2023 | USD 1,693.60 Billion |
| Market size value in 2033 | USD 4,151.35 Billion |
| CAGR (2024 to 2033) | 9.38% |
| Historical data | 2020-2022 |
| Base Year | 2023 |
| Forecast | 2024-2033 |
| Region | The regions analyzed for the market are Asia Pacific, Europe, South America, North America, and Middle East & Africa. Furthermore, the regions are further analyzed at the country level. |
| Segments | Transaction Type, Payment Method, Industry Vertical |
As per The Brainy Insights, the size of the B2B payments market was valued at USD 1,693.60 Billion in 2023 & USD 4,151.35 Billion by 2033.
Global B2B payments market is growing at a CAGR of 9.38% during the forecast period 2024-2033.
Asia-Pacific region emerged as the largest market for the B2B payments.
Increasing demand from various industries is a significant driving factor for the growth of the B2B payments market.
Effects of the COVID pandemic is a significant restraining factor for the growth of the B2B payments market.
Popularity of electronic payments is a significant opportunity for the growth of the B2B payments market.
Key players are TransferWise Ltd., JPMorgan & Chase, American Express, Stripe, Paystand Inc., Payoneer Inc., Square, Inc., PayPal Holdings, Inc., Visa Inc., Mastercard, among others.
1. Introduction
1.1. Objective of the Study
1.2. Market Definition
1.3. Research Scope
1.4. Currency
1.5. Key Target Audience
2. Research Methodology and Assumptions
3. Executive Summary
4. Premium Insights
4.1. Porter’s Five Forces Analysis
4.2. Value Chain Analysis
4.3. Top Investment Pockets
4.3.1. Market Attractiveness Analysis By Transaction Type
4.3.2. Market Attractiveness Analysis By Payment Method
4.3.3. Market Attractiveness Analysis By Industry Vertical
4.3.4. Market Attractiveness Analysis By Region
4.4. Industry Trends
5. Market Dynamics
5.1. Market Evaluation
5.2. Drivers
5.2.1. Increasing demand from various industries
5.3. Restraints
5.3.1. Effects of the COVID pandemic
5.4. Opportunities
5.4.1. Popularity of electronic payments
6. Global B2B Payments Market Analysis and Forecast, By Transaction Type
6.1. Segment Overview
6.2. Cross-Border Payments
6.3. Domestic Payments
7. Global B2B Payments Market Analysis and Forecast, By Payment Method
7.1. Segment Overview
7.2. Digital
7.3. Traditional
8. Global B2B Payments Market Analysis and Forecast, By Industry Vertical
8.1. Segment Overview
8.2. IT and Telecom
8.3. Energy and Utilities
8.4. Manufacturing
8.5. BFSI
8.6. Metals and Mining
9. Global B2B Payments Market Analysis and Forecast, By Regional Analysis
9.1. Segment Overview
9.2. North America
9.2.1. U.S.
9.2.2. Canada
9.2.3. Mexico
9.3. Europe
9.3.1. Germany
9.3.2. France
9.3.3. U.K.
9.3.4. Italy
9.3.5. Spain
9.4. Asia-Pacific
9.4.1. Japan
9.4.2. China
9.4.3. India
9.5. South America
9.5.1. Brazil
9.6. Middle East and Africa
9.6.1. UAE
9.6.2. South Africa
10. Global B2B Payments Market-Competitive Landscape
10.1. Overview
10.2. Market Share of Key Players in the B2B Payments Market
10.2.1. Global Company Market Share
10.2.2. North America Company Market Share
10.2.3. Europe Company Market Share
10.2.4. APAC Company Market Share
10.3. Competitive Situations and Trends
10.3.1. Product Launches and Developments
10.3.2. Partnerships, Collaborations, and Agreements
10.3.3. Mergers & Acquisitions
10.3.4. Expansions
11. Company Profiles
11.1. TransferWise Ltd.
11.1.1. Business Overview
11.1.2. Company Snapshot
11.1.3. Company Market Share Analysis
11.1.4. Company Product Portfolio
11.1.5. Recent Developments
11.1.6. SWOT Analysis
11.2. JPMorgan & Chase
11.2.1. Business Overview
11.2.2. Company Snapshot
11.2.3. Company Market Share Analysis
11.2.4. Company Product Portfolio
11.2.5. Recent Developments
11.2.6. SWOT Analysis
11.3. American Express
11.3.1. Business Overview
11.3.2. Company Snapshot
11.3.3. Company Market Share Analysis
11.3.4. Company Product Portfolio
11.3.5. Recent Developments
11.3.6. SWOT Analysis
11.4. Stripe
11.4.1. Business Overview
11.4.2. Company Snapshot
11.4.3. Company Market Share Analysis
11.4.4. Company Product Portfolio
11.4.5. Recent Developments
11.4.6. SWOT Analysis
11.5. Paystand Inc.
11.5.1. Business Overview
11.5.2. Company Snapshot
11.5.3. Company Market Share Analysis
11.5.4. Company Product Portfolio
11.5.5. Recent Developments
11.5.6. SWOT Analysis
11.6. Payoneer Inc.
11.6.1. Business Overview
11.6.2. Company Snapshot
11.6.3. Company Market Share Analysis
11.6.4. Company Product Portfolio
11.6.5. Recent Developments
11.6.6. SWOT Analysis
11.7. Square, Inc.
11.7.1. Business Overview
11.7.2. Company Snapshot
11.7.3. Company Market Share Analysis
11.7.4. Company Product Portfolio
11.7.5. Recent Developments
11.7.6. SWOT Analysis
11.8. PayPal Holdings, Inc.
11.8.1. Business Overview
11.8.2. Company Snapshot
11.8.3. Company Market Share Analysis
11.8.4. Company Product Portfolio
11.8.5. Recent Developments
11.8.6. SWOT Analysis
11.9. Visa Inc.
11.9.1. Business Overview
11.9.2. Company Snapshot
11.9.3. Company Market Share Analysis
11.9.4. Company Product Portfolio
11.9.5. Recent Developments
11.9.6. SWOT Analysis
11.10. Mastercard
11.10.1. Business Overview
11.10.2. Company Snapshot
11.10.3. Company Market Share Analysis
11.10.4. Company Product Portfolio
11.10.5. Recent Developments
11.10.6. SWOT Analysis
List of Table
1. Global B2B Payments Market, By Transaction Type, 2020-2033 (USD Billion)
2. Global Cross-Border Payments, B2B Payments Market, By Region, 2020-2033 (USD Billion)
3. Global Domestic Payments, B2B Payments Market, By Region, 2020-2033 (USD Billion)
4. Global B2B Payments Market, By Payment Method, 2020-2033 (USD Billion)
5. Global Digital, B2B Payments Market, By Region, 2020-2033 (USD Billion)
6. Global Traditional, B2B Payments Market, By Region, 2020-2033 (USD Billion)
7. Global B2B Payments Market, By Industry Vertical, 2020-2033 (USD Billion)
8. Global IT and Telecom, B2B Payments Market, By Region, 2020-2033 (USD Billion)
9. Global Energy and Utilities, B2B Payments Market, By Region, 2020-2033 (USD Billion)
10. Global Manufacturing, B2B Payments Market, By Region, 2020-2033 (USD Billion)
11. Global BFSI, B2B Payments Market, By Region, 2020-2033 (USD Billion)
12. Global Metals and Mining, B2B Payments Market, By Region, 2020-2033 (USD Billion)
13. Global B2B Payments Market, By Region, 2020-2033 (USD Billion)
14. North America B2B Payments Market, By Transaction Type, 2020-2033 (USD Billion)
15. North America B2B Payments Market, By Payment Method, 2020-2033 (USD Billion)
16. North America B2B Payments Market, By Industry Vertical, 2020-2033 (USD Billion)
17. U.S. B2B Payments Market, By Transaction Type, 2020-2033 (USD Billion)
18. U.S. B2B Payments Market, By Payment Method, 2020-2033 (USD Billion)
19. U.S. B2B Payments Market, By Industry Vertical, 2020-2033 (USD Billion)
20. Canada B2B Payments Market, By Transaction Type, 2020-2033 (USD Billion)
21. Canada B2B Payments Market, By Payment Method, 2020-2033 (USD Billion)
22. Canada B2B Payments Market, By Industry Vertical, 2020-2033 (USD Billion)
23. Mexico B2B Payments Market, By Transaction Type, 2020-2033 (USD Billion)
24. Mexico B2B Payments Market, By Payment Method, 2020-2033 (USD Billion)
25. Mexico B2B Payments Market, By Industry Vertical, 2020-2033 (USD Billion)
26. Europe B2B Payments Market, By Transaction Type, 2020-2033 (USD Billion)
27. Europe B2B Payments Market, By Payment Method, 2020-2033 (USD Billion)
28. Europe B2B Payments Market, By Industry Vertical, 2020-2033 (USD Billion)
29. Germany B2B Payments Market, By Transaction Type, 2020-2033 (USD Billion)
30. Germany B2B Payments Market, By Payment Method, 2020-2033 (USD Billion)
31. Germany B2B Payments Market, By Industry Vertical, 2020-2033 (USD Billion)
32. France B2B Payments Market, By Transaction Type, 2020-2033 (USD Billion)
33. France B2B Payments Market, By Payment Method, 2020-2033 (USD Billion)
34. France B2B Payments Market, By Industry Vertical, 2020-2033 (USD Billion)
35. U.K. B2B Payments Market, By Transaction Type, 2020-2033 (USD Billion)
36. U.K. B2B Payments Market, By Payment Method, 2020-2033 (USD Billion)
37. U.K. B2B Payments Market, By Industry Vertical, 2020-2033 (USD Billion)
38. Italy B2B Payments Market, By Transaction Type, 2020-2033 (USD Billion)
39. Italy B2B Payments Market, By Payment Method, 2020-2033 (USD Billion)
40. Italy B2B Payments Market, By Industry Vertical, 2020-2033 (USD Billion)
41. Spain B2B Payments Market, By Transaction Type, 2020-2033 (USD Billion)
42. Spain B2B Payments Market, By Payment Method, 2020-2033 (USD Billion)
43. Spain B2B Payments Market, By Industry Vertical, 2020-2033 (USD Billion)
44. Asia Pacific B2B Payments Market, By Transaction Type, 2020-2033 (USD Billion)
45. Asia Pacific B2B Payments Market, By Payment Method, 2020-2033 (USD Billion)
46. Asia Pacific B2B Payments Market, By Industry Vertical, 2020-2033 (USD Billion)
47. Japan B2B Payments Market, By Transaction Type, 2020-2033 (USD Billion)
48. Japan B2B Payments Market, By Payment Method, 2020-2033 (USD Billion)
49. Japan B2B Payments Market, By Industry Vertical, 2020-2033 (USD Billion)
50. China B2B Payments Market, By Transaction Type, 2020-2033 (USD Billion)
51. China B2B Payments Market, By Payment Method, 2020-2033 (USD Billion)
52. China B2B Payments Market, By Industry Vertical, 2020-2033 (USD Billion)
53. India B2B Payments Market, By Transaction Type, 2020-2033 (USD Billion)
54. India B2B Payments Market, By Payment Method, 2020-2033 (USD Billion)
55. India B2B Payments Market, By Industry Vertical, 2020-2033 (USD Billion)
56. South America B2B Payments Market, By Transaction Type, 2020-2033 (USD Billion)
57. South America B2B Payments Market, By Payment Method, 2020-2033 (USD Billion)
58. South America B2B Payments Market, By Industry Vertical, 2020-2033 (USD Billion)
59. Brazil B2B Payments Market, By Transaction Type, 2020-2033 (USD Billion)
60. Brazil B2B Payments Market, By Payment Method, 2020-2033 (USD Billion)
61. Brazil B2B Payments Market, By Industry Vertical, 2020-2033 (USD Billion)
62. Middle East and Africa B2B Payments Market, By Transaction Type, 2020-2033 (USD Billion)
63. Middle East and Africa B2B Payments Market, By Payment Method, 2020-2033 (USD Billion)
64. Middle East and Africa B2B Payments Market, By Industry Vertical, 2020-2033 (USD Billion)
65. UAE B2B Payments Market, By Transaction Type, 2020-2033 (USD Billion)
66. UAE B2B Payments Market, By Payment Method, 2020-2033 (USD Billion)
67. UAE B2B Payments Market, By Industry Vertical, 2020-2033 (USD Billion)
68. South Africa B2B Payments Market, By Transaction Type, 2020-2033 (USD Billion)
69. South Africa B2B Payments Market, By Payment Method, 2020-2033 (USD Billion)
70. South Africa B2B Payments Market, By Industry Vertical, 2020-2033 (USD Billion)
List of Figures
1. Global B2B Payments Market Segmentation
2. B2B Payments Market: Research Methodology
3. Market Size Estimation Methodology: Bottom-Up Approach
4. Market Size Estimation Methodology: Top-Down Approach
5. Data Triangulation
6. Porter’s Five Forces Analysis
7. Value Chain Analysis
8. Global B2B Payments Market Attractiveness Analysis By Transaction Type
9. Global B2B Payments Market Attractiveness Analysis By Payment Method
10. Global B2B Payments Market Attractiveness Analysis By Industry Vertical
11. Global B2B Payments Market Attractiveness Analysis By Region
12. Global B2B Payments Market: Dynamics
13. Global B2B Payments Market Share By Transaction Type (2023 & 2033)
14. Global B2B Payments Market Share By Payment Method (2023 & 2033)
15. Global B2B Payments Market Share by Industry Vertical (2023 & 2033)
16. Global B2B Payments Market Share by Regions (2023 & 2033)
17. Global B2B Payments Market Share by Company (2023)
This study forecasts revenue at global, regional, and country levels from 2020 to 2033. The Brainy Insights has segmented the global B2B payments market based on below mentioned segments:
Global B2B Payments by Transaction Type:
Global B2B Payments by Payment Method:
Global B2B Payments by Industry Vertical:
Global B2B Payments by Region:
Research has its special purpose to undertake marketing efficiently. In this competitive scenario, businesses need information across all industry verticals; the information about customer wants, market demand, competition, industry trends, distribution channels etc. This information needs to be updated regularly because businesses operate in a dynamic environment. Our organization, The Brainy Insights incorporates scientific and systematic research procedures in order to get proper market insights and industry analysis for overall business success. The analysis consists of studying the market from a miniscule level wherein we implement statistical tools which helps us in examining the data with accuracy and precision.
Our research reports feature both; quantitative and qualitative aspects for any market. Qualitative information for any market research process are fundamental because they reveal the customer needs and wants, usage and consumption for any product/service related to a specific industry. This in turn aids the marketers/investors in knowing certain perceptions of the customers. Qualitative research can enlighten about the different product concepts and designs along with unique service offering that in turn, helps define marketing problems and generate opportunities. On the other hand, quantitative research engages with the data collection process through interviews, e-mail interactions, surveys and pilot studies. Quantitative aspects for the market research are useful to validate the hypotheses generated during qualitative research method, explore empirical patterns in the data with the help of statistical tools, and finally make the market estimations.
The Brainy Insights offers comprehensive research and analysis, based on a wide assortment of factual insights gained through interviews with CXOs and global experts and secondary data from reliable sources. Our analysts and industry specialist assume vital roles in building up statistical tools and analysis models, which are used to analyse the data and arrive at accurate insights with exceedingly informative research discoveries. The data provided by our organization have proven precious to a diverse range of companies, facilitating them to address issues such as determining which products/services are the most appealing, whether or not customers use the product in the manner anticipated, the purchasing intentions of the market and many others.
Our research methodology encompasses an idyllic combination of primary and secondary initiatives. Key phases involved in this process are listed below:

The phase involves the gathering and collecting of market data and its related information with the help of different sources & research procedures.

The data procurement stage involves in data gathering and collecting through various data sources.
This stage involves in extensive research. These data sources includes:
Purchased Database: Purchased databases play a crucial role in estimating the market sizes irrespective of the domain. Our purchased database includes:
Primary Research: The Brainy Insights interacts with leading companies and experts of the concerned domain to develop the analyst team’s market understanding and expertise. It improves and substantiates every single data presented in the market reports. Primary research mainly involves in telephonic interviews, E-mail interactions and face-to-face interviews with the raw material providers, manufacturers/producers, distributors, & independent consultants. The interviews that we conduct provides valuable data on market size and industry growth trends prevailing in the market. Our organization also conducts surveys with the various industry experts in order to gain overall insights of the industry/market. For instance, in healthcare industry we conduct surveys with the pharmacists, doctors, surgeons and nurses in order to gain insights and key information of a medical product/device/equipment which the customers are going to usage. Surveys are conducted in the form of questionnaire designed by our own analyst team. Surveys plays an important role in primary research because surveys helps us to identify the key target audiences of the market. Additionally, surveys helps to identify the key target audience engaged with the market. Our survey team conducts the survey by targeting the key audience, thus gaining insights from them. Based on the perspectives of the customers, this information is utilized to formulate market strategies. Moreover, market surveys helps us to understand the current competitive situation of the industry. To be precise, our survey process typically involve with the 360 analysis of the market. This analytical process begins by identifying the prospective customers for a product or service related to the market/industry to obtain data on how a product/service could fit into customers’ lives.

Secondary Research: The secondary data sources includes information published by the on-profit organizations such as World bank, WHO, company fillings, investor presentations, annual reports, national government documents, statistical databases, blogs, articles, white papers and others. From the annual report, we analyse a company’s revenue to understand the key segment and market share of that organization in a particular region. We analyse the company websites and adopt the product mapping technique which is important for deriving the segment revenue. In the product mapping method, we select and categorize the products offered by the companies catering to domain specific market, deduce the product revenue for each of the companies so as to get overall estimation of the market size. We also source data and analyses trends based on information received from supply side and demand side intermediaries in the value chain. The supply side denotes the data gathered from supplier, distributor, wholesaler and the demand side illustrates the data gathered from the end customers for respective market domain.

The supply side for a domain specific market is analysed by:
The demand side for the market is estimated through:
In-house Library: Apart from these third-party sources, we have our in-house library of qualitative and quantitative information. Our in-house database includes market data for various industry and domains. These data are updated on regular basis as per the changing market scenario. Our library includes, historic databases, internal audit reports and archives.
Sometimes there are instances where there is no metadata or raw data available for any domain specific market. For those cases, we use our expertise to forecast and estimate the market size in order to generate comprehensive data sets. Our analyst team adopt a robust research technique in order to produce the estimates:
Data Synthesis: This stage involves the analysis & mapping of all the information obtained from the previous step. It also involves in scrutinizing the data for any discrepancy observed while data gathering related to the market. The data is collected with consideration to the heterogeneity of sources. Robust scientific techniques are in place for synthesizing disparate data sets and provide the essential contextual information that can orient market strategies. The Brainy Insights has extensive experience in data synthesis where the data passes through various stages:


Market Deduction & Formulation: The final stage comprises of assigning data points at appropriate market spaces so as to deduce feasible conclusions. Analyst perspective & subject matter expert based holistic form of market sizing coupled with industry analysis also plays a crucial role in this stage.
This stage involves in finalization of the market size and numbers that we have collected from data integration step. With data interpolation, it is made sure that there is no gap in the market data. Successful trend analysis is done by our analysts using extrapolation techniques, which provide the best possible forecasts for the market.
Data Validation & Market Feedback: Validation is the most important step in the process. Validation & re-validation via an intricately designed process helps us finalize data-points to be used for final calculations.

The Brainy Insights interacts with leading companies and experts of the concerned domain to develop the analyst team’s market understanding and expertise. It improves and substantiates every single data presented in the market reports. The data validation interview and discussion panels are typically composed of the most experienced industry members. The participants include, however, are not limited to:
Moreover, we always validate our data and findings through primary respondents from all the major regions we are working on.


Free Customization
Fortune 500 Clients
Free Yearly Update On Purchase Of Multi/Corporate License
Companies Served Till Date