- +1-315-215-1633
- sales@thebrainyinsights.com

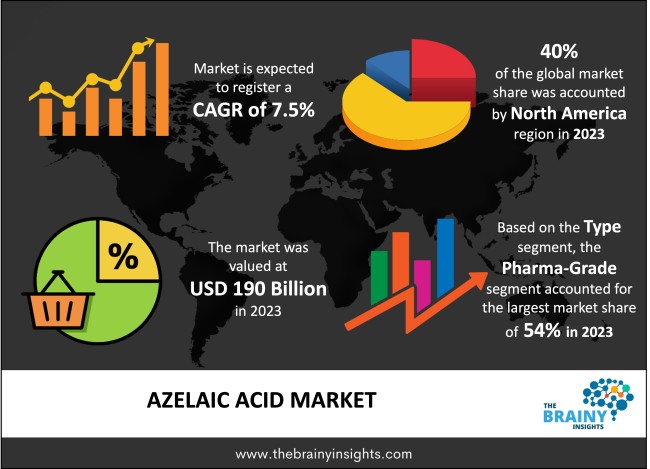
The global Azelaic Acid market was valued at USD 190 billion in 2023 and growing at a CAGR of 7.5% from 2024 to 2033. The market is expected to reach USD 392 billion by 2033. Increasing use of Azelaic Acid as a tanning agent, and rapidly growing demand from the cosmetics industry will potentially drive the growth of the Azelaic Acid Market. Increasing use from the pharmaceuticals industry, and rapidly growing strategic initiatives from private players may drive the growth of the Azelaic Acid Market in the period forecasted.
Azelaic acid is a compound that serves various purposes in both medical and industrial fields. azelaic acid is a versatile compound with uses ranging from skincare to industrial applications. Its effectiveness in treating skin conditions and its significance in chemical synthesis highlights its importance in various fields.
Get an overview of this study by requesting a free sample
Increasing use of Azelaic Acid as a tanning agent – The use of azelaic acid as a tanning agent has seen a steady rise in recent years, significantly driving the growth of the azelaic acid market. As a naturally occurring dicarboxylic acid found in wheat, rye, and barley, azelaic acid triggers a melanin-based tanning effect when applied topically on the skin.
The escalating demand for natural sunless tanning alternatives is leading more consumers to prefer products containing azelaic acid over traditional self-tanning or UV ultraviolet methods. Research conducted by the Canadian Dermatology Association in 2022 revealed that over 50% of Canadians who used tanning products in the past year opted for sunless tanners to achieve a safer, natural-looking tan. This increasing preference for natural alternatives is positively influencing the azelaic acid market. Moreover, the compound is considered safe for sensitive skin types and does not produce the orange or green hues associated with some other self-tanner active ingredients.
Rising innovations from new formulations in the market – The development of novel formulations to address hyperpigmentation and acne vulgaris presents a significant challenge to the growth of the azelaic acid market. With the emergence of more advanced and efficacious treatment alternatives, existing products such as azelaic acid topical formulations face competition and a subsequent loss of market share.
Rising government initiatives towards cancer cases - Ongoing advancements in pharmaceutical research are showing promising outcomes, especially regarding the utilization of azelaic acid for diverse dermatological conditions. Azelaic acid has demonstrated effectiveness in tackling issues such as acne and hyperpigmentation, including challenging conditions like melasma and rosacea. With the increasing demand for safer and more natural skincare remedies, the integration of azelaic acid as a key ingredient is gaining wider recognition.
Data provided by the National Eczema Association highlights that over 31 million Americans grapple with eczema or atopic dermatitis. Recent clinical trials have emphasized azelaic acid's potential as a therapeutic option, whether utilized independently or alongside other treatments, for managing eczema. Its notable anti-inflammatory and antimicrobial properties position it as a promising contender for addressing such dermatological concerns.
The regions analyzed for the market include North America, Europe, South America, Asia Pacific, the Middle East, and Africa. North America emerged as the largest global Azelaic Acid market, accounting for 40% of the total market. Owing to the presence of the largest competitors in the region coupled with the evolving and ever-increasing cosmetics industry and increasing use of tanning agents in the region. Whereas, Europe is expected to be the fastest-growing in the region owing to loads of mergers and acquisitions and collaborations.
North America Region Azelaic Acid Market Share in 2023 - 40%
www.thebrainyinsights.com
Check the geographical analysis of this market by requesting a free sample
The pharma-grade segment emerged as the dominant force in the market, commanding a substantial revenue share of 54%. This dominance is attributed to its high purity and extensive applications across cosmetics, pharmaceuticals, and personal care segments. Within the pharmaceutical sector, azelaic acid finds application in ointments for treating conditions like rosacea and acne. Moreover, it serves as a bleaching or whitening active compound in skincare products. Over the forecast period, azelaic acid is anticipated to witness continued robust demand, driven by the growing need for skincare products
Plastics is the dominant segment in the market, comprising of 45% of the market share in the global market. Owing to increasing skincare products and rapidly growing dermatological procedures in the market. Whereas, the Pharmaceutical segment is expected to be the fastest-growing in the region, owing to increase in the treatment of various skin care problems: rosacea and acne.
| Attribute | Description |
|---|---|
| Market Size | Revenue (USD Billion) |
| Market size value in 2023 | USD 190 Billion |
| Market size value in 2033 | USD 392 Billion |
| CAGR (2024 to 2033) | 7.5% |
| Historical data | 2020-2022 |
| Base Year | 2023 |
| Forecast | 2024-2033 |
| Region | The regions analyzed for the market are Asia Pacific, Europe, South America, North America, and Middle East & Africa. Furthermore, the regions are further analyzed at the country level. |
| Segments | Type, Application |
As per The Brainy Insights, the size of the azelaic acid market was valued at USD 190 billion in 2023 to USD 392 billion by 2033.
The global azelaic acid market is growing at a CAGR of 7.5% during the forecast period 2024-2033.
The North America region emerged as the largest market for the azelaic acid.
The increasing use of azelaic acid as a tanning agent will influence the market's growth.
1. Introduction
1.1. Objectives of the Study
1.2. Market Definition
1.3. Research Scope
1.4. Currency
1.5. Key Target Audience
2. Research Methodology and Assumptions
3. Executive Summary
4. Premium Insights
4.1. Porter’s Five Forces Analysis
4.2. Value Chain Analysis
4.3. Top Investment Pockets
4.3.1. Market Attractiveness Analysis by Type
4.3.2. Market Attractiveness Analysis by Application
4.3.3. Market Attractiveness Analysis by Region
4.4. Industry Trends
5. Market Dynamics
5.1. Market Evaluation
5.2. Drivers
5.2.1. Increasing use of Azelaic Acid as a tanning agent
5.2.2. Rapidly growing demand from the cosmetics industry
5.3. Restraints
5.3.1. Rising innovations from new formulations in the market
5.4. Opportunities
5.4.1. Increasing use from the pharmaceuticals industry
5.4.2. Rapidly growing strategic initiatives from private players
5.5. Challenges
5.5.1. Increasing competition from market players
6. Global Azelaic Acid Market Analysis and Forecast, By Type
6.1. Segment Overview
6.2. Polymer Grade
6.3. Pharma Grade
6.4. Technical Grade
7. Global Azelaic Acid Market Analysis and Forecast, By Application
7.1. Segment Overview
7.2. Pharmaceutical
7.3. Adhesives
7.4. Plastics
7.5. Lubricants
7.6. Personal Care & Cosmetics
7.7. Others
8. Global Azelaic Acid Market Analysis and Forecast, By Regional Analysis
8.1. Segment Overview
8.2. North America
8.2.1. U.S.
8.2.2. Canada
8.2.3. Mexico
8.3. Europe
8.3.1. Germany
8.3.2. France
8.3.3. U.K.
8.3.4. Italy
8.3.5. Spain
8.4. Asia-Pacific
8.4.1. Japan
8.4.2. China
8.4.3. India
8.5. South America
8.5.1. Brazil
8.6. Middle East and Africa
8.6.1. UAE
8.6.2. South Africa
9. Global Azelaic Acid Market-Competitive Landscape
9.1. Overview
9.2. Market Share of Key Players in Global Azelaic Acid Market
9.2.1. Global Company Market Share
9.2.2. North America Company Market Share
9.2.3. Europe Company Market Share
9.2.4. APAC Company Market Share
9.3. Competitive Situations and Trends
9.3.1. Product Launches and Developments
9.3.2. Partnerships, Collaborations, and Agreements
9.3.3. Mergers & Acquisitions
9.3.4. Expansions
10. Company Profiles
10.1. BASF SE
10.1.1. Business Overview
10.1.2. Company Snapshot
10.1.3. Company Market Share Analysis
10.1.4. Company Product Portfolio
10.1.5. Recent Developments
10.1.6. SWOT Analysis
10.2. Croda International plc
10.2.1. Business Overview
10.2.2. Company Snapshot
10.2.3. Company Market Share Analysis
10.2.4. Company Product Portfolio
10.2.5. Recent Developments
10.2.6. SWOT Analysis
10.3. Emery Oleochemicals
10.3.1. Business Overview
10.3.2. Company Snapshot
10.3.3. Company Market Share Analysis
10.3.4. Company Product Portfolio
10.3.5. Recent Developments
10.3.6. SWOT Analysis
10.4. Haihang Industry Co
10.4.1. Business Overview
10.4.2. Company Snapshot
10.4.3. Company Market Share Analysis
10.4.4. Company Product Portfolio
10.4.5. Recent Developments
10.4.6. SWOT Analysis
10.5. Jiangsu Senxuan Pharmaceutical and Chemical Co Ltd
10.5.1. Business Overview
10.5.2. Company Snapshot
10.5.3. Company Market Share Analysis
10.5.4. Company Product Portfolio
10.5.5. Recent Developments
10.5.6. SWOT Analysis
10.6. Matrica S.p.A
10.6.1. Business Overview
10.6.2. Company Snapshot
10.6.3. Company Market Share Analysis
10.6.4. Company Product Portfolio
10.6.5. Recent Developments
10.6.6. SWOT Analysis
10.7. Nantong Hengxing Electronic Materials Co Ltd
10.7.1. Business Overview
10.7.2. Company Snapshot
10.7.3. Company Market Share Analysis
10.7.4. Company Product Portfolio
10.7.5. Recent Developments
10.7.6. SWOT Analysis
10.8. Nantong Jinghua Pharmaceutical Co Ltd
10.8.1. Business Overview
10.8.2. Company Snapshot
10.8.3. Company Market Share Analysis
10.8.4. Company Product Portfolio
10.8.5. Recent Developments
10.8.6. SWOT Analysis
10.9. Wufeng Chicheng Biotech Co Ltd
10.9.1. Business Overview
10.9.2. Company Snapshot
10.9.3. Company Market Share Analysis
10.9.4. Company Product Portfolio
10.9.5. Recent Developments
10.9.6. SWOT Analysis
10.10. Xi'an Sonwu Biotech Co Ltd
10.10.1. Business Overview
10.10.2. Company Snapshot
10.10.3. Company Market Share Analysis
10.10.4. Company Product Portfolio
10.10.5. Recent Developments
10.10.6. SWOT Analysis
List of Table
1. Global Azelaic Acid Market, By Type, 2020-2033 (USD Billion)
2. Global Polymer Grade, Azelaic Acid Market, By Region, 2020-2033 (USD Billion)
3. Global Pharma Grade, Azelaic Acid Market, By Region, 2020-2033 (USD Billion)
4. Global Technical Grade, Azelaic Acid Market, By Region, 2020-2033 (USD Billion)
5. Global Azelaic Acid Market, By Application, 2020-2033 (USD Billion)
6. Global Pharmaceutical, Azelaic Acid Market, By Region, 2020-2033 (USD Billion)
7. Global Adhesives, Azelaic Acid Market, By Region, 2020-2033 (USD Billion)
8. Global Plastics, Azelaic Acid Market, By Region, 2020-2033 (USD Billion)
9. Global Lubricants, Azelaic Acid Market, By Region, 2020-2033 (USD Billion)
10. Global Personal Care and Cosmetics, Azelaic Acid Market, By Region, 2020-2033 (USD Billion)
11. Global Others, Azelaic Acid Market, By Region, 2020-2033 (USD Billion)
12. Global Azelaic Acid Market, By Region, 2020-2033 (USD Billion)
13. North America Azelaic Acid Market, By Type, 2020-2033 (USD Billion)
14. North America Azelaic Acid Market, By Application, 2020-2033 (USD Billion)
15. U.S. Azelaic Acid Market, By Type, 2020-2033 (USD Billion)
16. U.S. Azelaic Acid Market, By Application, 2020-2033 (USD Billion)
17. Canada Azelaic Acid Market, By Type, 2020-2033 (USD Billion)
18. Canada Azelaic Acid Market, By Application, 2020-2033 (USD Billion)
19. Mexico Azelaic Acid Market, By Type, 2020-2033 (USD Billion)
20. Mexico Azelaic Acid Market, By Application, 2020-2033 (USD Billion)
21. Europe Azelaic Acid Market, By Type, 2020-2033 (USD Billion)
22. Europe Azelaic Acid Market, By Application, 2020-2033 (USD Billion)
23. Germany Azelaic Acid Market, By Type, 2020-2033 (USD Billion)
24. Germany Azelaic Acid Market, By Application, 2020-2033 (USD Billion)
25. France Azelaic Acid Market, By Type, 2020-2033 (USD Billion)
26. France Azelaic Acid Market, By Application, 2020-2033 (USD Billion)
27. U.K. Azelaic Acid Market, By Type, 2020-2033 (USD Billion)
28. U.K. Azelaic Acid Market, By Application, 2020-2033 (USD Billion)
29. Italy Azelaic Acid Market, By Type, 2020-2033 (USD Billion)
30. Italy Azelaic Acid Market, By Application, 2020-2033 (USD Billion)
31. Spain Azelaic Acid Market, By Type, 2020-2033 (USD Billion)
32. Spain Azelaic Acid Market, By Application, 2020-2033 (USD Billion)
33. Asia Pacific Azelaic Acid Market, By Type, 2020-2033 (USD Billion)
34. Asia Pacific Azelaic Acid Market, By Application, 2020-2033 (USD Billion)
35. Japan Azelaic Acid Market, By Type, 2020-2033 (USD Billion)
36. Japan Azelaic Acid Market, By Application, 2020-2033 (USD Billion)
37. China Azelaic Acid Market, By Type, 2020-2033 (USD Billion)
38. China Azelaic Acid Market, By Application, 2020-2033 (USD Billion)
39. India Azelaic Acid Market, By Type, 2020-2033 (USD Billion)
40. India Azelaic Acid Market, By Application, 2020-2033 (USD Billion)
41. South America Azelaic Acid Market, By Type, 2020-2033 (USD Billion)
42. South America Azelaic Acid Market, By Application, 2020-2033 (USD Billion)
43. Brazil Azelaic Acid Market, By Type, 2020-2033 (USD Billion)
44. Brazil Azelaic Acid Market, By Application, 2020-2033 (USD Billion)
45. Middle East and Africa Azelaic Acid Market, By Type, 2020-2033 (USD Billion)
46. Middle East and Africa Azelaic Acid Market, By Application, 2020-2033 (USD Billion)
47. UAE Azelaic Acid Market, By Type, 2020-2033 (USD Billion)
48. UAE Azelaic Acid Market, By Application, 2020-2033 (USD Billion)
49. South Africa Azelaic Acid Market, By Type, 2020-2033 (USD Billion)
50. South Africa Azelaic Acid Market, By Application, 2020-2033 (USD Billion)
List of Figures
1. Global Azelaic Acid Market Segmentation
2. Global Azelaic Acid Market: Research Methodology
3. Market Size Estimation Methodology: Bottom-Up Approach
4. Market Size Estimation Methodology: Top-Down Approach
5. Data Triangulation
6. Porter’s Five Forces Analysis
7. Value Chain Analysis
8. Global Azelaic Acid Market Attractiveness Analysis by Type
9. Global Azelaic Acid Market Attractiveness Analysis by Application
10. Global Azelaic Acid Market Attractiveness Analysis by Region
11. Global Azelaic Acid Market: Dynamics
12. Global Azelaic Acid Market Share by Type (2023 & 2033)
13. Global Azelaic Acid Market Share by Application (2023 & 2033)
14. Global Azelaic Acid Market Share by Regions (2023 & 2033)
15. Global Azelaic Acid Market Share by Company (2023)
This study forecasts revenue at global, regional, and country levels from 2020 to 2033. The Brainy Insights has segmented the global azelaic acid market based on below-mentioned segments:
Global Azelaic Acid Market by Type:
Global Azelaic Acid Market by Application:
Global Azelaic Acid Market by Region:
Research has its special purpose to undertake marketing efficiently. In this competitive scenario, businesses need information across all industry verticals; the information about customer wants, market demand, competition, industry trends, distribution channels etc. This information needs to be updated regularly because businesses operate in a dynamic environment. Our organization, The Brainy Insights incorporates scientific and systematic research procedures in order to get proper market insights and industry analysis for overall business success. The analysis consists of studying the market from a miniscule level wherein we implement statistical tools which helps us in examining the data with accuracy and precision.
Our research reports feature both; quantitative and qualitative aspects for any market. Qualitative information for any market research process are fundamental because they reveal the customer needs and wants, usage and consumption for any product/service related to a specific industry. This in turn aids the marketers/investors in knowing certain perceptions of the customers. Qualitative research can enlighten about the different product concepts and designs along with unique service offering that in turn, helps define marketing problems and generate opportunities. On the other hand, quantitative research engages with the data collection process through interviews, e-mail interactions, surveys and pilot studies. Quantitative aspects for the market research are useful to validate the hypotheses generated during qualitative research method, explore empirical patterns in the data with the help of statistical tools, and finally make the market estimations.
The Brainy Insights offers comprehensive research and analysis, based on a wide assortment of factual insights gained through interviews with CXOs and global experts and secondary data from reliable sources. Our analysts and industry specialist assume vital roles in building up statistical tools and analysis models, which are used to analyse the data and arrive at accurate insights with exceedingly informative research discoveries. The data provided by our organization have proven precious to a diverse range of companies, facilitating them to address issues such as determining which products/services are the most appealing, whether or not customers use the product in the manner anticipated, the purchasing intentions of the market and many others.
Our research methodology encompasses an idyllic combination of primary and secondary initiatives. Key phases involved in this process are listed below:

The phase involves the gathering and collecting of market data and its related information with the help of different sources & research procedures.

The data procurement stage involves in data gathering and collecting through various data sources.
This stage involves in extensive research. These data sources includes:
Purchased Database: Purchased databases play a crucial role in estimating the market sizes irrespective of the domain. Our purchased database includes:
Primary Research: The Brainy Insights interacts with leading companies and experts of the concerned domain to develop the analyst team’s market understanding and expertise. It improves and substantiates every single data presented in the market reports. Primary research mainly involves in telephonic interviews, E-mail interactions and face-to-face interviews with the raw material providers, manufacturers/producers, distributors, & independent consultants. The interviews that we conduct provides valuable data on market size and industry growth trends prevailing in the market. Our organization also conducts surveys with the various industry experts in order to gain overall insights of the industry/market. For instance, in healthcare industry we conduct surveys with the pharmacists, doctors, surgeons and nurses in order to gain insights and key information of a medical product/device/equipment which the customers are going to usage. Surveys are conducted in the form of questionnaire designed by our own analyst team. Surveys plays an important role in primary research because surveys helps us to identify the key target audiences of the market. Additionally, surveys helps to identify the key target audience engaged with the market. Our survey team conducts the survey by targeting the key audience, thus gaining insights from them. Based on the perspectives of the customers, this information is utilized to formulate market strategies. Moreover, market surveys helps us to understand the current competitive situation of the industry. To be precise, our survey process typically involve with the 360 analysis of the market. This analytical process begins by identifying the prospective customers for a product or service related to the market/industry to obtain data on how a product/service could fit into customers’ lives.

Secondary Research: The secondary data sources includes information published by the on-profit organizations such as World bank, WHO, company fillings, investor presentations, annual reports, national government documents, statistical databases, blogs, articles, white papers and others. From the annual report, we analyse a company’s revenue to understand the key segment and market share of that organization in a particular region. We analyse the company websites and adopt the product mapping technique which is important for deriving the segment revenue. In the product mapping method, we select and categorize the products offered by the companies catering to domain specific market, deduce the product revenue for each of the companies so as to get overall estimation of the market size. We also source data and analyses trends based on information received from supply side and demand side intermediaries in the value chain. The supply side denotes the data gathered from supplier, distributor, wholesaler and the demand side illustrates the data gathered from the end customers for respective market domain.

The supply side for a domain specific market is analysed by:
The demand side for the market is estimated through:
In-house Library: Apart from these third-party sources, we have our in-house library of qualitative and quantitative information. Our in-house database includes market data for various industry and domains. These data are updated on regular basis as per the changing market scenario. Our library includes, historic databases, internal audit reports and archives.
Sometimes there are instances where there is no metadata or raw data available for any domain specific market. For those cases, we use our expertise to forecast and estimate the market size in order to generate comprehensive data sets. Our analyst team adopt a robust research technique in order to produce the estimates:
Data Synthesis: This stage involves the analysis & mapping of all the information obtained from the previous step. It also involves in scrutinizing the data for any discrepancy observed while data gathering related to the market. The data is collected with consideration to the heterogeneity of sources. Robust scientific techniques are in place for synthesizing disparate data sets and provide the essential contextual information that can orient market strategies. The Brainy Insights has extensive experience in data synthesis where the data passes through various stages:


Market Deduction & Formulation: The final stage comprises of assigning data points at appropriate market spaces so as to deduce feasible conclusions. Analyst perspective & subject matter expert based holistic form of market sizing coupled with industry analysis also plays a crucial role in this stage.
This stage involves in finalization of the market size and numbers that we have collected from data integration step. With data interpolation, it is made sure that there is no gap in the market data. Successful trend analysis is done by our analysts using extrapolation techniques, which provide the best possible forecasts for the market.
Data Validation & Market Feedback: Validation is the most important step in the process. Validation & re-validation via an intricately designed process helps us finalize data-points to be used for final calculations.

The Brainy Insights interacts with leading companies and experts of the concerned domain to develop the analyst team’s market understanding and expertise. It improves and substantiates every single data presented in the market reports. The data validation interview and discussion panels are typically composed of the most experienced industry members. The participants include, however, are not limited to:
Moreover, we always validate our data and findings through primary respondents from all the major regions we are working on.


Free Customization
Fortune 500 Clients
Free Yearly Update On Purchase Of Multi/Corporate License
Companies Served Till Date