- +1-315-215-1633
- sales@thebrainyinsights.com

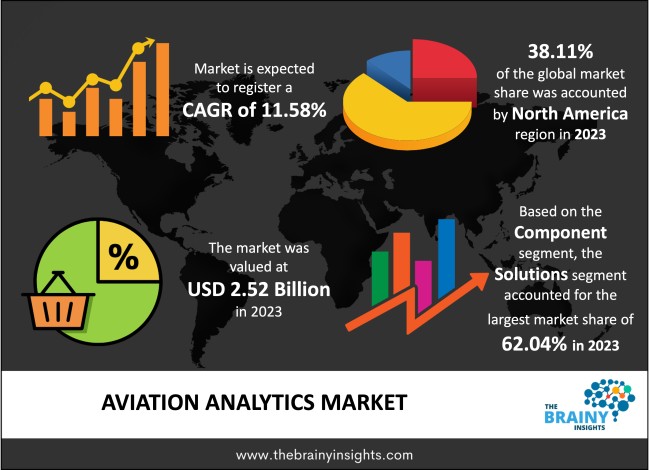
The global aviation analytics market was valued at USD 2.52 billion in 2023 and grew at a CAGR of 11.58% from 2024 to 2033. The market is expected to reach USD 7.54 billion by 2033. The increasing demand for air travel, given the rising disposable income of the population and cheaper air travel options, will drive the global aviation analytics market's growth. Big Data adoption has increased recently. It helps airlines better understand their plans and, hence, deliver based on dynamic market demand. This is also boosting the aviation analytics market.
The aviation industry is related to flying services that transport goods or people. They also offer services to the military along with meeting civil demands. The function of an aircraft defines its design, components and avionics. There are two broad categories into which the aviation industry is divided. They are military aviation and civil aviation. The world is mining data to better understand society and improve the global population's quality of life. The sheer amount of raw data produced daily is not useful unless filtered and processed properly. Analytics is a branch of computer science that looks for useful patterns in this raw data. It employs simple arithmetic, statistics, and machine learning. The aviation industry, too, uses data analytics. The data on flights, like their routes, pilots, frequency of travel, failures, accidents, complaints, and passenger data, like travel history, frequency and other preferences, are used to optimize the services in the aviation industry. The passenger travel history enables the company to identify their most travelled destination, which allows them to offer customized coupons and offers to the customers. The accidents and weather forecast data help in predictive analytics as it enables the identification of weather conditions that resulted in most accidents, thereby preventing future accidents based on historical flight information. Analytics can assist airlines in being more proactive and setting best practices to continuously improve their maintenance procedures and ensure the utmost safety for their passengers. Aviation analytics enhances customer satisfaction, optimizes operational services and improves the time performance of airlines.
Get an overview of this study by requesting a free sample
The increasing demand for flights or air travel – The increasing disposable income of the population in the developing world has increased the demand for flights. The increasing population has increased the burden on train and road travel, which cannot meet the rising demands. The aviation industry is filling the demand-supply gap. The increasing number of airlines in the industry offers customers wider choices and better prices. Furthermore, the increasing infrastructural spending by the government to build an airport of international standing is attracting foreign airlines to expand their operation. The increasing infrastructural spending is facilitated by rising fiscal funding to revive the tourism department, which will drive the aviation market. The increasing demand, supply and capital spending in the aviation industry have created chaos, given the sudden rise in the volume of passengers, aircrafts, low air traffic controllers and other personnel. Due to the shortage of equipment and labour, the lack of maintenance has increased air accidents. Therefore, the aviation industry is resorting to aviation analytics to optimize its operations to ensure passenger and crew safety, aircraft safety, and enhanced service offerings. Therefore, the increasing demand for flights or air travel will drive the global aviation analytics market.
The lack of qualified and skilled personnel – The use of artificial intelligence, big data and IoT have been employed in aviation analytics. However, the rapidly changing pace of technology has created a bridge between the demand and supply of skilled aviation analytics. The growth of the aviation industry will face a shortage of personnel. Furthermore, the aviation industry shutting down, followed by covid-19 pandemic, has discouraged the labour force from opting for jobs in the aviation industry. The shortage of aviation analysts has stretched the existing service personnel leading to non-optimal performance. Therefore, lacking qualified and skilled personnel will hamper the market's growth. Opportunities:
The use of AI and big data - Big data enables the real-time processing of large volumes of data. The improvement in AI and big data has enabled real-time processing, better filtration and customization. For instance, artificial intelligence has enabled paperless checking and boarding, optimizing airport and flight operations. Similarly, machine learning, robotics, and IoT are increasingly used in the aviation industry to their advantage. Some of the main benefits are predictive maintenance, pattern recognition, auto-scheduling, targeted advertising, and customer feedback analysis. Therefore, the growing use of AI and big data will offer lucrative global aviation analytics market opportunities.
The regions analyzed for the market include North America, Europe, South America, Asia Pacific, the Middle East, and Africa. North America emerged as the largest market for the global aviation analytics market, with a 38.11% share of the market revenue in 2023.
North American region will account for the largest market share with revenue growth. The North American market has a well-established aviation industry with heavy air traffic, given the high per capita income of the region's population. Furthermore, significant market players offering aviation analytics and key airlines drive the regional market's development. The market players' access to advanced technology and quicker adoption of AI, ML and big data will propel regional growth.
North America Region Aviation Analytics Market Share in 2023 - 38.11%
www.thebrainyinsights.com
Check the geographical analysis of this market by requesting a free sample
The component segment is divided into solutions and services. The solutions segment dominated the market, with a market share of around 62.04% in 2023. The airlines incorporate solutions best suited to their needs and resort to customization for their unique problems. The presence of several key market players offering aviation analytics solutions has driven the segment's growth. Furthermore, the solution providers are using advanced technologies to offer the most efficient products to optimize the airlines' operational performance.
The application segment is divided into fuel management, inventory management, revenue management, customer analytics, navigation services, flight risk management, route management, fleet management, performance monitoring, supply chain management, predictive analysis and others. The customer analytics segment dominated the market, with a market share of around 32.45% in 2023. Customer analytics is the process where data gathered from many sources is examined to determine, attract, and maintain customers. It assists airlines in gaining insightful information, which facilitates the development of better goods and services. Customers are the ultimate revenue generation stakeholders. It is highly paramount to attract new customers and retain the existing ones. The airlines apply aviation analytics filters through the vast amounts of customer data, their flights, travel history, destinations, arrivals, timings they prefer, etc. all this analysis helps the airlines in interpreting the customer choices, tastes and preferences, which enables them to customize product offering for the customer, thereby improving customer satisfaction and better relationship management.
The function segment is divided into sales and marketing, maintenance, supply chain, repair and operations, finance and others. The sales and marketing segment dominated the market, with a market share of around 34.33% in 2023. The sales and marketing of customized product offerings for customers according to their tastes and preferences are enabled by robust aviation analytics. There is a higher chance of acquiring new customers and retaining the existing ones by understanding their travel history and offering them the best products, prices, coupons and offers based on the same history.
The end-user segment is divided into original equipment manufacturers, airlines, airports and others. The airlines segment dominated the market, with a market share of around 47.51% in 2023. The airlines use it to optimize their operations, manage aircraft and personnel, and manage the customer relationship. Aviation analytics optimizes maintenance and repairs, thereby ensuring customer safety. The multiple solutions and services offered to the airlines also propel the segment's growth.
| Attribute | Description |
|---|---|
| Market Size | Revenue (USD Billion) |
| Market size value in 2023 | USD 2.52 Billion |
| Market size value in 2033 | USD 7.54 Billion |
| CAGR (2024 to 2033) | 11.58% |
| Historical data | 2020-2022 |
| Base Year | 2023 |
| Forecast | 2024-2033 |
| Region | The regions analyzed for the market are Asia Pacific, Europe, South America, North America, and Middle East & Africa. Furthermore, the regions are further analyzed at the country level. |
| Segments | Component, Application, Function and End User |
As per The Brainy Insights, the size of the global aviation analytics market was valued at USD 2.52 billion in 2023 to USD 7.54 billion by 2033.
Global aviation analytics market is growing at a CAGR of 11.58% during the forecast period 2024-2033.
The market's growth will be influenced by the increasing demand for flights or air travel.
The lack of qualified and skilled personnel could hamper the market growth.
1. Introduction
1.1. Objectives of the Study
1.2. Market Definition
1.3. Research Scope
1.4. Currency
1.5. Key Target Audience
2. Research Methodology and Assumptions
3. Executive Summary
4. Premium Insights
4.1. Porter’s Five Forces Analysis
4.2. Value Chain Analysis
4.3. Top Investment Pockets
4.3.1. Market Attractiveness Analysis by Component
4.3.2. Market Attractiveness Analysis by Application
4.3.3. Market Attractiveness Analysis by Function
4.3.4. Market Attractiveness Analysis by End User
4.3.5. Market Attractiveness Analysis by Region
4.4. Industry Trends
5. Market Dynamics
5.1. Market Evaluation
5.2. Drivers
5.2.1. The increasing demand for flights or air travel
5.3. Restraints
5.3.1. The lack of qualified and skilled personnel
5.4. Opportunities
5.4.1. The use of AI and big data
5.5. Challenges
5.5.1. Concerns regarding data privacy
6. Global Aviation Analytics Market Analysis and Forecast, By Component
6.1. Segment Overview
6.2. Solutions
6.3. Services
7. Global Aviation Analytics Market Analysis and Forecast, By Application
7.1. Segment Overview
7.2. Fuel Management
7.3. Inventory Management
7.4. Revenue Management
7.5. Customer Analytics
7.6. Navigation Services
7.7. Flight Risk Management
7.8. Route Management
7.9. Fleet Management
7.10. Performance Monitoring
7.11. Supply Chain Management
7.12. Predictive Analysis
7.13. Others
8. Global Aviation Analytics Market Analysis and Forecast, By Function
8.1. Segment Overview
8.2. Sales and Marketing
8.3. Maintenance
8.4. Supply Chain
8.5. Repair and Operations
8.6. Finance
8.7. Others
9. Global Aviation Analytics Market Analysis and Forecast, By End User
9.1. Segment Overview
9.2. Original Equipment Manufacturers
9.3. Airlines
9.4. Airports
9.5. Others
10. Global Aviation Analytics Market Analysis and Forecast, By Regional Analysis
10.1. Segment Overview
10.2. North America
10.2.1. U.S.
10.2.2. Canada
10.2.3. Mexico
10.3. Europe
10.3.1. Germany
10.3.2. France
10.3.3. U.K.
10.3.4. Italy
10.3.5. Spain
10.4. Asia-Pacific
10.4.1. Japan
10.4.2. China
10.4.3. India
10.5. South America
10.5.1. Brazil
10.6. Middle East and Africa
10.6.1. UAE
10.6.2. South Africa
11. Global Aviation Analytics Market-Competitive Landscape
11.1. Overview
11.2. Market Share of Key Players in the Aviation Analytics Market
11.2.1. Global Company Market Share
11.2.2. North America Company Market Share
11.2.3. Europe Company Market Share
11.2.4. APAC Company Market Share
11.3. Competitive Situations and Trends
11.3.1. Product Launches and Developments
11.3.2. Partnerships, Collaborations, and Agreements
11.3.3. Mergers & Acquisitions
11.3.4. Expansions
12. Company Profiles
12.1. Accelya
12.1.1. Business Overview
12.1.2. Company Snapshot
12.1.3. Company Market Share Analysis
12.1.4. Company Product Portfolio
12.1.5. Recent Developments
12.1.6. SWOT Analysis
12.2. General Electric Company
12.2.1. Business Overview
12.2.2. Company Snapshot
12.2.3. Company Market Share Analysis
12.2.4. Company Product Portfolio
12.2.5. Recent Developments
12.2.6. SWOT Analysis
12.3. Honeywell International
12.3.1. Business Overview
12.3.2. Company Snapshot
12.3.3. Company Market Share Analysis
12.3.4. Company Product Portfolio
12.3.5. Recent Developments
12.3.6. SWOT Analysis
12.4. International Business Machine Corporation (IBM)
12.4.1. Business Overview
12.4.2. Company Snapshot
12.4.3. Company Market Share Analysis
12.4.4. Company Product Portfolio
12.4.5. Recent Developments
12.4.6. SWOT Analysis
12.5. Lufthansa Technik
12.5.1. Business Overview
12.5.2. Company Snapshot
12.5.3. Company Market Share Analysis
12.5.4. Company Product Portfolio
12.5.5. Recent Developments
12.5.6. SWOT Analysis
12.6. OAG Aviation Worldwide Limited
12.6.1. Business Overview
12.6.2. Company Snapshot
12.6.3. Company Market Share Analysis
12.6.4. Company Product Portfolio
12.6.5. Recent Developments
12.6.6. SWOT Analysis
12.7. Oracle Corporation
12.7.1. Business Overview
12.7.2. Company Snapshot
12.7.3. Company Market Share Analysis
12.7.4. Company Product Portfolio
12.7.5. Recent Developments
12.7.6. SWOT Analysis
12.8. Ramco Systems
12.8.1. Business Overview
12.8.2. Company Snapshot
12.8.3. Company Market Share Analysis
12.8.4. Company Product Portfolio
12.8.5. Recent Developments
12.8.6. SWOT Analysis
12.9. SAP SE
12.9.1. Business Overview
12.9.2. Company Snapshot
12.9.3. Company Market Share Analysis
12.9.4. Company Product Portfolio
12.9.5. Recent Developments
12.9.6. SWOT Analysis
12.10. SAS Institute Inc.
12.10.1. Business Overview
12.10.2. Company Snapshot
12.10.3. Company Market Share Analysis
12.10.4. Company Product Portfolio
12.10.5. Recent Developments
12.10.6. SWOT Analysis
List of Table
1. Global Aviation Analytics Market, By Component, 2020-2033 (USD Billion)
2. Global Solutions Aviation Analytics Market, By Region, 2020-2033 (USD Billion)
3. Global Services Aviation Analytics Market, By Region, 2020-2033 (USD Billion)
4. Global Aviation Analytics Market, By Application, 2020-2033 (USD Billion)
5. Global Fuel Management Aviation Analytics Market, By Region, 2020-2033 (USD Billion)
6. Global Inventory Management Aviation Analytics Market, By Region, 2020-2033 (USD Billion)
7. Global Revenue Management Aviation Analytics Market, By Region, 2020-2033 (USD Billion)
8. Global Customer Analytics Aviation Analytics Market, By Region, 2020-2033 (USD Billion)
9. Global Navigation Services Aviation Analytics Market, By Region, 2020-2033 (USD Billion)
10. Global Flight Risk Management Aviation Analytics Market, By Region, 2020-2033 (USD Billion)
11. Global Route Management Aviation Analytics Market, By Region, 2020-2033 (USD Billion)
12. Global Fleet Management Aviation Analytics Market, By Region, 2020-2033 (USD Billion)
13. Global Performance Monitoring Aviation Analytics Market, By Region, 2020-2033 (USD Billion)
14. Global Supply Chain Management Aviation Analytics Market, By Region, 2020-2033 (USD Billion)
15. Global Predictive Analysis Aviation Analytics Market, By Region, 2020-2033 (USD Billion)
16. Global Others Aviation Analytics Market, By Region, 2020-2033 (USD Billion)
17. Global Aviation Analytics Market, By Function, 2020-2033 (USD Billion)
18. Global Sales and Marketing Aviation Analytics Market, By Region, 2020-2033 (USD Billion)
19. Global Maintenance Aviation Analytics Market, By Region, 2020-2033 (USD Billion)
20. Global Supply Chain Aviation Analytics Market, By Region, 2020-2033 (USD Billion)
21. Global Repair and Operations Aviation Analytics Market, By Region, 2020-2033 (USD Billion)
22. Global Finance Aviation Analytics Market, By Region, 2020-2033 (USD Billion)
23. Global Others Aviation Analytics Market, By Region, 2020-2033 (USD Billion)
24. Global Aviation Analytics Market, By End User, 2020-2033 (USD Billion)
25. Global Original Equipment Manufacturers Aviation Analytics Market, By Region, 2020-2033 (USD Billion)
26. Global Airlines Aviation Analytics Market, By Region, 2020-2033 (USD Billion)
27. Global Airports Aviation Analytics Market, By Region, 2020-2033 (USD Billion)
28. Global Others Aviation Analytics Market, By Region, 2020-2033 (USD Billion)
29. Global Aviation Analytics Market, By Region, 2020-2033 (USD Billion)
30. North America Aviation Analytics Market, By Component, 2020-2033 (USD Billion)
31. North America Aviation Analytics Market, By Application, 2020-2033 (USD Billion)
32. North America Aviation Analytics Market, By Function, 2020-2033 (USD Billion)
33. North America Aviation Analytics Market, By End User, 2020-2033 (USD Billion)
34. U.S. Aviation Analytics Market, By Component, 2020-2033 (USD Billion)
35. U.S. Aviation Analytics Market, By Application, 2020-2033 (USD Billion)
36. U.S. Aviation Analytics Market, By Function, 2020-2033 (USD Billion)
37. U.S. Aviation Analytics Market, By End User, 2020-2033 (USD Billion)
38. Canada Aviation Analytics Market, By Component, 2020-2033 (USD Billion)
39. Canada Aviation Analytics Market, By Application, 2020-2033 (USD Billion)
40. Canada Aviation Analytics Market, By Function, 2020-2033 (USD Billion)
41. Canada Aviation Analytics Market, By End User, 2020-2033 (USD Billion)
42. Mexico Aviation Analytics Market, By Component, 2020-2033 (USD Billion)
43. Mexico Aviation Analytics Market, By Application, 2020-2033 (USD Billion)
44. Mexico Aviation Analytics Market, By Function, 2020-2033 (USD Billion)
45. Mexico Aviation Analytics Market, By End User, 2020-2033 (USD Billion)
46. Europe Aviation Analytics Market, By Component, 2020-2033 (USD Billion)
47. Europe Aviation Analytics Market, By Application, 2020-2033 (USD Billion)
48. Europe Aviation Analytics Market, By Function, 2020-2033 (USD Billion)
49. Europe Aviation Analytics Market, By End User, 2020-2033 (USD Billion)
50. Germany Aviation Analytics Market, By Component, 2020-2033 (USD Billion)
51. Germany Aviation Analytics Market, By Application, 2020-2033 (USD Billion)
52. Germany Aviation Analytics Market, By Function, 2020-2033 (USD Billion)
53. Germany Aviation Analytics Market, By End User, 2020-2033 (USD Billion)
54. France Aviation Analytics Market, By Component, 2020-2033 (USD Billion)
55. France Aviation Analytics Market, By Application, 2020-2033 (USD Billion)
56. France Aviation Analytics Market, By Function, 2020-2033 (USD Billion)
57. France Aviation Analytics Market, By End User, 2020-2033 (USD Billion)
58. U.K. Aviation Analytics Market, By Component, 2020-2033 (USD Billion)
59. U.K. Aviation Analytics Market, By Application, 2020-2033 (USD Billion)
60. U.K. Aviation Analytics Market, By Function, 2020-2033 (USD Billion)
61. U.K. Aviation Analytics Market, By End User, 2020-2033 (USD Billion)
62. Italy Aviation Analytics Market, By Component, 2020-2033 (USD Billion)
63. Italy Aviation Analytics Market, By Application, 2020-2033 (USD Billion)
64. Italy Aviation Analytics Market, By Function, 2020-2033 (USD Billion)
65. Italy Aviation Analytics Market, By End User, 2020-2033 (USD Billion)
66. Spain Aviation Analytics Market, By Component, 2020-2033 (USD Billion)
67. Spain Aviation Analytics Market, By Application, 2020-2033 (USD Billion)
68. Spain Aviation Analytics Market, By Function, 2020-2033 (USD Billion)
69. Spain Aviation Analytics Market, By End User, 2020-2033 (USD Billion)
70. Asia Pacific Aviation Analytics Market, By Component, 2020-2033 (USD Billion)
71. Asia Pacific Aviation Analytics Market, By Application, 2020-2033 (USD Billion)
72. Asia Pacific Aviation Analytics Market, By Function, 2020-2033 (USD Billion)
73. Asia Pacific Aviation Analytics Market, By End User, 2020-2033 (USD Billion)
74. Japan Aviation Analytics Market, By Component, 2020-2033 (USD Billion)
75. Japan Aviation Analytics Market, By Application, 2020-2033 (USD Billion)
76. Japan Aviation Analytics Market, By Function, 2020-2033 (USD Billion)
77. Japan Aviation Analytics Market, By End User, 2020-2033 (USD Billion)
78. China Aviation Analytics Market, By Component, 2020-2033 (USD Billion)
79. China Aviation Analytics Market, By Application, 2020-2033 (USD Billion)
80. China Aviation Analytics Market, By Function, 2020-2033 (USD Billion)
81. China Aviation Analytics Market, By End User, 2020-2033 (USD Billion)
82. India Aviation Analytics Market, By Component, 2020-2033 (USD Billion)
83. India Aviation Analytics Market, By Application, 2020-2033 (USD Billion)
84. India Aviation Analytics Market, By Function, 2020-2033 (USD Billion)
85. India Aviation Analytics Market, By End User, 2020-2033 (USD Billion)
86. South America Aviation Analytics Market, By Component, 2020-2033 (USD Billion)
87. South America Aviation Analytics Market, By Application, 2020-2033 (USD Billion)
88. South America Aviation Analytics Market, By Function, 2020-2033 (USD Billion)
89. South America Aviation Analytics Market, By End User, 2020-2033 (USD Billion)
90. Brazil Aviation Analytics Market, By Component, 2020-2033 (USD Billion)
91. Brazil Aviation Analytics Market, By Application, 2020-2033 (USD Billion)
92. Brazil Aviation Analytics Market, By Function, 2020-2033 (USD Billion)
93. Brazil Aviation Analytics Market, By End User, 2020-2033 (USD Billion)
94. Middle East and Africa Aviation Analytics Market, By Component, 2020-2033 (USD Billion)
95. Middle East and Africa Aviation Analytics Market, By Application, 2020-2033 (USD Billion)
96. Middle East and Africa Aviation Analytics Market, By Function, 2020-2033 (USD Billion)
97. Middle East and Africa Aviation Analytics Market, By End User, 2020-2033 (USD Billion)
98. UAE Aviation Analytics Market, By Component, 2020-2033 (USD Billion)
99. UAE Aviation Analytics Market, By Application, 2020-2033 (USD Billion)
100. UAE Aviation Analytics Market, By Function, 2020-2033 (USD Billion)
101. UAE Aviation Analytics Market, By End User, 2020-2033 (USD Billion)
102. South Africa Aviation Analytics Market, By Component, 2020-2033 (USD Billion)
103. South Africa Aviation Analytics Market, By Application, 2020-2033 (USD Billion)
104. South Africa Aviation Analytics Market, By Function, 2020-2033 (USD Billion)
105. South Africa Aviation Analytics Market, By End User, 2020-2033 (USD Billion)
List of Figures
1. Global Aviation Analytics Market Segmentation
2. Aviation Analytics Market: Research Methodology
3. Market Size Estimation Methodology: Bottom-Up Approach
4. Market Size Estimation Methodology: Top-Down Approach
5. Data Triangulation
6. Porter’s Five Forces Analysis
7. Value Chain Analysis
8. Global Aviation Analytics Market Attractiveness Analysis by Component
9. Global Aviation Analytics Market Attractiveness Analysis by Application
10. Global Aviation Analytics Market Attractiveness Analysis by Function
11. Global Aviation Analytics Market Attractiveness Analysis by End User
12. Global Aviation Analytics Market Attractiveness Analysis by Region
13. Global Aviation Analytics Market: Dynamics
14. Global Aviation Analytics Market Share by Component (2023 & 2033)
15. Global Aviation Analytics Market Share by Application (2023 & 2033)
16. Global Aviation Analytics Market Share by Function (2023 & 2033)
17. Global Aviation Analytics Market Share by End User (2023 & 2033)
18. Global Aviation Analytics Market Share by Regions (2023 & 2033)
19. Global Aviation Analytics Market Share by Company (2023)
This study forecasts revenue at global, regional, and country levels from 2020 to 2033. The Brainy Insights has segmented the global aviation analytics market based on below mentioned segments:
Global Aviation Analytics Market by Component:
Global Aviation Analytics Market by Application:
Global Aviation Analytics Market by Function:
Global Aviation Analytics Market by End User:
Global Aviation Analytics Market by Region:
Research has its special purpose to undertake marketing efficiently. In this competitive scenario, businesses need information across all industry verticals; the information about customer wants, market demand, competition, industry trends, distribution channels etc. This information needs to be updated regularly because businesses operate in a dynamic environment. Our organization, The Brainy Insights incorporates scientific and systematic research procedures in order to get proper market insights and industry analysis for overall business success. The analysis consists of studying the market from a miniscule level wherein we implement statistical tools which helps us in examining the data with accuracy and precision.
Our research reports feature both; quantitative and qualitative aspects for any market. Qualitative information for any market research process are fundamental because they reveal the customer needs and wants, usage and consumption for any product/service related to a specific industry. This in turn aids the marketers/investors in knowing certain perceptions of the customers. Qualitative research can enlighten about the different product concepts and designs along with unique service offering that in turn, helps define marketing problems and generate opportunities. On the other hand, quantitative research engages with the data collection process through interviews, e-mail interactions, surveys and pilot studies. Quantitative aspects for the market research are useful to validate the hypotheses generated during qualitative research method, explore empirical patterns in the data with the help of statistical tools, and finally make the market estimations.
The Brainy Insights offers comprehensive research and analysis, based on a wide assortment of factual insights gained through interviews with CXOs and global experts and secondary data from reliable sources. Our analysts and industry specialist assume vital roles in building up statistical tools and analysis models, which are used to analyse the data and arrive at accurate insights with exceedingly informative research discoveries. The data provided by our organization have proven precious to a diverse range of companies, facilitating them to address issues such as determining which products/services are the most appealing, whether or not customers use the product in the manner anticipated, the purchasing intentions of the market and many others.
Our research methodology encompasses an idyllic combination of primary and secondary initiatives. Key phases involved in this process are listed below:

The phase involves the gathering and collecting of market data and its related information with the help of different sources & research procedures.

The data procurement stage involves in data gathering and collecting through various data sources.
This stage involves in extensive research. These data sources includes:
Purchased Database: Purchased databases play a crucial role in estimating the market sizes irrespective of the domain. Our purchased database includes:
Primary Research: The Brainy Insights interacts with leading companies and experts of the concerned domain to develop the analyst team’s market understanding and expertise. It improves and substantiates every single data presented in the market reports. Primary research mainly involves in telephonic interviews, E-mail interactions and face-to-face interviews with the raw material providers, manufacturers/producers, distributors, & independent consultants. The interviews that we conduct provides valuable data on market size and industry growth trends prevailing in the market. Our organization also conducts surveys with the various industry experts in order to gain overall insights of the industry/market. For instance, in healthcare industry we conduct surveys with the pharmacists, doctors, surgeons and nurses in order to gain insights and key information of a medical product/device/equipment which the customers are going to usage. Surveys are conducted in the form of questionnaire designed by our own analyst team. Surveys plays an important role in primary research because surveys helps us to identify the key target audiences of the market. Additionally, surveys helps to identify the key target audience engaged with the market. Our survey team conducts the survey by targeting the key audience, thus gaining insights from them. Based on the perspectives of the customers, this information is utilized to formulate market strategies. Moreover, market surveys helps us to understand the current competitive situation of the industry. To be precise, our survey process typically involve with the 360 analysis of the market. This analytical process begins by identifying the prospective customers for a product or service related to the market/industry to obtain data on how a product/service could fit into customers’ lives.

Secondary Research: The secondary data sources includes information published by the on-profit organizations such as World bank, WHO, company fillings, investor presentations, annual reports, national government documents, statistical databases, blogs, articles, white papers and others. From the annual report, we analyse a company’s revenue to understand the key segment and market share of that organization in a particular region. We analyse the company websites and adopt the product mapping technique which is important for deriving the segment revenue. In the product mapping method, we select and categorize the products offered by the companies catering to domain specific market, deduce the product revenue for each of the companies so as to get overall estimation of the market size. We also source data and analyses trends based on information received from supply side and demand side intermediaries in the value chain. The supply side denotes the data gathered from supplier, distributor, wholesaler and the demand side illustrates the data gathered from the end customers for respective market domain.

The supply side for a domain specific market is analysed by:
The demand side for the market is estimated through:
In-house Library: Apart from these third-party sources, we have our in-house library of qualitative and quantitative information. Our in-house database includes market data for various industry and domains. These data are updated on regular basis as per the changing market scenario. Our library includes, historic databases, internal audit reports and archives.
Sometimes there are instances where there is no metadata or raw data available for any domain specific market. For those cases, we use our expertise to forecast and estimate the market size in order to generate comprehensive data sets. Our analyst team adopt a robust research technique in order to produce the estimates:
Data Synthesis: This stage involves the analysis & mapping of all the information obtained from the previous step. It also involves in scrutinizing the data for any discrepancy observed while data gathering related to the market. The data is collected with consideration to the heterogeneity of sources. Robust scientific techniques are in place for synthesizing disparate data sets and provide the essential contextual information that can orient market strategies. The Brainy Insights has extensive experience in data synthesis where the data passes through various stages:


Market Deduction & Formulation: The final stage comprises of assigning data points at appropriate market spaces so as to deduce feasible conclusions. Analyst perspective & subject matter expert based holistic form of market sizing coupled with industry analysis also plays a crucial role in this stage.
This stage involves in finalization of the market size and numbers that we have collected from data integration step. With data interpolation, it is made sure that there is no gap in the market data. Successful trend analysis is done by our analysts using extrapolation techniques, which provide the best possible forecasts for the market.
Data Validation & Market Feedback: Validation is the most important step in the process. Validation & re-validation via an intricately designed process helps us finalize data-points to be used for final calculations.

The Brainy Insights interacts with leading companies and experts of the concerned domain to develop the analyst team’s market understanding and expertise. It improves and substantiates every single data presented in the market reports. The data validation interview and discussion panels are typically composed of the most experienced industry members. The participants include, however, are not limited to:
Moreover, we always validate our data and findings through primary respondents from all the major regions we are working on.


Free Customization
Fortune 500 Clients
Free Yearly Update On Purchase Of Multi/Corporate License
Companies Served Till Date