- +1-315-215-1633
- sales@thebrainyinsights.com

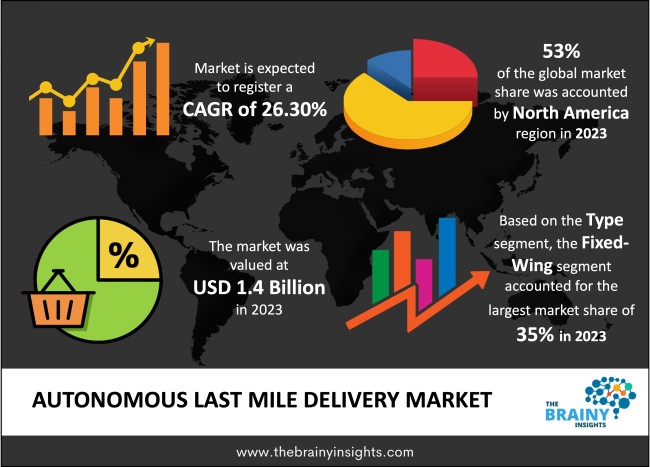
The global Autonomous Last Mile Delivery market was valued at USD 1.4 billion in 2023 and growing at a CAGR of 26.30% from 2024 to 2033. The market is expected to reach USD 14.46 billion by 2033. The rapidly growing E-Commerce industry will potentially drive the growth of the Autonomous Last Mile Delivery Market. Whereas, increased adoption of ground vehicles and advancement of technology may drive the growth of the Autonomous Last Mile Delivery Market in the period forecasted.
Autonomous Mile Delivery pertains to the final leg of the delivery process, involving the seamless transfer of goods from distribution centers to end customers. This critical phase has undergone significant evolution, manifesting in diverse types such as Fixed-Wing, Rotary-Wing, and Hybrid. Its applications span various sectors, encompassing logistics, transportation, healthcare, pharmacy, retail, and food delivery. Autonomous delivery services use automated vehicles, robots, and drones, among others, to transport goods and packages to customers with no or minimum human intervention. This type of service focuses on improving the efficiency, cost-effectiveness, and speed of the deliveries, particularly for the last mile, which is the last step when packages are delivered to the customer's door. The market growth is broadly due to advancements in technology happening in autonomous vehicles and drones, which are slowly becoming the foundation of efficient, modern and innovative delivery services. Moreover, there are sophisticated software solutions like routing software, AI-driven autonomous delivery and data-driven decision-making, among others.
The market is experiencing rapid evolution propelled by continuous company innovations, technological advancements, and a host of other pivotal factors. This confluence of factors is contributing to the market's notable growth in the foreseeable future.
Get an overview of this study by requesting a free sample
Rapidly growing E-Commerce and retail industry – With the rapidly growing e-commerce and retail industry, the market has witnessed increasing growth for Autonomous Last Mile Delivery. Various advancements such as improving faster road connectivity and 5G networks will play a potential role in driving the growth of the market in the period forecasted.
Lack of infrastructure to support aerial drones- Lack of infrastructure to support aerial drones is one factor that may restrain the growth of the Autonomous Last Mile Delivery Market in the period. To avoid high-level traffic congestion and prevent accidents Aerial drones are of necessity. However, there is a need to work on the infrastructure to support aerial drones.
Increased adoption of ground vehicles- Various innovations, and advancements for ground vehicles, may boost the growth of the Autonomous Last Mile Delivery Market in the long run. For instance: the use of Lithium-ion batteries, 5G connectivity, use of solar panels on roads to generate automatic electricity and on-road vehicles are some of the innovations/advancements boosting higher adoption of ground vehicles in the market, which may boost the growth of the Autonomous Last Mile Delivery Market in the period forecasted.
The regions analyzed for the market include North America, Europe, South America, Asia Pacific, the Middle East, and Africa. North America emerged as the largest global Autonomous last-mile delivery market, accounting for 53% of the total market. Owing to rapidly growing innovations in autonomous delivery models. Thereby leading to larger numbers of pilot projects in the model. Further, a heavy rise in the number of e-commerce sales in the region has also propelled the growth of the Autonomous Last Mile Delivery Market in the North American region. Whereas, Asia Pacific exhibits the highest growth rate in the market owing to the presence of key players in the region.
North America Region Autonomous Last Mile Delivery Market Share in 2023 - 53%
www.thebrainyinsights.com
Check the geographical analysis of this market by requesting a free sample
Fixed-Wing has dominated the market accounting for 35% of the total market. Owing to the increasing need for autonomous delivery solutions. Further, faster speed and high potential to deliver the product within time have also helped Fixed-Wing to dominate the market.
The Retail and Food delivery segment has dominated the Autonomous Last Mile Delivery market and happens to be the fastest-growing segment within the market. It has acquired the market share of 89% in 2023. Owing to its increasing use and increased adoption in metro cities and university campuses for food delivery
| Attribute | Description |
|---|---|
| Market Size | Revenue (USD Billion) |
| Market size value in 2023 | USD 1.4 Billion |
| Market size value in 2033 | USD 14.46 Billion |
| CAGR (2024 to 2033) | 26.30% |
| Historical data | 2020-2022 |
| Base Year | 2023 |
| Forecast | 2024-2033 |
| Region | The regions analyzed for the market are Asia Pacific, Europe, South America, North America, and Middle East & Africa. Furthermore, the regions are further analyzed at the country level. |
| Segments | Type, Application |
As per The Brainy Insights, the size of the autonomous last mile delivery market was valued at USD 1.4 billion in 2023 to USD 14.46 billion by 2033.
The global autonomous last mile delivery market is growing at a CAGR of 26.30% during the forecast period 2024-2033.
The North America region emerged as the largest market for the autonomous last mile delivery.
The rapidly growing e-commerce and retail industry will influence the market's growth.
1. Introduction
1.1. Objectives of the Study
1.2. Market Definition
1.3. Research Scope
1.4. Currency
1.5. Key Target Audience
2. Research Methodology and Assumptions
3. Executive Summary
4. Premium Insights
4.1. Porter’s Five Forces Analysis
4.2. Value Chain Analysis
4.3. Top Investment Pockets
4.3.1. Market Attractiveness Analysis by Type
4.3.2. Market Attractiveness Analysis by Application
4.3.3. Market Attractiveness Analysis by Region
4.4. Industry Trends
5. Market Dynamics
5.1. Market Evaluation
5.2. Drivers
5.2.1. Rapidly growing E-Commerce industry
5.3. Restraints
5.3.1. Lack of infrastructure to support aerial drones
5.4. Opportunities
5.4.1. Increased adoption of ground vehicle
5.4.2. Advancement of technology
5.5. Challenges
5.5.1. Ongoing issues concerning aerial delivery drones
6. Global Autonomous Last Mile Delivery Market Analysis and Forecast, By Type
6.1. Segment Overview
6.2. Fixed-Wing
6.3. Rotary-Wing
6.4. Hybrid
7. Global Autonomous Last Mile Delivery Market Analysis and Forecast, By Application
7.1. Segment Overview
7.2. Logistics and Transportation
7.3. Healthcare and Pharmacy
7.4. Retail and Food Delivery
8. Global Autonomous Last Mile Delivery Market Analysis and Forecast, By Regional Analysis
8.1. Segment Overview
8.2. North America
8.2.1. U.S.
8.2.2. Canada
8.2.3. Mexico
8.3. Europe
8.3.1. Germany
8.3.2. France
8.3.3. U.K.
8.3.4. Italy
8.3.5. Spain
8.4. Asia-Pacific
8.4.1. Japan
8.4.2. China
8.4.3. India
8.5. South America
8.5.1. Brazil
8.6. Middle East and Africa
8.6.1. UAE
8.6.2. South Africa
9. Global Autonomous Last Mile Delivery Market-Competitive Landscape
9.1. Overview
9.2. Market Share of Key Players in Global Autonomous Last Mile Delivery Market
9.2.1. Global Company Market Share
9.2.2. North America Company Market Share
9.2.3. Europe Company Market Share
9.2.4. APAC Company Market Share
9.3. Competitive Situations and Trends
9.3.1. Type Launches and Developments
9.3.2. Partnerships, Collaborations, and Agreements
9.3.3. Mergers & Acquisitions
9.3.4. Expansions
10. Company Profiles
10.1. Airbus
10.1.1. Business Overview
10.1.2. Company Snapshot
10.1.3. Company Market Share Analysis
10.1.4. Company Type Portfolio
10.1.5. Recent Developments
10.1.6. SWOT Analysis
10.2. Flytrex
10.2.1. Business Overview
10.2.2. Company Snapshot
10.2.3. Company Market Share Analysis
10.2.4. Company Type Portfolio
10.2.5. Recent Developments
10.2.6. SWOT Analysis
10.3. Savioke
10.3.1. Business Overview
10.3.2. Company Snapshot
10.3.3. Company Market Share Analysis
10.3.4. Company Type Portfolio
10.3.5. Recent Developments
10.3.6. SWOT Analysis
10.4. Amazon
10.4.1. Business Overview
10.4.2. Company Snapshot
10.4.3. Company Market Share Analysis
10.4.4. Company Type Portfolio
10.4.5. Recent Developments
10.4.6. SWOT Analysis
10.5. UPS
10.5.1. Business Overview
10.5.2. Company Snapshot
10.5.3. Company Market Share Analysis
10.5.4. Company Type Portfolio
10.5.5. Recent Developments
10.5.6. SWOT Analysis
10.6. DHL
10.6.1. Business Overview
10.6.2. Company Snapshot
10.6.3. Company Market Share Analysis
10.6.4. Company Type Portfolio
10.6.5. Recent Developments
10.6.6. SWOT Analysis
10.7. Nuro
10.7.1. Business Overview
10.7.2. Company Snapshot
10.7.3. Company Market Share Analysis
10.7.4. Company Type Portfolio
10.7.5. Recent Developments
10.7.6. SWOT Analysis
10.8. Navya
10.8.1. Business Overview
10.8.2. Company Snapshot
10.8.3. Company Market Share Analysis
10.8.4. Company Type Portfolio
10.8.5. Recent Developments
10.8.6. SWOT Analysis
10.9. JD.com
10.9.1. Business Overview
10.9.2. Company Snapshot
10.9.3. Company Market Share Analysis
10.9.4. Company Type Portfolio
10.9.5. Recent Developments
10.9.6. SWOT Analysis
10.10. Meituan Dianping
10.10.1. Business Overview
10.10.2. Company Snapshot
10.10.3. Company Market Share Analysis
10.10.4. Company Type Portfolio
10.10.5. Recent Developments
10.10.6. SWOT Analysis
List of Table
1. Global Autonomous Last Mile Delivery Market, By Type, 2020-2033 (USD Billion)
2. Global Fixed-Wing, Autonomous Last Mile Delivery Market, By Region, 2020-2033 (USD Billion)
3. Global Rotary-Wing, Autonomous Last Mile Delivery Market, By Region, 2020-2033 (USD Billion)
4. Global Hybrid, Autonomous Last Mile Delivery Market, By Region, 2020-2033 (USD Billion)
5. Global Autonomous Last Mile Delivery Market, By Application, 2020-2033 (USD Billion)
6. Global Logistics and Transportation, Autonomous Last Mile Delivery Market, By Region, 2020-2033 (USD Billion)
7. Global Healthcare and Pharmacy, Autonomous Last Mile Delivery Market, By Region, 2020-2033 (USD Billion)
8. Global Retail and Food delivery, Autonomous Last Mile Delivery Market, By Region, 2020-2033 (USD Billion)
9. Global Autonomous Last Mile Delivery Market, By Region, 2020-2033 (USD Billion)
10. North America Autonomous Last Mile Delivery Market, By Type, 2020-2033 (USD Billion)
11. North America Autonomous Last Mile Delivery Market, By Application, 2020-2033 (USD Billion)
12. U.S. Autonomous Last Mile Delivery Market, By Type, 2020-2033 (USD Billion)
13. U.S. Autonomous Last Mile Delivery Market, By Application, 2020-2033 (USD Billion)
14. Canada Autonomous Last Mile Delivery Market, By Type, 2020-2033 (USD Billion)
15. Canada Autonomous Last Mile Delivery Market, By Application, 2020-2033 (USD Billion)
16. Mexico Autonomous Last Mile Delivery Market, By Type, 2020-2033 (USD Billion)
17. Mexico Autonomous Last Mile Delivery Market, By Application, 2020-2033 (USD Billion)
18. Europe Autonomous Last Mile Delivery Market, By Type, 2020-2033 (USD Billion)
19. Europe Autonomous Last Mile Delivery Market, By Application, 2020-2033 (USD Billion)
20. Germany Autonomous Last Mile Delivery Market, By Type, 2020-2033 (USD Billion)
21. Germany Autonomous Last Mile Delivery Market, By Application, 2020-2033 (USD Billion)
22. France Autonomous Last Mile Delivery Market, By Type, 2020-2033 (USD Billion)
23. France Autonomous Last Mile Delivery Market, By Application, 2020-2033 (USD Billion)
24. U.K. Autonomous Last Mile Delivery Market, By Type, 2020-2033 (USD Billion)
25. U.K. Autonomous Last Mile Delivery Market, By Application, 2020-2033 (USD Billion)
26. Italy Autonomous Last Mile Delivery Market, By Type, 2020-2033 (USD Billion)
27. Italy Autonomous Last Mile Delivery Market, By Application, 2020-2033 (USD Billion)
28. Spain Autonomous Last Mile Delivery Market, By Type, 2020-2033 (USD Billion)
29. Spain Autonomous Last Mile Delivery Market, By Application, 2020-2033 (USD Billion)
30. Asia Pacific Autonomous Last Mile Delivery Market, By Type, 2020-2033 (USD Billion)
31. Asia Pacific Autonomous Last Mile Delivery Market, By Application, 2020-2033 (USD Billion)
32. Japan Autonomous Last Mile Delivery Market, By Type, 2020-2033 (USD Billion)
33. Japan Autonomous Last Mile Delivery Market, By Application, 2020-2033 (USD Billion)
34. China Autonomous Last Mile Delivery Market, By Type, 2020-2033 (USD Billion)
35. China Autonomous Last Mile Delivery Market, By Application, 2020-2033 (USD Billion)
36. India Autonomous Last Mile Delivery Market, By Type, 2020-2033 (USD Billion)
37. India Autonomous Last Mile Delivery Market, By Application, 2020-2033 (USD Billion)
38. South America Autonomous Last Mile Delivery Market, By Type, 2020-2033 (USD Billion)
39. South America Autonomous Last Mile Delivery Market, By Application, 2020-2033 (USD Billion)
40. Brazil Autonomous Last Mile Delivery Market, By Type, 2020-2033 (USD Billion)
41. Brazil Autonomous Last Mile Delivery Market, By Application, 2020-2033 (USD Billion)
42. Middle East and Africa Autonomous Last Mile Delivery Market, By Type, 2020-2033 (USD Billion)
43. Middle East and Africa Autonomous Last Mile Delivery Market, By Application, 2020-2033 (USD Billion)
44. UAE Autonomous Last Mile Delivery Market, By Type, 2020-2033 (USD Billion)
45. UAE Autonomous Last Mile Delivery Market, By Application, 2020-2033 (USD Billion)
46. South Africa Autonomous Last Mile Delivery Market, By Type, 2020-2033 (USD Billion)
47. South Africa Autonomous Last Mile Delivery Market, By Application, 2020-2033 (USD Billion)
List of Figures
1. Global Autonomous Last Mile Delivery Market Segmentation
2. Global Autonomous Last Mile Delivery Market: Research Methodology
3. Market Size Estimation Methodology: Bottom-Up Approach
4. Market Size Estimation Methodology: Top-Down Approach
5. Data Triangulation
6. Porter’s Five Forces Analysis
7. Value Chain Analysis
8. Global Autonomous Last Mile Delivery Market Attractiveness Analysis by Type
9. Global Autonomous Last Mile Delivery Market Attractiveness Analysis by Application
10. Global Autonomous Last Mile Delivery Market Attractiveness Analysis by Region
11. Global Autonomous Last Mile Delivery Market: Dynamics
12. Global Autonomous Last Mile Delivery Market Share by Type (2023 & 2033)
13. Global Autonomous Last Mile Delivery Market Share by Application (2023 & 2033)
14. Global Autonomous Last Mile Delivery Market Share by Regions (2023 & 2033)
15. Global Autonomous Last Mile Delivery Market Share by Company (2023)
This study forecasts revenue at global, regional, and country levels from 2020 to 2033. The Brainy Insights has segmented the global autonomous last mile delivery market based on below-mentioned segments:
Global Autonomous Last Mile Delivery Market by Type:
Global Autonomous Last Mile Delivery Market by Application:
Global Autonomous Last Mile Delivery Market by Region:
Research has its special purpose to undertake marketing efficiently. In this competitive scenario, businesses need information across all industry verticals; the information about customer wants, market demand, competition, industry trends, distribution channels etc. This information needs to be updated regularly because businesses operate in a dynamic environment. Our organization, The Brainy Insights incorporates scientific and systematic research procedures in order to get proper market insights and industry analysis for overall business success. The analysis consists of studying the market from a miniscule level wherein we implement statistical tools which helps us in examining the data with accuracy and precision.
Our research reports feature both; quantitative and qualitative aspects for any market. Qualitative information for any market research process are fundamental because they reveal the customer needs and wants, usage and consumption for any product/service related to a specific industry. This in turn aids the marketers/investors in knowing certain perceptions of the customers. Qualitative research can enlighten about the different product concepts and designs along with unique service offering that in turn, helps define marketing problems and generate opportunities. On the other hand, quantitative research engages with the data collection process through interviews, e-mail interactions, surveys and pilot studies. Quantitative aspects for the market research are useful to validate the hypotheses generated during qualitative research method, explore empirical patterns in the data with the help of statistical tools, and finally make the market estimations.
The Brainy Insights offers comprehensive research and analysis, based on a wide assortment of factual insights gained through interviews with CXOs and global experts and secondary data from reliable sources. Our analysts and industry specialist assume vital roles in building up statistical tools and analysis models, which are used to analyse the data and arrive at accurate insights with exceedingly informative research discoveries. The data provided by our organization have proven precious to a diverse range of companies, facilitating them to address issues such as determining which products/services are the most appealing, whether or not customers use the product in the manner anticipated, the purchasing intentions of the market and many others.
Our research methodology encompasses an idyllic combination of primary and secondary initiatives. Key phases involved in this process are listed below:

The phase involves the gathering and collecting of market data and its related information with the help of different sources & research procedures.

The data procurement stage involves in data gathering and collecting through various data sources.
This stage involves in extensive research. These data sources includes:
Purchased Database: Purchased databases play a crucial role in estimating the market sizes irrespective of the domain. Our purchased database includes:
Primary Research: The Brainy Insights interacts with leading companies and experts of the concerned domain to develop the analyst team’s market understanding and expertise. It improves and substantiates every single data presented in the market reports. Primary research mainly involves in telephonic interviews, E-mail interactions and face-to-face interviews with the raw material providers, manufacturers/producers, distributors, & independent consultants. The interviews that we conduct provides valuable data on market size and industry growth trends prevailing in the market. Our organization also conducts surveys with the various industry experts in order to gain overall insights of the industry/market. For instance, in healthcare industry we conduct surveys with the pharmacists, doctors, surgeons and nurses in order to gain insights and key information of a medical product/device/equipment which the customers are going to usage. Surveys are conducted in the form of questionnaire designed by our own analyst team. Surveys plays an important role in primary research because surveys helps us to identify the key target audiences of the market. Additionally, surveys helps to identify the key target audience engaged with the market. Our survey team conducts the survey by targeting the key audience, thus gaining insights from them. Based on the perspectives of the customers, this information is utilized to formulate market strategies. Moreover, market surveys helps us to understand the current competitive situation of the industry. To be precise, our survey process typically involve with the 360 analysis of the market. This analytical process begins by identifying the prospective customers for a product or service related to the market/industry to obtain data on how a product/service could fit into customers’ lives.

Secondary Research: The secondary data sources includes information published by the on-profit organizations such as World bank, WHO, company fillings, investor presentations, annual reports, national government documents, statistical databases, blogs, articles, white papers and others. From the annual report, we analyse a company’s revenue to understand the key segment and market share of that organization in a particular region. We analyse the company websites and adopt the product mapping technique which is important for deriving the segment revenue. In the product mapping method, we select and categorize the products offered by the companies catering to domain specific market, deduce the product revenue for each of the companies so as to get overall estimation of the market size. We also source data and analyses trends based on information received from supply side and demand side intermediaries in the value chain. The supply side denotes the data gathered from supplier, distributor, wholesaler and the demand side illustrates the data gathered from the end customers for respective market domain.

The supply side for a domain specific market is analysed by:
The demand side for the market is estimated through:
In-house Library: Apart from these third-party sources, we have our in-house library of qualitative and quantitative information. Our in-house database includes market data for various industry and domains. These data are updated on regular basis as per the changing market scenario. Our library includes, historic databases, internal audit reports and archives.
Sometimes there are instances where there is no metadata or raw data available for any domain specific market. For those cases, we use our expertise to forecast and estimate the market size in order to generate comprehensive data sets. Our analyst team adopt a robust research technique in order to produce the estimates:
Data Synthesis: This stage involves the analysis & mapping of all the information obtained from the previous step. It also involves in scrutinizing the data for any discrepancy observed while data gathering related to the market. The data is collected with consideration to the heterogeneity of sources. Robust scientific techniques are in place for synthesizing disparate data sets and provide the essential contextual information that can orient market strategies. The Brainy Insights has extensive experience in data synthesis where the data passes through various stages:


Market Deduction & Formulation: The final stage comprises of assigning data points at appropriate market spaces so as to deduce feasible conclusions. Analyst perspective & subject matter expert based holistic form of market sizing coupled with industry analysis also plays a crucial role in this stage.
This stage involves in finalization of the market size and numbers that we have collected from data integration step. With data interpolation, it is made sure that there is no gap in the market data. Successful trend analysis is done by our analysts using extrapolation techniques, which provide the best possible forecasts for the market.
Data Validation & Market Feedback: Validation is the most important step in the process. Validation & re-validation via an intricately designed process helps us finalize data-points to be used for final calculations.

The Brainy Insights interacts with leading companies and experts of the concerned domain to develop the analyst team’s market understanding and expertise. It improves and substantiates every single data presented in the market reports. The data validation interview and discussion panels are typically composed of the most experienced industry members. The participants include, however, are not limited to:
Moreover, we always validate our data and findings through primary respondents from all the major regions we are working on.


Free Customization
Fortune 500 Clients
Free Yearly Update On Purchase Of Multi/Corporate License
Companies Served Till Date