- +1-315-215-1633
- sales@thebrainyinsights.com

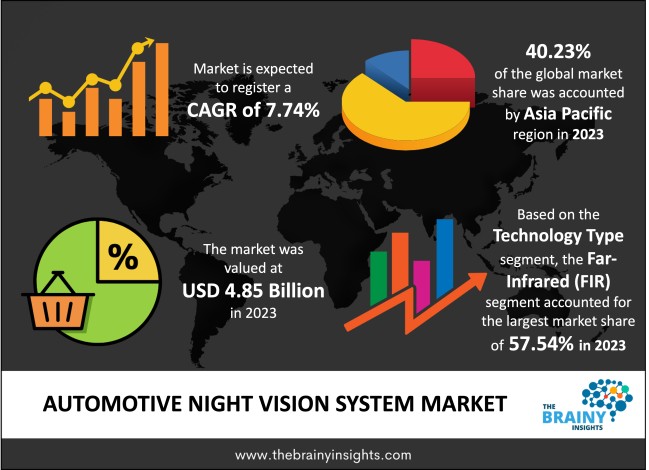
The global automotive night vision system market is expected to reach USD 10.22 billion by 2033, at a CAGR of 7.74% from 2024 to 2033. The Automotive night vision system market is growing owing to the increasing awareness of road safety and the rise in the sale of luxury cars. Growth in awareness regarding road safety by regulators and consumers has increased the demand for advanced safety systems, like night vision systems. These systems help improve road safety in poor visibility conditions. All these factors eventually drive the market.
The Automotive night vision system is a setup that uses the thermographic camera, which is a device that creates images with the help of infrared radiation, like a regular camera that forms an image using visible light to intensify a driver's vision and get a distance view in poor weather or darkness beyond the reach of the vehicle's headlights. Usually, these systems are provided in certain premium vehicles as special equipment. This system is based on night vision devices (NVD), which generally signifies any technically enhanced optical device works in three modes- active illumination, image enhancement, and thermal imaging. The Automotive night vision system collaborates with NVDs such as Lidar, GPS, Radar, and infrared cameras, among others, to sense and identify objects. The Automotive night vision system is divided into two types- active and passive night vision systems. The active night vision system uses an infrared light source generated inside the car to illuminate the road with light not visible to humans. The passive night vision systems do not widely use the infrared light source; instead, they use the thermal radiation emitted by the thermographic camera objects.
Get an overview of this study by requesting a free sample
The Automotive night vision system is regarded as an advanced safety system. The system increases the driver's visibility at night and is very helpful in foggy weather. This system has reduced the rate of automotive accidents, and both the drivers and passengers are safer than before. There is an increase in awareness about the safety of drivers and passengers by the government, so people prefer this safety method. The significant factor that is driving the market growth of the automotive night vision system is the increase in demand for advanced in-vehicle safety features such as the Advanced Driver Assistance System (ADAS) and increased vehicle production.
The inability of the automotive night vision system to work appropriately in dense weather conditions and the lack of proper handling of the system are significant issues that are restraining the global automotive night vision system market during the forecast period. The system performance, to some extent, shows low vehicle detection rates. Another restraining factor of this system is that the system cannot display the images at an accurate time so that the drivers can circumvent the diversion from road traffic, hampering the market's growth.
The front light systems in the vehicles also produce visibility to some range, so the manufacturers of this system are planning to combine the two methods to improve and make the system function more efficiently. This planning is expected to provide a lucrative opportunity for the automotive night vision system market to progress. Drivers now find relief in driving in foggy weather with better visibility than before; it was considered very dangerous to move on the roads on vehicles in harsh weather conditions.
The major challenge that the automotive night vision system market faces in growing is the high cost of installing the system. The top market players in the automotive night vision system industry are trying to introduce more innovative products, but the price in the process seems to be very high. The equipment like the camera and other devices are costly, but even after that, the system is sometimes unable to work in bad weather conditions. After the Covid-19 outbreak and with the rise in economic crisis, the automotive night vision system manufacturing companies faced a considerable loss.
The global automotive night vision system market has been segmented based on technology type, display type, component type, and regions.
The regions analyzed for the market include North America, Europe, South America, Asia Pacific, the Middle East, and Africa. The Asia Pacific region emerged as the largest market for the global automotive night vision system market, with a 40.23% share of the market revenue in 2023.
Asia Pacific region currently dominates the automotive night vision system market as this region comprises some fastest-growing economies in the world, including China and India. The rising demand for heavy commercial vehicles and high-end luxury vehicles in this region propels the market's growth. China is a prominent leader in the automotive sector, which adds impetus to the market's growth. Along with this, the region also has the presence of significant market players, which adds to the growth of the automotive night vision system market in the Asia Pacific region.
Asia Pacific Region Automotive Night Vision System Market Share in 2023 - 40.23%
www.thebrainyinsights.com
Check the geographical analysis of this market by requesting a free sample
The key players are now concentrating on implementing strategies such as adopting new technology, product innovations, mergers & acquisitions, joint venture, alliances, and partnerships to improve their market position in the global automotive night vision system market industry.
As per The Brainy Insights, the size of the automotive night vision system market was valued at USD 4.85 billion in 2023 to USD 10.22 billion by 2033.
The global automotive night vision systems market is growing at a CAGR of 7.74% during the forecast period 2024-2033.
The Asia Pacific emerged as the largest market for automotive night vision systems.
The market's growth will be influenced by the advanced safety features.
High price and the pandemic outbreak could hamper market growth.
Coupling of the front lights and the night vision system to work efficiently will provide huge opportunities to the market.
Key players are Audi AG, Autoliv Inc, Bendix Commercial Vehicles Systems, Continental AG, Daimler AG, Delphi Automotive Plc., DENSO CORPORATION, FLIR Systems, Inc., Omron Corporation, and Robert Bosch GmbH.
1. Introduction
1.1. Objectives of the Study
1.2. Market Definition
1.3. Research Scope
1.4. Currency
1.5. Key Target Audience
2. Research Methodology and Assumptions
3. Executive Summary
4. Premium Insights
4.1. Porter’s Five Forces Analysis
4.2. Value Chain Analysis
4.3. Top Investment Pockets
4.3.1. Market Attractiveness Analysis By Technology Type
4.3.2. Market Attractiveness Analysis By Display Type
4.3.3. Market Attractiveness Analysis By Component Type
4.3.4. Market Attractiveness Analysis By Region
4.4. Industry Trends
5. Market Dynamics
5.1. Market Evaluation
5.2. Drivers
5.2.1. The advanced safety features
5.3. Restraints
5.3.1. The lack of proper functioning in dense weather
5.4. Opportunities
5.4.1. Coupling of the front lights and the night vision system to work efficiently
5.5. Challenges
5.5.1. High price and the pandemic outbreak
6. Global Automotive Night Vision System Market Analysis and Forecast, By Technology type
6.1. Segment Overview
6.2. Far Infrared (FIR)
6.3. Near-Infrared (NIR)
7. Global Automotive Night Vision System Market Analysis and Forecast, By Display type
7.1. Segment Overview
7.2. Instrument Cluster
7.3. Navigation System
7.4. HUD
8. Global Automotive Night Vision System Market Analysis and Forecast, By Component Type
8.1. Segment Overview
8.2. Night Vision Camera
8.3. Sensor
8.4. Display Unit
8.5. Controlling Unit
8.6. Other Components
9. Global Automotive Night Vision System Market Analysis and Forecast, By Regional Analysis
9.1. Segment Overview
9.2. North America
9.2.1. U.S.
9.2.2. Canada
9.2.3. Mexico
9.3. Europe
9.3.1. Germany
9.3.2. France
9.3.3. U.K.
9.3.4. Italy
9.3.5. Spain
9.4. Asia-Pacific
9.4.1. Japan
9.4.2. China
9.4.3. India
9.5. South America
9.5.1. Brazil
9.6. Middle East and Africa
9.6.1. UAE
9.6.2. South Africa
10. Global Automotive Night Vision System Market-Competitive Landscape
10.1. Overview
10.2. Market Share of Key Players in the Automotive Night Vision System Market
10.2.1. Global Company Market Share
10.2.2. North America Company Market Share
10.2.3. Europe Company Market Share
10.2.4. APAC Company Market Share
10.3. Competitive Situations and Trends
10.3.1. Product Launches and Developments
10.3.2. Partnerships, Collaborations, and Agreements
10.3.3. Mergers & Acquisitions
10.3.4. Expansions
11. Company Profiles
11.1. Audi AG
11.1.1. Business Overview
11.1.2. Company Snapshot
11.1.3. Company Market Share Analysis
11.1.4. Company Component Portfolio
11.1.5. Recent Developments
11.1.6. SWOT Analysis
11.2. Autoliv Inc
11.2.1. Business Overview
11.2.2. Company Snapshot
11.2.3. Company Market Share Analysis
11.2.4. Company Component Portfolio
11.2.5. Recent Developments
11.2.6. SWOT Analysis
11.3. Bendix Commercial Vehicles Systems
11.3.1. Business Overview
11.3.2. Company Snapshot
11.3.3. Company Market Share Analysis
11.3.4. Company Component Portfolio
11.3.5. Recent Developments
11.3.6. SWOT Analysis
11.4. Continental AG
11.4.1. Business Overview
11.4.2. Company Snapshot
11.4.3. Company Market Share Analysis
11.4.4. Company Component Portfolio
11.4.5. Recent Developments
11.4.6. SWOT Analysis
11.5. Daimler AG
11.5.1. Business Overview
11.5.2. Company Snapshot
11.5.3. Company Market Share Analysis
11.5.4. Company Component Portfolio
11.5.5. Recent Developments
11.5.6. SWOT Analysis
11.6. Delphi Automotive Plc.
11.6.1. Business Overview
11.6.2. Company Snapshot
11.6.3. Company Market Share Analysis
11.6.4. Company Component Portfolio
11.6.5. Recent Developments
11.6.6. SWOT Analysis
11.7. DENSO CORPORATION
11.7.1. Business Overview
11.7.2. Company Snapshot
11.7.3. Company Market Share Analysis
11.7.4. Company Component Portfolio
11.7.5. Recent Developments
11.7.6. SWOT Analysis
11.8. FLIR Systems, Inc.
11.8.1. Business Overview
11.8.2. Company Snapshot
11.8.3. Company Market Share Analysis
11.8.4. Company Component Portfolio
11.8.5. Recent Developments
11.8.6. SWOT Analysis
11.9. Omron Corporation
11.9.1. Business Overview
11.9.2. Company Snapshot
11.9.3. Company Market Share Analysis
11.9.4. Company Component Portfolio
11.9.5. Recent Developments
11.9.6. SWOT Analysis
11.10. Robert Bosch GmbH
11.10.1. Business Overview
11.10.2. Company Snapshot
11.10.3. Company Market Share Analysis
11.10.4. Company Component Portfolio
11.10.5. Recent Developments
11.10.6. SWOT Analysis
List of Table
1. Global Automotive Night Vision System Market, By Technology Type, 2020-2033 (USD Billion)
2. Global Far Infrared (FIR) Automotive Night Vision System Market, By Region, 2020-2033 (USD Billion)
3. Global Near Infrared (NIR) Automotive Night Vision System Market, By Region, 2020-2033 (USD Billion)
4. Global Automotive Night Vision System Market, By Display Type, 2020-2033 (USD Billion)
5. Global Instrument Cluster Automotive Night Vision System Market, By Region, 2020-2033 (USD Billion)
6. Global Navigation System Automotive Night Vision System Market, By Region, 2020-2033 (USD Billion)
7. Global HUD Automotive Night Vision System Market, By Region, 2020-2033 (USD Billion)
8. Global Automotive Night Vision System Market, By Component Type, 2020-2033 (USD Billion)
9. Global Night Vision Camera Automotive Night Vision System Market, By Region, 2020-2033 (USD Billion)
10. Global Sensor Automotive Night Vision System Market, By Region, 2020-2033 (USD Billion)
11. Global Display Unit Automotive Night Vision System Market, By Region, 2020-2033 (USD Billion)
12. Global Controlling Unit Automotive Night Vision System Market, By Region, 2020-2033 (USD Billion)
13. Global Other Component Automotive Night Vision System Market, By Region, 2020-2033 (USD Billion)
14. Global Automotive Night Vision System Market, By Region, 2020-2033 (USD Billion)
15. North America Automotive Night Vision System Market, By Technology Type, 2020-2033 (USD Billion)
16. North America Automotive Night Vision System Market, By Display Type, 2020-2033 (USD Billion)
17. North America Automotive Night Vision System Market, By Component Type, 2020-2033 (USD Billion)
18. U.S. Automotive Night Vision System Market, By Technology Type, 2020-2033 (USD Billion)
19. U.S. Automotive Night Vision System Market, By Display Type, 2020-2033 (USD Billion)
20. U.S. Automotive Night Vision System Market, By Component Type, 2020-2033 (USD Billion)
21. Canada Automotive Night Vision System Market, By Technology Type, 2020-2033 (USD Billion)
22. Canada Automotive Night Vision System Market, By Display Type, 2020-2033 (USD Billion)
23. Canada Automotive Night Vision System Market, By Component Type, 2020-2033 (USD Billion)
24. Mexico Automotive Night Vision System Market, By Technology Type, 2020-2033 (USD Billion)
25. Mexico Automotive Night Vision System Market, By Display Type, 2020-2033 (USD Billion)
26. Mexico Automotive Night Vision System Market, By Component Type, 2020-2033 (USD Billion)
27. Europe Automotive Night Vision System Market, By Technology Type, 2020-2033 (USD Billion)
28. Europe Automotive Night Vision System Market, By Display Type, 2020-2033 (USD Billion)
29. Europe Automotive Night Vision System Market, By Component Type, 2020-2033 (USD Billion)
30. Germany Automotive Night Vision System Market, By Technology Type, 2020-2033 (USD Billion)
31. Germany Automotive Night Vision System Market, By Display Type, 2020-2033 (USD Billion)
32. Germany Automotive Night Vision System Market, By Component Type, 2020-2033 (USD Billion)
33. France Automotive Night Vision System Market, By Technology Type, 2020-2033 (USD Billion)
34. France Automotive Night Vision System Market, By Display Type, 2020-2033 (USD Billion)
35. France Automotive Night Vision System Market, By Component Type, 2020-2033 (USD Billion)
36. U.K. Automotive Night Vision System Market, By Technology Type, 2020-2033 (USD Billion)
37. U.K. Automotive Night Vision System Market, By Display Type, 2020-2033 (USD Billion)
38. U.K. Automotive Night Vision System Market, By Component Type, 2020-2033 (USD Billion)
39. Italy Automotive Night Vision System Market, By Technology Type, 2020-2033 (USD Billion)
40. Italy Automotive Night Vision System Market, By Display Type, 2020-2033 (USD Billion)
41. Italy Automotive Night Vision System Market, By Component Type, 2020-2033 (USD Billion)
42. Spain Automotive Night Vision System Market, By Technology Type, 2020-2033 (USD Billion)
43. Spain Automotive Night Vision System Market, By Display Type, 2020-2033 (USD Billion)
44. Spain Automotive Night Vision System Market, By Component Type, 2020-2033 (USD Billion)
45. Asia Pacific Automotive Night Vision System Market, By Technology Type, 2020-2033 (USD Billion)
46. Asia Pacific Automotive Night Vision System Market, By Display Type, 2020-2033 (USD Billion)
47. Asia Pacific Automotive Night Vision System Market, By Component Type, 2020-2033 (USD Billion)
48. Japan Automotive Night Vision System Market, By Technology Type, 2020-2033 (USD Billion)
49. Japan Automotive Night Vision System Market, By Display Type, 2020-2033 (USD Billion)
50. Japan Automotive Night Vision System Market, By Component Type, 2020-2033 (USD Billion)
51. China Automotive Night Vision System Market, By Technology Type, 2020-2033 (USD Billion)
52. China Automotive Night Vision System Market, By Display Type, 2020-2033 (USD Billion)
53. China Automotive Night Vision System Market, By Component Type, 2020-2033 (USD Billion)
54. India Automotive Night Vision System Market, By Technology Type, 2020-2033 (USD Billion)
55. India Automotive Night Vision System Market, By Display Type, 2020-2033 (USD Billion)
56. India Automotive Night Vision System Market, By Component Type, 2020-2033 (USD Billion)
57. South America Automotive Night Vision System Market, By Technology Type, 2020-2033 (USD Billion)
58. South America Automotive Night Vision System Market, By Display Type, 2020-2033 (USD Billion)
59. South America Automotive Night Vision System Market, By Component Type, 2020-2033 (USD Billion)
60. Brazil Automotive Night Vision System Market, By Technology Type, 2020-2033 (USD Billion)
61. Brazil Automotive Night Vision System Market, By Display Type, 2020-2033 (USD Billion)
62. Brazil Automotive Night Vision System Market, By Component Type, 2020-2033 (USD Billion)
63. Middle East and Africa Automotive Night Vision System Market, By Technology Type, 2020-2033 (USD Billion)
64. Middle East and Africa Automotive Night Vision System Market, By Display Type, 2020-2033 (USD Billion)
65. Middle East and Africa Automotive Night Vision System Market, By Component Type, 2020-2033 (USD Billion)
66. UAE Automotive Night Vision System Market, By Technology Type, 2020-2033 (USD Billion)
67. UAE Automotive Night Vision System Market, By Display Type, 2020-2033 (USD Billion)
68. UAE Automotive Night Vision System Market, By Component Type, 2020-2033 (USD Billion)
69. South Africa Automotive Night Vision System Market, By Technology Type, 2020-2033 (USD Billion)
70. South Africa Automotive Night Vision System Market, By Display Type, 2020-2033 (USD Billion)
71. South Africa Automotive Night Vision System Market, By Component Type, 2020-2033 (USD Billion)
List of Figures
1. Global Automotive Night Vision System Market Segmentation
2. Automotive Night Vision System Market: Research Methodology
3. Market Size Estimation Methodology: Bottom-Up Approach
4. Market Size Estimation Methodology: Top-Down Approach
5. Data Triangulation
6. Porter’s Five Forces Analysis
7. Value Chain Analysis
8. Global Automotive Night Vision System Market Attractiveness Analysis By Technology type
9. Global Automotive Night Vision System Market Attractiveness Analysis By Display type
10. Global Automotive Night Vision System Market Attractiveness Analysis By Component Type
11. Global Automotive Night Vision System Market Attractiveness Analysis By Region
12. Global Automotive Night Vision System Market: Dynamics
13. Global Automotive Night Vision System Market Share by Technology Type (2023 & 2033)
14. Global Automotive Night Vision System Market Share by Display Type (2023 & 2033)
15. Global Automotive Night Vision System Market Share by Component Type (2023 & 2033)
16. Global Automotive Night Vision System Market Share by Regions (2023 & 2033)
17. Global Automotive Night Vision System Market Share by Company (2023)
This study forecasts revenue at global, regional, and country levels from 2020 to 2033. The Brainy Insights has segmented the global automotive night vision system market based on the below-mentioned segments:
Global Automotive Night Vision System Market by Technology Type:
Global Automotive Night Vision System Market by Display Type:
Global Automotive Night Vision System Market by Component Type:
Global Automotive Night Vision System Market by Region:
Research has its special purpose to undertake marketing efficiently. In this competitive scenario, businesses need information across all industry verticals; the information about customer wants, market demand, competition, industry trends, distribution channels etc. This information needs to be updated regularly because businesses operate in a dynamic environment. Our organization, The Brainy Insights incorporates scientific and systematic research procedures in order to get proper market insights and industry analysis for overall business success. The analysis consists of studying the market from a miniscule level wherein we implement statistical tools which helps us in examining the data with accuracy and precision.
Our research reports feature both; quantitative and qualitative aspects for any market. Qualitative information for any market research process are fundamental because they reveal the customer needs and wants, usage and consumption for any product/service related to a specific industry. This in turn aids the marketers/investors in knowing certain perceptions of the customers. Qualitative research can enlighten about the different product concepts and designs along with unique service offering that in turn, helps define marketing problems and generate opportunities. On the other hand, quantitative research engages with the data collection process through interviews, e-mail interactions, surveys and pilot studies. Quantitative aspects for the market research are useful to validate the hypotheses generated during qualitative research method, explore empirical patterns in the data with the help of statistical tools, and finally make the market estimations.
The Brainy Insights offers comprehensive research and analysis, based on a wide assortment of factual insights gained through interviews with CXOs and global experts and secondary data from reliable sources. Our analysts and industry specialist assume vital roles in building up statistical tools and analysis models, which are used to analyse the data and arrive at accurate insights with exceedingly informative research discoveries. The data provided by our organization have proven precious to a diverse range of companies, facilitating them to address issues such as determining which products/services are the most appealing, whether or not customers use the product in the manner anticipated, the purchasing intentions of the market and many others.
Our research methodology encompasses an idyllic combination of primary and secondary initiatives. Key phases involved in this process are listed below:

The phase involves the gathering and collecting of market data and its related information with the help of different sources & research procedures.

The data procurement stage involves in data gathering and collecting through various data sources.
This stage involves in extensive research. These data sources includes:
Purchased Database: Purchased databases play a crucial role in estimating the market sizes irrespective of the domain. Our purchased database includes:
Primary Research: The Brainy Insights interacts with leading companies and experts of the concerned domain to develop the analyst team’s market understanding and expertise. It improves and substantiates every single data presented in the market reports. Primary research mainly involves in telephonic interviews, E-mail interactions and face-to-face interviews with the raw material providers, manufacturers/producers, distributors, & independent consultants. The interviews that we conduct provides valuable data on market size and industry growth trends prevailing in the market. Our organization also conducts surveys with the various industry experts in order to gain overall insights of the industry/market. For instance, in healthcare industry we conduct surveys with the pharmacists, doctors, surgeons and nurses in order to gain insights and key information of a medical product/device/equipment which the customers are going to usage. Surveys are conducted in the form of questionnaire designed by our own analyst team. Surveys plays an important role in primary research because surveys helps us to identify the key target audiences of the market. Additionally, surveys helps to identify the key target audience engaged with the market. Our survey team conducts the survey by targeting the key audience, thus gaining insights from them. Based on the perspectives of the customers, this information is utilized to formulate market strategies. Moreover, market surveys helps us to understand the current competitive situation of the industry. To be precise, our survey process typically involve with the 360 analysis of the market. This analytical process begins by identifying the prospective customers for a product or service related to the market/industry to obtain data on how a product/service could fit into customers’ lives.

Secondary Research: The secondary data sources includes information published by the on-profit organizations such as World bank, WHO, company fillings, investor presentations, annual reports, national government documents, statistical databases, blogs, articles, white papers and others. From the annual report, we analyse a company’s revenue to understand the key segment and market share of that organization in a particular region. We analyse the company websites and adopt the product mapping technique which is important for deriving the segment revenue. In the product mapping method, we select and categorize the products offered by the companies catering to domain specific market, deduce the product revenue for each of the companies so as to get overall estimation of the market size. We also source data and analyses trends based on information received from supply side and demand side intermediaries in the value chain. The supply side denotes the data gathered from supplier, distributor, wholesaler and the demand side illustrates the data gathered from the end customers for respective market domain.

The supply side for a domain specific market is analysed by:
The demand side for the market is estimated through:
In-house Library: Apart from these third-party sources, we have our in-house library of qualitative and quantitative information. Our in-house database includes market data for various industry and domains. These data are updated on regular basis as per the changing market scenario. Our library includes, historic databases, internal audit reports and archives.
Sometimes there are instances where there is no metadata or raw data available for any domain specific market. For those cases, we use our expertise to forecast and estimate the market size in order to generate comprehensive data sets. Our analyst team adopt a robust research technique in order to produce the estimates:
Data Synthesis: This stage involves the analysis & mapping of all the information obtained from the previous step. It also involves in scrutinizing the data for any discrepancy observed while data gathering related to the market. The data is collected with consideration to the heterogeneity of sources. Robust scientific techniques are in place for synthesizing disparate data sets and provide the essential contextual information that can orient market strategies. The Brainy Insights has extensive experience in data synthesis where the data passes through various stages:


Market Deduction & Formulation: The final stage comprises of assigning data points at appropriate market spaces so as to deduce feasible conclusions. Analyst perspective & subject matter expert based holistic form of market sizing coupled with industry analysis also plays a crucial role in this stage.
This stage involves in finalization of the market size and numbers that we have collected from data integration step. With data interpolation, it is made sure that there is no gap in the market data. Successful trend analysis is done by our analysts using extrapolation techniques, which provide the best possible forecasts for the market.
Data Validation & Market Feedback: Validation is the most important step in the process. Validation & re-validation via an intricately designed process helps us finalize data-points to be used for final calculations.

The Brainy Insights interacts with leading companies and experts of the concerned domain to develop the analyst team’s market understanding and expertise. It improves and substantiates every single data presented in the market reports. The data validation interview and discussion panels are typically composed of the most experienced industry members. The participants include, however, are not limited to:
Moreover, we always validate our data and findings through primary respondents from all the major regions we are working on.


Free Customization
Fortune 500 Clients
Free Yearly Update On Purchase Of Multi/Corporate License
Companies Served Till Date