- +1-315-215-1633
- sales@thebrainyinsights.com

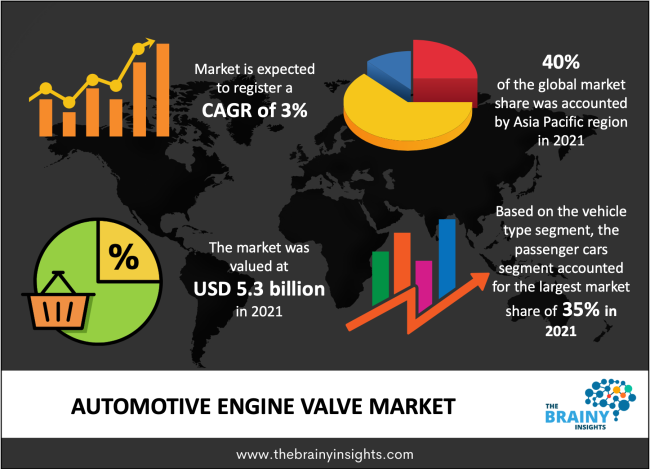
The automotive engine valve market was estimated at around USD 5.3 billion in 2021, growing at a CAGR of nearly 3% during 2022-2030. The market is projected to reach approximately USD 6.9 billion by 2030.
An essential part of a vehicle's combustion engine, a valve controls how much fuel and exhaust gases flow into each cylinder. Engine valves play a critical role in determining how well an automobile's engine performs because they control the flow of fuel and exhaust gases into and out of the cylinder. The timing of an engine valve determines the ideal air-to-fuel ratio for a given vehicle. This helps the engine run as efficiently and as possible while reducing emissions. The need for automotive engine valves is growing rapidly as auto production rises globally. The market for automobile engine valves is expanding due to legislation limiting carbon emissions and demand for high-performance engines. Market growth is anticipated throughout the anticipated period as a result of manufacturers' demand for energy-saving technology, such as engine downsizing. Rising automotive production and rising disposable income in developed countries, which is leading to an increase in demand for vehicles with high power engines, are driving the global market for automobile engine valves.
The need for crankshaft systems for automobiles will increase, which will increase the necessity for this market. The market for engine valves is projected to expand as a result of rising after-sales services, component demand, and demand for engine valve oils and lubricants.
Get an overview of this study by requesting a free sample
Nearly every industry has been impacted by the pandemic's multiple interruptions during this era. This was primarily due to the global lockdown and social segregation laws imposed in response to the pandemic, which caused a production halt for both valves and complete autos. This led to a deterioration in the economy for both the automotive valves industry as a whole and the automobile industry. Sales of cars increased by 5% in 2021 over 2020, indicating that the automotive industry is finding its footing. This is expected to continue for the course of the forecast term.
Increasing market traction for high-performance vehicles to accelerate the market’s growth
There has been increasing pressure to use alternative fuels. This is anticipated to have an impact on the development and design of vehicle engine valves. All of these advancements are still based on lowering pollution, which will result in lower sulphur content once they are put into practice. The sales of automotive engine valve during the forecast period may be influenced by this. Additionally, the automobile engine valves will result in less noise pollution. The reason is that the valves in automobile engines do not use noise-producing components like rocker arms and valve cams. Investors' interest in the automobile engine valve market has significantly increased as a result of this and the possibility to minimize emissions. Additionally, the use of an automobile engine valve improves the performance of the lubricating system. The reason for this is that they make it simpler for the pushrods to move the oil to the top end as opposed to pushing it into the engine's passages and obstructing its proper operation. During the predicted period, this may as well be what drives demand for vehicle engine valves. More valves would also guarantee that the flow of intake and exhaust gases significantly improves, raising output and speeding up the combustion process.
Automotive industry's comeback
Automotive valves are among the essential, indispensable, and irreplaceable components (having no substitute). For instance, the inlet and exhaust valves in a gasoline engine cylinder employ about four valves. Varying engine designs may use a different number, size, shape, and material of valves, but all engines require valves to function properly. There are 40–60 changeable valves in a typical automobile. The production of vehicles is directly related to the expansion of valves. The demand for valves rises as manufacturing levels rise. Due to shifting demographics and a generally growing economy, the vehicle markets in China and India are expanding faster than those in other nations.
The automotive engine valve market is segmented into the engine valve type, and vehicle type. Based on engine valve type, the market for bimetallic valve segment is estimated to lead the market during the forecast period. The bimetallic valves' exceptional high temperature resistance and excellent corrosion resistance is the cause. These are also known to have a high tensile strength.
By vehicle type, the passenger car is anticipated to dominant the automotive engine valve market during the forecast period. The passenger automobile segment has seen the biggest growth as a result of the growing need for personal transportation and the rising per capita income. The comfort of passenger cars is made possible by the rapid urbanization and the ease of the amenities.
Throughout the projection period, Asia-Pacific is expected to stay one of the most alluring markets, and this region accounts for the majority revenue share in the market. This is a result of the rise in vehicle production and the presence of significant corporations in the nations of the region. The market for automobile engine valves is growing as a result of increased vehicle demand, which is primarily being driven by developing countries like China and India. The developing nations of Asia Pacific are anticipated to support industrialization with low-cost labor and strong government support.
The global Automotive engine valve market is segmented as follows:
By Engine Valve Type
By Vehicle type
By Function
By Region/Geography
| Attribute | Description |
|---|---|
| Base Year | 2021 |
| Forecast period | 2022-2030 |
| Report Coverage | Revenue estimation and forecast, company profile, competitive landscape, growth factors, and recent trends |
| Regional scope | North America, Europe, Asia Pacific, Middle East & Africa, and Latin America |
| Market Size(unit) | USD Billion |
| Automotive engine valve Market CAGR | 3% |
| Segments Covered |
By Engine Valve Type |
1. Introduction
1.1. Objectives of the Study
1.2. Market Definition
1.3. Research Scope
2. Research Methodology and Assumptions
3. Executive Summary
4. Premium Insights
4.1. Porter’s Five Forces Analysis
4.2. Value Chain Analysis
4.3. Top Investment Pockets
4.3.1. Market Attractiveness Analysis By Engine Valve Type
4.3.2. Market Attractiveness Analysis By Vehicle Type
4.3.3. Market Attractiveness Analysis By Function
4.4. Industry Trends
5. Market Dynamics
5.1. Market Evaluation
5.2. Drivers
5.2.1. Increasing market traction for high-performance vehicles to accelerate the market’s growth
5.2.2. Automotive industry's comeback
5.3. Restrains
5.3.1. Rising cost of raw materials
5.4. Opportunities
5.4.1. Rising advancements
6. Global Automotive Engine Valve Market Analysis and Forecast, By Engine Valve Type
6.1. Segment Overview
6.2. Monometallic
6.3. Bimetallic
6.4. Hollow
7. Global Automotive Engine Valve Market Analysis and Forecast, By Vehicle Type
7.1. Segment Overview
7.2. Passenger Cars
7.3. LCVs
7.4. HCVs
8. Global Automotive Engine Valve Market Analysis and Forecast, By Function
8.1. Segment Overview
8.2. Electric
8.3. Hydraulic
8.4. Pneumatic
9. Global Automotive Engine Valve Market Analysis and Forecast, By Regional Analysis
9.1. Segment Overview
9.2. North America
9.2.1. U.S.
9.2.2. Canada
9.2.3. Mexico
9.3. Europe
9.3.1. Germany
9.3.2. France
9.3.3. U.K.
9.3.4. Italy
9.3.5. Spain
9.3.6. Rest of Europe
9.4. Asia-Pacific
9.4.1. Japan
9.4.2. China
9.4.3. India
9.4.4. Australia
9.4.5. South Korea
9.4.6. Rest of Asia-Pacific
9.5. South America
9.5.1. Brazil
9.5.2. Argentina
9.5.3. Rest of South America
9.6. Middle East and Africa
9.6.1. UAE
9.6.2. South Africa
9.6.3. Egypt
9.6.4. Kuwait
9.6.5. Saudi Arabia
9.6.6. Rest of Middle East & Africa
10. Global Automotive Engine Valve Market-Competitive Landscape
10.1. Overview
10.2. Market Share of Key Players in the Automotive Engine Valve market
10.2.1. Global Company Market Share
10.2.2. North America Company Market Share
10.2.3. Europe Company Market Share
10.2.4. APAC Company Market Share
10.3. Competitive Situations and Trends
10.3.1. Engine Valve Type Launches and Developments
10.3.2. Partnerships, Collaborations, and Agreements
10.3.3. Mergers & Acquisitions
10.3.4. Expansions
11. Company Profiles
11.1. Mahle Group
11.1.1. Business Overview
11.1.2. Company Snapshot
11.1.3. Company Market Share Analysis
11.1.4. Company Vehicle Type Portfolio
11.1.5. Recent Developments
11.1.6. SWOT Analysis
11.2. Knorr-Bremse AG
11.2.1. Business Overview
11.2.2. Company Snapshot
11.2.3. Company Market Share Analysis
11.2.4. Company Vehicle Type Portfolio
11.2.5. Recent Developments
11.2.6. SWOT Analysis
11.3. Hitachi Ltd.
11.3.1. Business Overview
11.3.2. Company Snapshot
11.3.3. Company Market Share Analysis
11.3.4. Company Vehicle Type Portfolio
11.3.5. Recent Developments
11.3.6. SWOT Analysis
11.4. Federal-Mogul Holdings Corp
11.4.1. Business Overview
11.4.2. Company Snapshot
11.4.3. Company Market Share Analysis
11.4.4. Company Vehicle Type Portfolio
11.4.5. Recent Developments
11.4.6. SWOT Analysis
11.5. Eaton Corporation Plc.
11.5.1. Business Overview
11.5.2. Company Snapshot
11.5.3. Company Market Share Analysis
11.5.4. Company Vehicle Type Portfolio
11.5.5. Recent Developments
11.5.6. SWOT Analysis
11.6. Denso Corporation
11.6.1. Business Overview
11.6.2. Company Snapshot
11.6.3. Company Market Share Analysis
11.6.4. Company Vehicle Type Portfolio
11.6.5. Recent Developments
11.6.6. SWOT Analysis
11.7. FUJI OOZX Inc.
11.7.1. Business Overview
11.7.2. Company Snapshot
11.7.3. Company Market Share Analysis
11.7.4. Company Vehicle Type Portfolio
11.7.5. Recent Developments
11.7.6. SWOT Analysis
11.8. FTE automotive GmbH
11.8.1. Business Overview
11.8.2. Company Snapshot
11.8.3. Company Market Share Analysis
11.8.4. Company Vehicle Type Portfolio
11.8.5. Recent Developments
11.8.6. SWOT Analysis
11.9. Delphi Automotive PLC
11.9.1. Business Overview
11.9.2. Company Snapshot
11.9.3. Company Market Share Analysis
11.9.4. Company Vehicle Type Portfolio
11.9.5. Recent Developments
11.9.6. SWOT Analysis
11.10. Continental AG
11.10.1. Business Overview
11.10.2. Company Snapshot
11.10.3. Company Market Share Analysis
11.10.4. Company Vehicle Type Portfolio
11.10.5. Recent Developments
11.10.6. SWOT Analysis
List of Table
1. Global Automotive Engine Valve Market, By Engine Valve Type, 2022-2030(USD Billion)
2. Global Monometallic Automotive Engine Valve Market, By Region, 2022-2030(USD Billion)
3. Global Bimetallic Automotive Engine Valve Market, By Region, 2022-2030(USD Billion)
4. Global Hollow Automotive Engine Valve Market, By Region, 2022-2030(USD Billion)
5. Global Automotive Engine Valve Market, By Vehicle Type, 2022-2030(USD Billion)
6. Global Passenger Cars Automotive Engine Valve Market, By Region, 2022-2030(USD Billion)
7. Global LCVs Automotive Engine Valve Market, By Region, 2022-2030(USD Billion)
8. Global HCVs Automotive Engine Valve Market, By Region, 2022-2030(USD Billion)
9. Global Automotive Engine Valve Market, By Function, 2022-2030(USD Billion)
10. Global Electric Automotive Engine Valve Market, By Region, 2022-2030(USD Billion)
11. Global Hydraulic Automotive Engine Valve Market, By Region, 2022-2030(USD Billion)
12. Global Pneumatic Automotive Engine Valve Market, By Region, 2022-2030(USD Billion)
13. Global Automotive Engine Valve Market, By Region, 2022-2030(USD Billion)
14. Global Automotive Engine Valve Market, By North America, 2022-2030(USD Billion)
15. North America Automotive Engine Valve Market, By Engine Valve Type, 2022-2030(USD Billion)
16. North America Automotive Engine Valve Market, By Vehicle Type, 2022-2030(USD Billion)
17. North America Automotive Engine Valve Market, By Function, 2022-2030(USD Billion)
18. U.S. Automotive Engine Valve Market, By Engine Valve Type, 2022-2030(USD Billion)
19. U.S. Automotive Engine Valve Market, By Vehicle Type, 2022-2030(USD Billion)
20. U.S. Automotive Engine Valve Market, By Function, 2022-2030(USD Billion)
21. Canada Automotive Engine Valve Market, By Engine Valve Type, 2022-2030(USD Billion)
22. Canada Automotive Engine Valve Market, By Vehicle Type, 2022-2030(USD Billion)
23. Canada Automotive Engine Valve Market, By Function, 2022-2030(USD Billion)
24. Mexico Automotive Engine Valve Market, By Engine Valve Type, 2022-2030(USD Billion)
25. Mexico Automotive Engine Valve Market, By Vehicle Type, 2022-2030(USD Billion)
26. Mexico Automotive Engine Valve Market, By Function, 2022-2030(USD Billion)
27. Europe Automotive Engine Valve Market, By Engine Valve Type, 2022-2030(USD Billion)
28. Europe Automotive Engine Valve Market, By Vehicle Type, 2022-2030(USD Billion)
29. Europe Automotive Engine Valve Market, By Function, 2022-2030(USD Billion)
30. Germany Automotive Engine Valve Market, By Engine Valve Type, 2022-2030(USD Billion)
31. Germany Automotive Engine Valve Market, By Vehicle Type, 2022-2030(USD Billion)
32. Germany Automotive Engine Valve Market, By Function, 2022-2030(USD Billion)
33. France Automotive Engine Valve Market, By Engine Valve Type, 2022-2030(USD Billion)
34. France Automotive Engine Valve Market, By Vehicle Type, 2022-2030(USD Billion)
35. France Automotive Engine Valve Market, By Function, 2022-2030(USD Billion)
36. U.K. Automotive Engine Valve Market, By Engine Valve Type, 2022-2030(USD Billion)
37. U.K. Automotive Engine Valve Market, By Vehicle Type, 2022-2030(USD Billion)
38. U.K. Automotive Engine Valve Market, By Function, 2022-2030(USD Billion)
39. Italy Automotive Engine Valve Market, By Engine Valve Type, 2022-2030(USD Billion)
40. Italy Automotive Engine Valve Market, By Vehicle Type, 2022-2030(USD Billion)
41. Italy Automotive Engine Valve Market, By Function, 2022-2030(USD Billion)
42. Spain Automotive Engine Valve Market, By Engine Valve Type, 2022-2030(USD Billion)
43. Spain Automotive Engine Valve Market, By Vehicle Type, 2022-2030(USD Billion)
44. Spain Automotive Engine Valve Market, By Function, 2022-2030(USD Billion)
45. Rest of Europe Automotive Engine Valve Market, By Engine Valve Type, 2022-2030(USD Billion)
46. Rest of Europe Automotive Engine Valve Market, By Vehicle Type, 2022-2030(USD Billion)
47. Rest of Europe Automotive Engine Valve Market, By Function, 2022-2030(USD Billion)
48. Asia Pacific Automotive Engine Valve Market, By Engine Valve Type, 2022-2030(USD Billion)
49. Asia Pacific Automotive Engine Valve Market, By Vehicle Type, 2022-2030(USD Billion)
50. Asia Pacific Automotive Engine Valve Market, By Function, 2022-2030(USD Billion)
51. Japan Automotive Engine Valve Market, By Engine Valve Type, 2022-2030(USD Billion)
52. Japan Automotive Engine Valve Market, By Vehicle Type, 2022-2030(USD Billion)
53. Japan Automotive Engine Valve Market, By Function, 2022-2030(USD Billion)
54. China Automotive Engine Valve Market, By Engine Valve Type, 2022-2030(USD Billion)
55. China Automotive Engine Valve Market, By Vehicle Type, 2022-2030(USD Billion)
56. China Automotive Engine Valve Market, By Function, 2022-2030(USD Billion)
57. India Automotive Engine Valve Market, By Engine Valve Type, 2022-2030(USD Billion)
58. India Automotive Engine Valve Market, By Vehicle Type, 2022-2030(USD Billion)
59. India Automotive Engine Valve Market, By Function, 2022-2030(USD Billion)
60. Australia Automotive Engine Valve Market, By Engine Valve Type, 2022-2030(USD Billion)
61. Australia Automotive Engine Valve Market, By Vehicle Type, 2022-2030(USD Billion)
62. Australia Automotive Engine Valve Market, By Function, 2022-2030(USD Billion)
63. South Korea Automotive Engine Valve Market, By Engine Valve Type, 2022-2030(USD Billion)
64. South Korea Automotive Engine Valve Market, By Vehicle Type, 2022-2030(USD Billion)
65. South Korea Automotive Engine Valve Market, By Function, 2022-2030(USD Billion)
66. Rest of Asia-Pacific Automotive Engine Valve Market, By Engine Valve Type, 2022-2030(USD Billion)
67. Rest of Asia-Pacific Automotive Engine Valve Market, By Vehicle Type, 2022-2030(USD Billion)
68. Rest of Asia-Pacific Automotive Engine Valve Market, By Function, 2022-2030(USD Billion)
69. South America Automotive Engine Valve Market, By Engine Valve Type, 2022-2030(USD Billion)
70. South America Automotive Engine Valve Market, By Vehicle Type, 2022-2030(USD Billion)
71. South America Automotive Engine Valve Market, By Function, 2022-2030(USD Billion)
72. Brazil Automotive Engine Valve Market, By Engine Valve Type, 2022-2030(USD Billion)
73. Brazil Automotive Engine Valve Market, By Vehicle Type, 2022-2030(USD Billion)
74. Brazil Automotive Engine Valve Market, By Function, 2022-2030(USD Billion)
75. Argentina Automotive Engine Valve Market, By Engine Valve Type, 2022-2030(USD Billion)
76. Argentina Automotive Engine Valve Market, By Vehicle Type, 2022-2030(USD Billion)
77. Argentina Automotive Engine Valve Market, By Function, 2022-2030(USD Billion)
78. Rest of Latin America Automotive Engine Valve Market, By Engine Valve Type, 2022-2030(USD Billion)
79. Rest of Latin America Automotive Engine Valve Market, By Vehicle Type, 2022-2030(USD Billion)
80. Rest of Latin America Automotive Engine Valve Market, By Function, 2022-2030(USD Billion)
81. Middle East and Africa Automotive Engine Valve Market, By Engine Valve Type, 2022-2030(USD Billion)
82. Middle East and Africa Automotive Engine Valve Market, By Vehicle Type, 2022-2030(USD Billion)
83. Middle East and Africa Automotive Engine Valve Market, By Function, 2022-2030(USD Billion)
84. UAE Automotive Engine Valve Market, By Engine Valve Type, 2022-2030(USD Billion)
85. UAE Automotive Engine Valve Market, By Vehicle Type, 2022-2030(USD Billion)
86. UAE Automotive Engine Valve Market, By Function, 2022-2030(USD Billion)
87. South Africa Automotive Engine Valve Market, By Engine Valve Type, 2022-2030(USD Billion)
88. South Africa Automotive Engine Valve Market, By Vehicle Type, 2022-2030(USD Billion)
89. South Africa Automotive Engine Valve Market, By Function, 2022-2030(USD Billion)
90. Egypt Automotive Engine Valve Market, By Engine Valve Type, 2022-2030(USD Billion)
91. Egypt Automotive Engine Valve Market, By Vehicle Type, 2022-2030(USD Billion)
92. Egypt Automotive Engine Valve Market, By Function, 2022-2030(USD Billion)
93. Kuwait Automotive Engine Valve Market, By Engine Valve Type, 2022-2030(USD Billion)
94. Kuwait Automotive Engine Valve Market, By Vehicle Type, 2022-2030(USD Billion)
95. Kuwait Automotive Engine Valve Market, By Function, 2022-2030(USD Billion)
96. Saudi Arabia Automotive Engine Valve Market, By Engine Valve Type, 2022-2030(USD Billion)
97. Saudi Arabia Automotive Engine Valve Market, By Vehicle Type, 2022-2030(USD Billion)
98. Saudi Arabia Automotive Engine Valve Market, By Function, 2022-2030(USD Billion)
99. Rest of Middle East Automotive Engine Valve Market, By Engine Valve Type, 2022-2030(USD Billion)
100. Rest of Middle East Automotive Engine Valve Market, By Vehicle Type, 2022-2030(USD Billion)
101. Rest of Middle East Automotive Engine Valve Market, By Function, 2022-2030(USD Billion)
List of Figures
1. Global Automotive Engine Valve Market Segmentation
2. Automotive Engine Valve Market: Research Methodology
3. Market Size Estimation Methodology: Bottom-Up Approach
4. Market Size Estimation Methodology: Top-Down Approach
5. Data Triangulation
6. Porter’s Five Forces Analysis
7. Value Chain Analysis
8. Global Automotive Engine Valve Market Attractiveness Analysis By Engine Valve Type
9. Global Automotive Engine Valve Market Attractiveness Analysis By Vehicle Type
10. Global Automotive Engine Valve Market Attractiveness Analysis By Function
11. Global Automotive Engine Valve Market Attractiveness Analysis By Region
12. Global Automotive Engine Valve Market: Dynamics
13. Global Automotive Engine Valve Market Share By Engine Valve Type(2022 & 2030)
14. Global Automotive Engine Valve Market Share By Vehicle Type(2022 & 2030)
15. Global Automotive Engine Valve Market Share By Function(2022 & 2030)
16. Global Automotive Engine Valve Market Share by Regions (2022 & 2030)
17. Global Automotive Engine Valve Market Share by Company (2021)
By Engine Valve Type
By Vehicle type
By Function
By Region/Geography
Research has its special purpose to undertake marketing efficiently. In this competitive scenario, businesses need information across all industry verticals; the information about customer wants, market demand, competition, industry trends, distribution channels etc. This information needs to be updated regularly because businesses operate in a dynamic environment. Our organization, The Brainy Insights incorporates scientific and systematic research procedures in order to get proper market insights and industry analysis for overall business success. The analysis consists of studying the market from a miniscule level wherein we implement statistical tools which helps us in examining the data with accuracy and precision.
Our research reports feature both; quantitative and qualitative aspects for any market. Qualitative information for any market research process are fundamental because they reveal the customer needs and wants, usage and consumption for any product/service related to a specific industry. This in turn aids the marketers/investors in knowing certain perceptions of the customers. Qualitative research can enlighten about the different product concepts and designs along with unique service offering that in turn, helps define marketing problems and generate opportunities. On the other hand, quantitative research engages with the data collection process through interviews, e-mail interactions, surveys and pilot studies. Quantitative aspects for the market research are useful to validate the hypotheses generated during qualitative research method, explore empirical patterns in the data with the help of statistical tools, and finally make the market estimations.
The Brainy Insights offers comprehensive research and analysis, based on a wide assortment of factual insights gained through interviews with CXOs and global experts and secondary data from reliable sources. Our analysts and industry specialist assume vital roles in building up statistical tools and analysis models, which are used to analyse the data and arrive at accurate insights with exceedingly informative research discoveries. The data provided by our organization have proven precious to a diverse range of companies, facilitating them to address issues such as determining which products/services are the most appealing, whether or not customers use the product in the manner anticipated, the purchasing intentions of the market and many others.
Our research methodology encompasses an idyllic combination of primary and secondary initiatives. Key phases involved in this process are listed below:

The phase involves the gathering and collecting of market data and its related information with the help of different sources & research procedures.

The data procurement stage involves in data gathering and collecting through various data sources.
This stage involves in extensive research. These data sources includes:
Purchased Database: Purchased databases play a crucial role in estimating the market sizes irrespective of the domain. Our purchased database includes:
Primary Research: The Brainy Insights interacts with leading companies and experts of the concerned domain to develop the analyst team’s market understanding and expertise. It improves and substantiates every single data presented in the market reports. Primary research mainly involves in telephonic interviews, E-mail interactions and face-to-face interviews with the raw material providers, manufacturers/producers, distributors, & independent consultants. The interviews that we conduct provides valuable data on market size and industry growth trends prevailing in the market. Our organization also conducts surveys with the various industry experts in order to gain overall insights of the industry/market. For instance, in healthcare industry we conduct surveys with the pharmacists, doctors, surgeons and nurses in order to gain insights and key information of a medical product/device/equipment which the customers are going to usage. Surveys are conducted in the form of questionnaire designed by our own analyst team. Surveys plays an important role in primary research because surveys helps us to identify the key target audiences of the market. Additionally, surveys helps to identify the key target audience engaged with the market. Our survey team conducts the survey by targeting the key audience, thus gaining insights from them. Based on the perspectives of the customers, this information is utilized to formulate market strategies. Moreover, market surveys helps us to understand the current competitive situation of the industry. To be precise, our survey process typically involve with the 360 analysis of the market. This analytical process begins by identifying the prospective customers for a product or service related to the market/industry to obtain data on how a product/service could fit into customers’ lives.

Secondary Research: The secondary data sources includes information published by the on-profit organizations such as World bank, WHO, company fillings, investor presentations, annual reports, national government documents, statistical databases, blogs, articles, white papers and others. From the annual report, we analyse a company’s revenue to understand the key segment and market share of that organization in a particular region. We analyse the company websites and adopt the product mapping technique which is important for deriving the segment revenue. In the product mapping method, we select and categorize the products offered by the companies catering to domain specific market, deduce the product revenue for each of the companies so as to get overall estimation of the market size. We also source data and analyses trends based on information received from supply side and demand side intermediaries in the value chain. The supply side denotes the data gathered from supplier, distributor, wholesaler and the demand side illustrates the data gathered from the end customers for respective market domain.

The supply side for a domain specific market is analysed by:
The demand side for the market is estimated through:
In-house Library: Apart from these third-party sources, we have our in-house library of qualitative and quantitative information. Our in-house database includes market data for various industry and domains. These data are updated on regular basis as per the changing market scenario. Our library includes, historic databases, internal audit reports and archives.
Sometimes there are instances where there is no metadata or raw data available for any domain specific market. For those cases, we use our expertise to forecast and estimate the market size in order to generate comprehensive data sets. Our analyst team adopt a robust research technique in order to produce the estimates:
Data Synthesis: This stage involves the analysis & mapping of all the information obtained from the previous step. It also involves in scrutinizing the data for any discrepancy observed while data gathering related to the market. The data is collected with consideration to the heterogeneity of sources. Robust scientific techniques are in place for synthesizing disparate data sets and provide the essential contextual information that can orient market strategies. The Brainy Insights has extensive experience in data synthesis where the data passes through various stages:


Market Deduction & Formulation: The final stage comprises of assigning data points at appropriate market spaces so as to deduce feasible conclusions. Analyst perspective & subject matter expert based holistic form of market sizing coupled with industry analysis also plays a crucial role in this stage.
This stage involves in finalization of the market size and numbers that we have collected from data integration step. With data interpolation, it is made sure that there is no gap in the market data. Successful trend analysis is done by our analysts using extrapolation techniques, which provide the best possible forecasts for the market.
Data Validation & Market Feedback: Validation is the most important step in the process. Validation & re-validation via an intricately designed process helps us finalize data-points to be used for final calculations.

The Brainy Insights interacts with leading companies and experts of the concerned domain to develop the analyst team’s market understanding and expertise. It improves and substantiates every single data presented in the market reports. The data validation interview and discussion panels are typically composed of the most experienced industry members. The participants include, however, are not limited to:
Moreover, we always validate our data and findings through primary respondents from all the major regions we are working on.


Free Customization
Fortune 500 Clients
Free Yearly Update On Purchase Of Multi/Corporate License
Companies Served Till Date