- +1-315-215-1633
- sales@thebrainyinsights.com

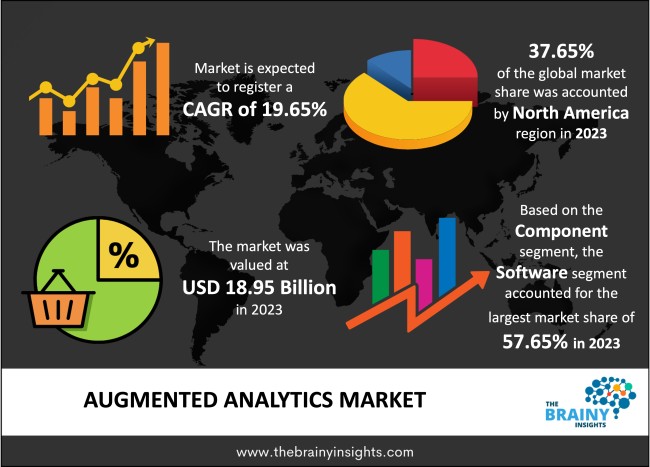
The global augmented analytics market was valued at USD 18.95 billion in 2023 and is anticipated to grow at a CAGR of 19.65% from 2024 to 2033. Advanced analytics leverages technologies like machine learning and artificial intelligence to help with data preparation, insights extraction, and insights explanation to enhance how users examine data in BI systems and analytics. Analytics and business intelligence form its foundation. The market is mostly driven by how much more complicated business data firms are storing. In modern days, augmented analytics is particularly helpful when data extraction is required, but there needs to be more data scientists to complete the job. The generation, analysis, and construction of data models are only a few of the various functions offered by augmented analytics. It is beneficial for data analysis and exploration. The market is also growing due to the increasing complexities and abundance of data. There is an escalating demand for data-based decision-making.
Augmented analytics is a revolutionary technology in data analysis and business intelligence that ushеrs in a new era when advanced technology comes together to improve human decision-making processes. Generally, augmented analytics is a technology that utilizes machine learning (ML) and artificial intelligence (AI) to automate and enhance certain aspects of the analytics lifecycle. Compared to standard data analytics, augmented analytics provides a comprehensive solution to the problems brought on by the ever-growing amounts of data in the digital environment in the present scenario. Augmented analytics essentially incorporates advanced technology into the analytics workflow, like automation, natural language processing, and machine learning. By assisting and equipping users in the exploration, preparation, and interpretation of data, this integration hopes to promote faster and more informed decision-making.
The growth of augmented analytics generally depends on integrated, superior data. Because poor data quality can result in unexpected insights, ensuring data quality and smooth integration across various sources is an important challenge. Concerns about the security and privacy of sensitive data are growing as AI and ML algorithms are used more frequently. Strong security measures must be put in place by organizations to guard against illegal access and data breaches. As advanced analytics depends on AI and algorithms, ethical issues are raised. Unintentional biases in algorithmic decision-making processes must be prevented by guaranteeing data safety, accountability, and transparency.
Get an overview of this study by requesting a free sample
Integration of Augmented Analytics with Business Processes - One important aspect driving the market growth of applied analytics is its incorporation into corporate processes. The merging of advanced analytics with pre-existing business applications is becoming increasingly prominent as firms aim for a seamless and integrated analytics experience. The overall effectiveness of decision-making processes is improved by advanced analytics platforms that integrate seamlessly with customer relationship management (CRM), enterprise resource planning (ERP), and other business systems. Integrating augmented analytics into daily operations places it at the center of corporate strategy, promoting its uptake in various industries. This primary factor is boosting the market growth and development.
Growing Privacy Concerns - Security and privacy issues become major roadblocks as businesses increasingly rely on augmented analytics to extract private and sensitive data insights. Integrating artificial intelligence and machine learning introduces vulnerabilities that hostile actors could exploit. Ensuring data security, integrity, and availability becomes a critical concern, particularly in sectors with strict regulatory compliance like finance and health care. Augmented analytics solution deployment becomes more complex when organizations have to put strong security measures, encryption protocols, and access restrictions in place to protect against data breaches and unwanted access. This factor is restraining the market growth and development.
Focus on Customer-Centric Analytics - The customer-centric environment highly values analytics solutions that can provide comprehensive insights into customer behavior, practices, and traits. This customer-centric approach is supported by advanced analytics, which can forecast customer behavior and analyze large datasets. Business enterprises committed to providing outstanding customer experiences find that their needs are being met by incorporating machine learning models for sentiment analysis, tailored marking, and customer segmentation. The market for augmented analytics is growing because of the growing need for customer-centric analytics. This factor is expected to provide lucrative growth opportunities in the upcoming years.
The regions analyzed for the market include North America, Europe, South America, Asia Pacific, the Middle East, and Africa. North America region emerged as the most prominent global augmented analytics market, with a 37.65% market revenue share in 2023. Due to several factors, North America has a sizable market share in the global augmented analytics industry. Major technology companies have created an environment that supports creativity and the creation of advanced analytics solutions. The region's well-developed cloud computing environment and strong infrastructure make integrating and implementing advanced analytics platforms effective. The growing focus on data-driven decision-making in business enterprises across various sectors, including technology, health care, and finance, drives regional market growth and development. North America holds a leading market share in augmented analytics, mainly due to the region's early embrace of artificial intelligence and machine learning technologies and its proactive approach to digital transformation. The regional market players also engage in various market strategies such as product innovation, product differentiation, mergers, acquisitions, partnerships, and strategic alliances to maintain their competitive edge.
North America Region Augmented Analytics Market Share in 2023 - 37.65%
www.thebrainyinsights.com
Check the geographical analysis of this market by requesting a free sample
The component segment includes software and services. The software segment accounted for the largest market share of around 57.65% in 2023. The growing need for augmented analytics capabilities across sectors has led to a significant market share for augmented analytics software. Business enterprises disburse money on software programs that provide strong data visualization capabilities, user-friendly interfaces, and easy interaction with current data infrastructure. The growing market share of augmented analytics software is attributable to the rise of self-service analytics and the demand for real-time data/information.
The deployment mode segment is bifurcated into cloud and on-premises. The on-premises segment dominated, with a market share of around 51.85% in 2023. For several reasons, on-premises augmented analytics continues to have a significant market share. Businesses in industries like banking or healthcare that must adhere to regulations or handle sensitive data frequently choose on-premises solutions to control their data environment. Businesses with pre-existing on-premises infrastructure can also choose continuity using their current infrastructure and knowledge. High levels of customization are available with on-premises installations, enabling business enterprises to adapt augmented analytics systems to their requirements. Business enterprises with specialized data processing networks, intricate integrations, or custom security protocols find this degree of control over infrastructure and configurations especially intriguing.
The organization size segment is divided into SMEs and large enterprises. The large enterprises segment dominated the market, with a market share of around 59.81% in 2023. Large enterprises have a significant market share in augmented analytics, mostly due to a few important aspects. Due to their strong IT infrastructure, large enterprises can easily invest in and deploy augmented analytics systems. Because of the size of their operations, they require sophisticated analytics skills to extract meaningful insights from large and varied amounts of information. Large business enterprises frequently have specialized data teams with data scientists and analysts on staff who can use all of the advanced analytics features. Large organizations are positioned as early adopters of advanced analytics solutions, greatly contributing to their market share dominance. This is because their strategic goal is to acquire a competitive edge, optimize operations, and enhance decision-making processes.
The industry segment is classified into BFSI, IT & telecommunication, healthcare, retail and other industry verticals. The BFSI segment dominated the market, with a share of around 31.31% in 2023. The BFSI industry has a significant market share of acquired analytics, driven by the industry's strong dependency on data-based insights for risk management, fraud detection, and customized customer experiences. Big financial institutions use advanced analytics to quickly and intelligently sort through enormous datasets, spot trends, and make decisions.
| Attribute | Description |
|---|---|
| Market Size | Revenue (USD Billion) |
| Market size value in 2023 | USD 18.95 Billion |
| Market size value in 2033 | USD 113.98 Billion |
| CAGR (2024 to 2033) | 19.65% |
| Historical data | 2020-2022 |
| Base Year | 2023 |
| Forecast | 2024-2033 |
| Region | The regions analyzed for the market are Asia Pacific, Europe, South America, North America, and Middle East & Africa. Furthermore, the regions are further analyzed at the country level. |
| Segments | Component, Organization Size, Deployment Mode, Industry |
As per The Brainy Insights, the size of the augmented analytics market was valued at USD 18.95 billion in 2023 to USD 113.98 billion by 2033.
The global augmented analytics market is growing at a CAGR of 19.65% during the forecast period 2024-2033.
North America region became the largest market for augmented analytics.
The increasing adoption of augmented analytics within the business enterprises is influencing the market's growth.
This study forecasts revenue at global, regional, and country levels from 2020 to 2033. The Brainy Insights has segmented the global augmented analytics market based on below-mentioned segments:
Global Augmented Analytics Market by Component:
Global Augmented Analytics Market by Deployment Mode:
Global Augmented Analytics Market by Industry:
Global Augmented Analytics Market by Organization Size:
Global Augmented Analytics Market by Region:
Research has its special purpose to undertake marketing efficiently. In this competitive scenario, businesses need information across all industry verticals; the information about customer wants, market demand, competition, industry trends, distribution channels etc. This information needs to be updated regularly because businesses operate in a dynamic environment. Our organization, The Brainy Insights incorporates scientific and systematic research procedures in order to get proper market insights and industry analysis for overall business success. The analysis consists of studying the market from a miniscule level wherein we implement statistical tools which helps us in examining the data with accuracy and precision.
Our research reports feature both; quantitative and qualitative aspects for any market. Qualitative information for any market research process are fundamental because they reveal the customer needs and wants, usage and consumption for any product/service related to a specific industry. This in turn aids the marketers/investors in knowing certain perceptions of the customers. Qualitative research can enlighten about the different product concepts and designs along with unique service offering that in turn, helps define marketing problems and generate opportunities. On the other hand, quantitative research engages with the data collection process through interviews, e-mail interactions, surveys and pilot studies. Quantitative aspects for the market research are useful to validate the hypotheses generated during qualitative research method, explore empirical patterns in the data with the help of statistical tools, and finally make the market estimations.
The Brainy Insights offers comprehensive research and analysis, based on a wide assortment of factual insights gained through interviews with CXOs and global experts and secondary data from reliable sources. Our analysts and industry specialist assume vital roles in building up statistical tools and analysis models, which are used to analyse the data and arrive at accurate insights with exceedingly informative research discoveries. The data provided by our organization have proven precious to a diverse range of companies, facilitating them to address issues such as determining which products/services are the most appealing, whether or not customers use the product in the manner anticipated, the purchasing intentions of the market and many others.
Our research methodology encompasses an idyllic combination of primary and secondary initiatives. Key phases involved in this process are listed below:

The phase involves the gathering and collecting of market data and its related information with the help of different sources & research procedures.

The data procurement stage involves in data gathering and collecting through various data sources.
This stage involves in extensive research. These data sources includes:
Purchased Database: Purchased databases play a crucial role in estimating the market sizes irrespective of the domain. Our purchased database includes:
Primary Research: The Brainy Insights interacts with leading companies and experts of the concerned domain to develop the analyst team’s market understanding and expertise. It improves and substantiates every single data presented in the market reports. Primary research mainly involves in telephonic interviews, E-mail interactions and face-to-face interviews with the raw material providers, manufacturers/producers, distributors, & independent consultants. The interviews that we conduct provides valuable data on market size and industry growth trends prevailing in the market. Our organization also conducts surveys with the various industry experts in order to gain overall insights of the industry/market. For instance, in healthcare industry we conduct surveys with the pharmacists, doctors, surgeons and nurses in order to gain insights and key information of a medical product/device/equipment which the customers are going to usage. Surveys are conducted in the form of questionnaire designed by our own analyst team. Surveys plays an important role in primary research because surveys helps us to identify the key target audiences of the market. Additionally, surveys helps to identify the key target audience engaged with the market. Our survey team conducts the survey by targeting the key audience, thus gaining insights from them. Based on the perspectives of the customers, this information is utilized to formulate market strategies. Moreover, market surveys helps us to understand the current competitive situation of the industry. To be precise, our survey process typically involve with the 360 analysis of the market. This analytical process begins by identifying the prospective customers for a product or service related to the market/industry to obtain data on how a product/service could fit into customers’ lives.

Secondary Research: The secondary data sources includes information published by the on-profit organizations such as World bank, WHO, company fillings, investor presentations, annual reports, national government documents, statistical databases, blogs, articles, white papers and others. From the annual report, we analyse a company’s revenue to understand the key segment and market share of that organization in a particular region. We analyse the company websites and adopt the product mapping technique which is important for deriving the segment revenue. In the product mapping method, we select and categorize the products offered by the companies catering to domain specific market, deduce the product revenue for each of the companies so as to get overall estimation of the market size. We also source data and analyses trends based on information received from supply side and demand side intermediaries in the value chain. The supply side denotes the data gathered from supplier, distributor, wholesaler and the demand side illustrates the data gathered from the end customers for respective market domain.

The supply side for a domain specific market is analysed by:
The demand side for the market is estimated through:
In-house Library: Apart from these third-party sources, we have our in-house library of qualitative and quantitative information. Our in-house database includes market data for various industry and domains. These data are updated on regular basis as per the changing market scenario. Our library includes, historic databases, internal audit reports and archives.
Sometimes there are instances where there is no metadata or raw data available for any domain specific market. For those cases, we use our expertise to forecast and estimate the market size in order to generate comprehensive data sets. Our analyst team adopt a robust research technique in order to produce the estimates:
Data Synthesis: This stage involves the analysis & mapping of all the information obtained from the previous step. It also involves in scrutinizing the data for any discrepancy observed while data gathering related to the market. The data is collected with consideration to the heterogeneity of sources. Robust scientific techniques are in place for synthesizing disparate data sets and provide the essential contextual information that can orient market strategies. The Brainy Insights has extensive experience in data synthesis where the data passes through various stages:


Market Deduction & Formulation: The final stage comprises of assigning data points at appropriate market spaces so as to deduce feasible conclusions. Analyst perspective & subject matter expert based holistic form of market sizing coupled with industry analysis also plays a crucial role in this stage.
This stage involves in finalization of the market size and numbers that we have collected from data integration step. With data interpolation, it is made sure that there is no gap in the market data. Successful trend analysis is done by our analysts using extrapolation techniques, which provide the best possible forecasts for the market.
Data Validation & Market Feedback: Validation is the most important step in the process. Validation & re-validation via an intricately designed process helps us finalize data-points to be used for final calculations.

The Brainy Insights interacts with leading companies and experts of the concerned domain to develop the analyst team’s market understanding and expertise. It improves and substantiates every single data presented in the market reports. The data validation interview and discussion panels are typically composed of the most experienced industry members. The participants include, however, are not limited to:
Moreover, we always validate our data and findings through primary respondents from all the major regions we are working on.


Free Customization
Fortune 500 Clients
Free Yearly Update On Purchase Of Multi/Corporate License
Companies Served Till Date