- +1-315-215-1633
- sales@thebrainyinsights.com

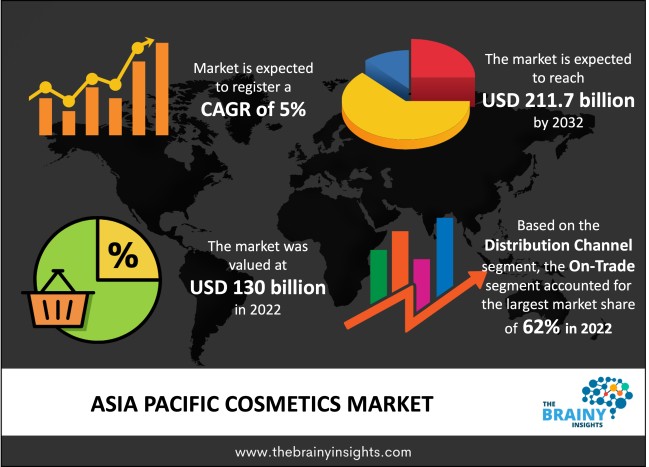
The Asia Pacific cosmetics market was valued at USD 130 billion in 2022 and grew at a CAGR of 5% from 2023 to 2032. The market is expected to reach USD 211.7 billion by 2032. The increased usage of body moisturizing lotions, facial wipes, sunscreen lotions, creams, face wash, hair styling gels, and makeup for men and women drive the Asia-Pacific cosmetics market.
Cosmetics are skin care products that use synthetic chemical components to cleanse, beautify, and promote the skin's overall health. Soaps, lipsticks, perfumes, shampoos, toothpaste, deodorants, hair colours, skin moisturizers, shaving creams, and nail polishes are all part of it. It also includes functional cosmetics that address a specific skin condition, such as skin whitening, minimizing the appearance of fine lines and wrinkles, and protecting against ultraviolet (UV) rays. The rising prevalence of skin-related disorders is influencing Asia Pacific's demand for cosmetics. Rising aesthetic consciousness among individuals and a growing preference for customized cosmetic goods are significant driving market expansion. Furthermore, because of the expanding influence of social media, fast urbanization, and rising per capita income, people are willing to spend money on new, unique, and premium products. This, coupled with the booming e-commerce sector, presents manufacturers with profitable chances to increase their product variety and consumer base. A significant increase in the geriatric population and a growing emphasis on preserving a youthful appearance also contribute to market growth.
Get an overview of this study by requesting a free sample
Ayur introduced a hair colour shampoo in June 2022. According to the manufacturer, the shampoo would make hair colouring easier because it takes less than 10 minutes to colour the hair.
Bloomers has launched a new brand in the market, Colours Cosmetics, which serves clients through local pharmacies and marketplaces in July 2021. The brand focuses on providing a wide selection of products, ranging from foundations to lipsticks, and dispels the myth that drugstore cosmetics are cheap and of poor quality.
Colorbar will offer a customized makeup palette in March 2021, with 12 custom-designed cases and various eyeshadow, blushers, and highlighters. The company aims to grow profitability while providing customers with more options.
Increasing Product Branding– Manufacturers modify their product branding and advertising techniques to increase sales in many nations. Manufacturing businesses have used innovative techniques such as new product launches with natural components and appealing packaging to enhance sales of their cosmetics items. As cosmetics have become an essential part of people's life, consumers, particularly women, prefer to utilize cosmetics items that are portable and convenient to use while travelling or attending social gatherings. Furthermore, using natural substances in developing cosmetics that have no detrimental effect on the skin is a common tactic manufacturers use to attract more clients. This also helps companies in this area increase their revenue.
Side Effects– Cosmetic items contain chemicals that can hurt an individual's skin or other sections of the body. Furthermore, using cosmetic items daily may be harmful to the skin. Chemicals used as ingredients in cosmetic goods can have various negative skin consequences. Long-term and intensive usage of chemical-rich shampoos, serums, and conditioners causes excessive hair loss. Furthermore, excessive use of coloured cosmetic items for the eyes and lips can result in various skin problems and associated health risks. As a result, increased customer awareness of the potential adverse effects of cosmetics and skin issues is a crucial factor limiting market growth overall.
Rising Demand for Cosmetics- Cosmetics have become essential to the modern individual's lifestyle. Furthermore, an increase in awareness of exterior beauty and an individual's internal intellect has become one of the key driving forces for the use of the Asia Pacific cosmetics market. Along with women, males are increasingly using cosmetics daily, contributing to expanding the Asia Pacific cosmetics market demand. As a result of such shifting lifestyles, the Asia Pacific cosmetics market has expanded.
The category segment is divided into skin care, lip care, hair care, and oral hygiene. The skin care segment dominated the market, with a share of around 38.89% in 2022. The anti-ageing sub-segment of skin care is predicted to produce the most income over the forecasted period. Anti-ageing cosmeceuticals are designed to counteract the effects of ageing in users, slow down the ageing process, and cover the damages caused by climatic conditions (sun, cold, and wind), stress, smoking, and environmental irritants, among other things. People are spending more money on these items as wrinkles, fine lines, sagging, pores, and dryness become increasingly prevalent. The rapidly ageing Asian population has made ageing one of the most pressing cosmetic problems, resulting in a surge in the use of anti-ageing products.
The end-user segment is divided into men and women. The women segment dominated the market, with a share of around 54.69% in 2022. The strong tendency among women towards skincare and cosmetics products for makeup and hair was one of the key causes that significantly contributed to the most significant market share. The fact that women spend more money on cosmetics and beauty products than males does assist in explaining why women have the largest market share. As a result, a sizable proportion of women in the Asia Pacific use various cosmetics goods, such as skin and hair products containing natural components, contributing to the segment's most significant market share.
| Attribute | Description |
|---|---|
| Market Size | Revenue (USD Billion) |
| Market size value in 2022 | USD 130 Billion |
| Market size value in 2032 | USD 211.7 Billion |
| CAGR (2023 to 2032) | 5% |
| Historical data | 2019-2021 |
| Base Year | 2022 |
| Forecast | 2023-2032 |
| Segments | Category, End-User |
As per The Brainy Insights, the size of the Asia Pacific cosmetics market was valued USD 130 Billion in 2022 to USD 211.7 Billion by 2032.
Asia Pacific cosmetics market is growing at a CAGR of 5% during the forecast period 2023-2032.
The increasing product branding among millennials in the country will influence the market's growth.
Excessive packaging, plastic pollution, and unsustainable resource consumption are huge problems in the cosmetic market.
The rising demand for cosmetics is providing huge opportunities to the market.
Key players are L’Oréal, Avon Products Incorporation, Procter and Gamble (P&G) Corporation, Unilever, Oriflame Cosmetics, Revlon Incorporation, Kao Corporation, Estee Lauder Companies Incorporation, Shiseido Company, Limited, and Biotique among others.
1. Introduction
1.1. Objectives of the Study
1.2. Market Definition
1.3. Research Scope
1.4. Currency
1.5. Key Target Audience
2. Research Methodology and Assumptions
3. Executive Summary
4. Premium Insights
4.1. Porter’s Five Forces Analysis
4.2. Value Chain Analysis
4.3. Top Investment Pockets
4.3.1. Market Attractiveness Analysis by Category
4.3.2. Market Attractiveness Analysis by End-User
4.4. Industry Trends
5. Market Dynamics
5.1. Market Evaluation
5.2. Drivers
5.2.1. Increasing Product Branding
5.3. Restraints
5.3.1. Side Effects
5.4. Opportunities
5.4.1. Rising Demand for Cosmetics
6. Asia Pacific Cosmetics Market Analysis and Forecast, By Category
6.1. Segment Overview
6.2. Skin Care
6.3. Lip Care
6.4. Hair care
6.5. Oral Hygiene
7. Asia Pacific Cosmetics Market Analysis and Forecast, By End-User
7.1. Segment Overview
7.2. Men
7.3. Women
8. Asia Pacific Cosmetics Market-Competitive Landscape
8.1. Overview
8.2. Market Share of Key Players in the Cosmetics Market
8.2.1. U.S. Company Market Share
8.2.2. North America Company Market Share
8.2.3. Europe Company Market Share
8.2.4. APAC Company Market Share
8.3. Competitive Situations and Trends
8.3.1. Product Launches and Developments
8.3.2. Partnerships, Collaborations, and Agreements
8.3.3. Mergers & Acquisitions
8.3.4. Expansions
9. Company Profiles
9.1. L’Oréal
9.1.1. Business Overview
9.1.2. Company Snapshot
9.1.3. Company Market Share Analysis
9.1.4. Company Product Portfolio
9.1.5. Recent Developments
9.1.6. SWOT Analysis
9.2. Avon Products Incorporation
9.2.1. Business Overview
9.2.2. Company Snapshot
9.2.3. Company Market Share Analysis
9.2.4. Company Product Portfolio
9.2.5. Recent Developments
9.2.6. SWOT Analysis
9.3. Procter and Gamble (P&G) Corporation
9.3.1. Business Overview
9.3.2. Company Snapshot
9.3.3. Company Market Share Analysis
9.3.4. Company Product Portfolio
9.3.5. Recent Developments
9.3.6. SWOT Analysis
9.4. Unilever
9.4.1. Business Overview
9.4.2. Company Snapshot
9.4.3. Company Market Share Analysis
9.4.4. Company Product Portfolio
9.4.5. Recent Developments
9.4.6. SWOT Analysis
9.5. Oriflame Cosmetics
9.5.1. Business Overview
9.5.2. Company Snapshot
9.5.3. Company Market Share Analysis
9.5.4. Company Product Portfolio
9.5.5. Recent Developments
9.5.6. SWOT Analysis
9.6. Revlon Incorporation
9.6.1. Business Overview
9.6.2. Company Snapshot
9.6.3. Company Market Share Analysis
9.6.4. Company Product Portfolio
9.6.5. Recent Developments
9.6.6. SWOT Analysis
9.7. Kao Corporation
9.7.1. Business Overview
9.7.2. Company Snapshot
9.7.3. Company Market Share Analysis
9.7.4. Company Product Portfolio
9.7.5. Recent Developments
9.7.6. SWOT Analysis
9.8. Estee Lauder Companies Incorporation
1.1.1. Business Overview
1.1.2. Company Snapshot
1.1.3. Company Market Share Analysis
1.1.4. Company Product Portfolio
1.1.5. Recent Developments
1.1.6. SWOT Analysis
9.9. Shiseido Company, Limited
9.9.1. Business Overview
9.9.2. Company Snapshot
9.9.3. Company Market Share Analysis
9.9.4. Company Product Portfolio
9.9.5. Recent Developments
9.9.6. SWOT Analysis
9.10. Biotique
9.10.1. Business Overview
9.10.2. Company Snapshot
9.10.3. Company Market Share Analysis
9.10.4. Company Product Portfolio
9.10.5. Recent Developments
9.10.6. SWOT Analysis
List of Table
1. Asia Pacific Cosmetics Market, By Category, 2019-2032 (USD Billion)
2. Asia Pacific Skin Care, Cosmetics Market, 2019-2032 (USD Billion)
3. Asia Pacific Lip Care, Cosmetics Market, 2019-2032 (USD Billion)
4. Asia Pacific Hair Care, Cosmetics Market, 2019-2032 (USD Billion)
5. Asia Pacific Oral Hygiene, Cosmetics Market, 2019-2032 (USD Billion)
6. Asia Pacific Cosmetics Market, By End-User, 2019-2032 (USD Billion)
7. Asia Pacific Men, Cosmetics Market, 2019-2032 (USD Billion)
8. Asia Pacific Women, Cosmetics Market, 2019-2032 (USD Billion)
List of Figures
1. Asia Pacific Cosmetics Market Segmentation
2. Cosmetics Market: Research Methodology
3. Market Size Estimation Methodology: Bottom-Up Approach
4. Market Size Estimation Methodology: Top-Down Approach
5. Data Triangulation
6. Porter’s Five Forces Analysis
7. Value Chain Analysis
8. Asia Pacific Cosmetics Market Attractiveness Analysis by Category
9. Asia Pacific Cosmetics Market Attractiveness Analysis by End-User
10. Asia Pacific Cosmetics Market: Dynamics
11. Asia Pacific Cosmetics Market Share by Category (2022 & 2032)
12. Asia Pacific Cosmetics Market Share by End-User (2022 & 2032)
13. Asia Pacific Cosmetics Market Share by Company (2022)
This study forecasts revenue at the country level from 2019 to 2032. The Brainy Insights has segmented the Asia Pacific cosmetics market based on below mentioned segments:
Asia Pacific Cosmetics Market by Category:
Asia Pacific Cosmetics Market by End-User:
Research has its special purpose to undertake marketing efficiently. In this competitive scenario, businesses need information across all industry verticals; the information about customer wants, market demand, competition, industry trends, distribution channels etc. This information needs to be updated regularly because businesses operate in a dynamic environment. Our organization, The Brainy Insights incorporates scientific and systematic research procedures in order to get proper market insights and industry analysis for overall business success. The analysis consists of studying the market from a miniscule level wherein we implement statistical tools which helps us in examining the data with accuracy and precision.
Our research reports feature both; quantitative and qualitative aspects for any market. Qualitative information for any market research process are fundamental because they reveal the customer needs and wants, usage and consumption for any product/service related to a specific industry. This in turn aids the marketers/investors in knowing certain perceptions of the customers. Qualitative research can enlighten about the different product concepts and designs along with unique service offering that in turn, helps define marketing problems and generate opportunities. On the other hand, quantitative research engages with the data collection process through interviews, e-mail interactions, surveys and pilot studies. Quantitative aspects for the market research are useful to validate the hypotheses generated during qualitative research method, explore empirical patterns in the data with the help of statistical tools, and finally make the market estimations.
The Brainy Insights offers comprehensive research and analysis, based on a wide assortment of factual insights gained through interviews with CXOs and global experts and secondary data from reliable sources. Our analysts and industry specialist assume vital roles in building up statistical tools and analysis models, which are used to analyse the data and arrive at accurate insights with exceedingly informative research discoveries. The data provided by our organization have proven precious to a diverse range of companies, facilitating them to address issues such as determining which products/services are the most appealing, whether or not customers use the product in the manner anticipated, the purchasing intentions of the market and many others.
Our research methodology encompasses an idyllic combination of primary and secondary initiatives. Key phases involved in this process are listed below:

The phase involves the gathering and collecting of market data and its related information with the help of different sources & research procedures.

The data procurement stage involves in data gathering and collecting through various data sources.
This stage involves in extensive research. These data sources includes:
Purchased Database: Purchased databases play a crucial role in estimating the market sizes irrespective of the domain. Our purchased database includes:
Primary Research: The Brainy Insights interacts with leading companies and experts of the concerned domain to develop the analyst team’s market understanding and expertise. It improves and substantiates every single data presented in the market reports. Primary research mainly involves in telephonic interviews, E-mail interactions and face-to-face interviews with the raw material providers, manufacturers/producers, distributors, & independent consultants. The interviews that we conduct provides valuable data on market size and industry growth trends prevailing in the market. Our organization also conducts surveys with the various industry experts in order to gain overall insights of the industry/market. For instance, in healthcare industry we conduct surveys with the pharmacists, doctors, surgeons and nurses in order to gain insights and key information of a medical product/device/equipment which the customers are going to usage. Surveys are conducted in the form of questionnaire designed by our own analyst team. Surveys plays an important role in primary research because surveys helps us to identify the key target audiences of the market. Additionally, surveys helps to identify the key target audience engaged with the market. Our survey team conducts the survey by targeting the key audience, thus gaining insights from them. Based on the perspectives of the customers, this information is utilized to formulate market strategies. Moreover, market surveys helps us to understand the current competitive situation of the industry. To be precise, our survey process typically involve with the 360 analysis of the market. This analytical process begins by identifying the prospective customers for a product or service related to the market/industry to obtain data on how a product/service could fit into customers’ lives.

Secondary Research: The secondary data sources includes information published by the on-profit organizations such as World bank, WHO, company fillings, investor presentations, annual reports, national government documents, statistical databases, blogs, articles, white papers and others. From the annual report, we analyse a company’s revenue to understand the key segment and market share of that organization in a particular region. We analyse the company websites and adopt the product mapping technique which is important for deriving the segment revenue. In the product mapping method, we select and categorize the products offered by the companies catering to domain specific market, deduce the product revenue for each of the companies so as to get overall estimation of the market size. We also source data and analyses trends based on information received from supply side and demand side intermediaries in the value chain. The supply side denotes the data gathered from supplier, distributor, wholesaler and the demand side illustrates the data gathered from the end customers for respective market domain.

The supply side for a domain specific market is analysed by:
The demand side for the market is estimated through:
In-house Library: Apart from these third-party sources, we have our in-house library of qualitative and quantitative information. Our in-house database includes market data for various industry and domains. These data are updated on regular basis as per the changing market scenario. Our library includes, historic databases, internal audit reports and archives.
Sometimes there are instances where there is no metadata or raw data available for any domain specific market. For those cases, we use our expertise to forecast and estimate the market size in order to generate comprehensive data sets. Our analyst team adopt a robust research technique in order to produce the estimates:
Data Synthesis: This stage involves the analysis & mapping of all the information obtained from the previous step. It also involves in scrutinizing the data for any discrepancy observed while data gathering related to the market. The data is collected with consideration to the heterogeneity of sources. Robust scientific techniques are in place for synthesizing disparate data sets and provide the essential contextual information that can orient market strategies. The Brainy Insights has extensive experience in data synthesis where the data passes through various stages:


Market Deduction & Formulation: The final stage comprises of assigning data points at appropriate market spaces so as to deduce feasible conclusions. Analyst perspective & subject matter expert based holistic form of market sizing coupled with industry analysis also plays a crucial role in this stage.
This stage involves in finalization of the market size and numbers that we have collected from data integration step. With data interpolation, it is made sure that there is no gap in the market data. Successful trend analysis is done by our analysts using extrapolation techniques, which provide the best possible forecasts for the market.
Data Validation & Market Feedback: Validation is the most important step in the process. Validation & re-validation via an intricately designed process helps us finalize data-points to be used for final calculations.

The Brainy Insights interacts with leading companies and experts of the concerned domain to develop the analyst team’s market understanding and expertise. It improves and substantiates every single data presented in the market reports. The data validation interview and discussion panels are typically composed of the most experienced industry members. The participants include, however, are not limited to:
Moreover, we always validate our data and findings through primary respondents from all the major regions we are working on.


Free Customization
Fortune 500 Clients
Free Yearly Update On Purchase Of Multi/Corporate License
Companies Served Till Date