- +1-315-215-1633
- sales@thebrainyinsights.com

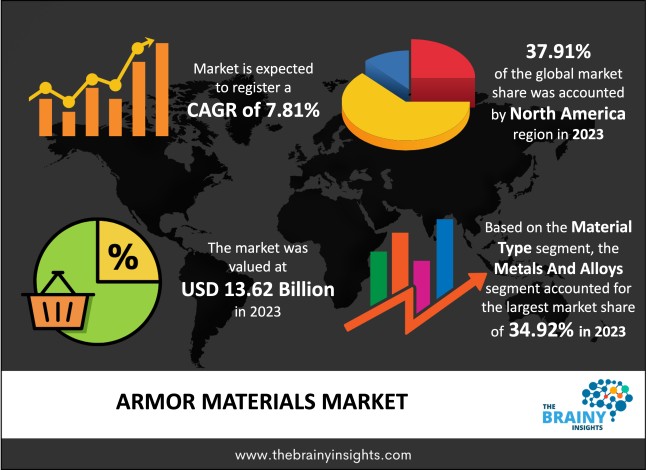
The global armor materials market was valued at USD 13.62 Billion in 2023 and grew at a CAGR of 7.81% from 2024 to 2033. The market is expected to reach USD 28.89 Billion by 2033. The growth of the armor materials market can be attributed to the rising need for enhanced security systems. Further, the increasing investment in military modernization has played a pivotal role in the market growth.
Armour is a protective covering that guards against harm from projectiles, people, and hazardous situations or activities. Armour has historically been made of titanium, steel, and ceramic materials. Modern technology has made it possible to produce protective materials for various types of clothing that are both lightweight and appropriate for the risks associated with sophisticated warfare. Such materials have regulated micro-structures that guarantee improved efficiency and durability and can give low weight for high hardness. These materials provide design diversity and can neutralize high-velocity missiles in combat situations. An item's durability multiplier, enchantability, armour values, sound events, knockback resistance, toughness, and repair items are all determined by its armour substance.
Get an overview of this study by requesting a free sample
Increasing concerns about safety among countries: Compared to other forms of diplomatic disputes involving maritime, economic, or other issues, territorial disputes are more likely to result in militarized conflict. Countries with one or more territorial disputes have fought each other in the great majority of interstate conflicts. Governments that share borders are more likely to go to war with one another than governments that do not, particularly if they dispute over particular land areas. Due to the escalating territorial conflicts and geopolitical tensions, the demand for armour materials is growing more quickly. Due to internal disputes, the need for protective equipment to maintain national security has increased in many countries. This increases the need for armour material as it is used in such protective equipment.
Fluctuating cost of materials: The growth of the armour materials market is due to the high production costs of most materials and problems with obtaining raw materials. The fluctuating price of these raw materials greatly impacts the armor materials market. As the prices of raw materials increase, the total cost of the product also increases, which decreases the demand.
Increasing investment in military modernization programmes: Many nations have reorganized their armed forces to create powerful, deployable, and effective military capabilities due to improved battle tactics and increased cost consciousness in the security industry. These developments have spurred innovation in specialized security equipment that offers improved functionality and service and lower maintenance costs. These requirements also spurred the creation of military modernization programmes, which improved the armour. Global military operations are changing, including doctrine, security protocols, training initiatives, and personnel and force structures. The investments in modernization programmes are increasing for enhancing air defence systems, mobility of the armed forces, and creating a more professional army.
The regions analyzed for the market include North America, Europe, South America, Asia Pacific, the Middle East, and Africa. North America emerged as the most significant Armor Materials market, with a 37.91% market revenue share in 2023.
North America region will account for the largest market share with revenue growth. The region has a high demand for armour materials to meet the required manufacturing quantity of protective equipment. The growing investment in military modernization programmes is attracting more regional manufacturers. Further, developing advanced armor equipment increases the demand for armor materials.
North America region Armor Materials Market Share in 2023 - 37.91%
www.thebrainyinsights.com
Check the geographical analysis of this market by requesting a free sample
The material type segment is divided into composites, metals and alloys, fiberglass, para-aramid fiber, and UHMWPE. The composites segment further includes fabrics, matrix materials, fibers, prepegs, 3D composites, and hybrid composites. The metals and alloys segment further includes aluminum, ceramics, titanium, high-density steel, and others. The metals and alloys segment dominated the market, with a share of around 34.92% in 2023. Metals and alloys, such as titanium, high-density steel, aluminium, etc, are used in military, vehicle and aerospace applications. As titanium and its alloys are used more often in military trucks and armour, the market for armour materials is expected to expand.
The application segment is divided into body armor, vehicle armor, civil armor, aerospace armor and marine armor. The vehicle armor segment dominated the market, with a share of around 39.41% in 2023. The purpose of the vehicle and the required level of protection determine the materials used in armoured vehicles. Improvised vehicle armour comprises protective materials applied to a truck, car, or tank with readily available resources.
| Attribute | Description |
|---|---|
| Market Size | Revenue (USD Billion) |
| Market size value in 2023 | USD 13.62 Billion |
| Market size value in 2033 | USD 28.89 Billion |
| CAGR (2024 to 2033) | 7.81% |
| Historical data | 2020-2022 |
| Base Year | 2023 |
| Forecast | 2024-2033 |
| Region | The regions analyzed for the market are Asia Pacific, Europe, South America, North America, and Middle East & Africa. Furthermore, the regions are further analyzed at the country level. |
| Segments | Material Type and Application |
As per The Brainy Insights, the size of the armor materials market was valued 13.62 Billion in 2023 to USD 28.89 Billion by 2033.
Global armor materials market is growing at a CAGR of 7.81% during the forecast period 2024-2033.
The global armor materials market has been segmented based on material type, application, and regions. Metals and alloys led the market in 2023 in the material type segment. Vehicle armor led the market in 2023 in the application segment.
North America region emerged as the largest market for the armor materials.
The market's growth will be influenced by the growing concerns over territorial disputes.
The fluctuating cost of materials can hamper the market growth.
The increasing investments in military modernization programmes are providing huge opportunities to the market.
1. Introduction
1.1. Objectives of the Study
1.2. Market Definition
1.3. Research Scope
1.4. Currency
1.5. Key Target Audience
2. Research Methodology and Assumptions
3. Executive Summary
4. Premium Insights
4.1. Porter’s Five Forces Analysis
4.2. Value Chain Analysis
4.3. Top Investment Pockets
4.3.1. Market Attractiveness Analysis by Material Type
4.3.2. Market Attractiveness Analysis by Application
4.3.3. Market Attractiveness Analysis by Region
4.4. Industry Trends
5. Market Dynamics
5.1. Market Evaluation
5.2. Drivers
5.2.1. Increasing concerns over border safety
5.3. Restraints
5.3.1. Fluctuating cost of raw materials
5.4. Opportunities
5.4.1. Increasing investment in military modernization
5.5. Challenges
5.5.1. Stringent regulations
6. Global Armor Materials Market Analysis and Forecast, By Material Type
6.1. Segment Overview
6.2. Composites
6.2.1. Fabrics
6.2.2. Matrix Materials
6.2.3. Fibers
6.2.4. Prepegs
6.2.5. 3D Composites
6.2.6. Hybrid Composites
6.3. Metals and Alloys
6.3.1. Aluminum
6.3.2. Ceramics
6.3.3. Titanium
6.3.4. High-Density Steel
6.3.5. Others
6.4. Fiberglass
6.5. Para-Aramid Fiber
6.6. UHMWPE
7. Global Armor Materials Market Analysis and Forecast, By Application
7.1. Segment Overview
7.2. Body Armor
7.3. Vehicle Armor
7.4. Civil Armor
7.5. Aerospace Armor
7.6. Marine Armor
8. Global Armor Materials Market Analysis and Forecast, By Regional Analysis
8.1. Segment Overview
8.2. North America
8.2.1. U.S.
8.2.2. Canada
8.2.3. Mexico
8.3. Europe
8.3.1. Germany
8.3.2. France
8.3.3. U.K.
8.3.4. Italy
8.3.5. Spain
8.4. Asia-Pacific
8.4.1. Japan
8.4.2. China
8.4.3. India
8.5. South America
8.5.1. Brazil
8.6. Middle East and Africa
8.6.1. UAE
8.6.2. South Africa
9. Global Armor Materials Market-Competitive Landscape
9.1. Overview
9.2. Market Share of Key Players in the Armor Materials Market
9.2.1. Global Company Market Share
9.2.2. North America Company Market Share
9.2.3. Europe Company Market Share
9.2.4. APAC Company Market Share
9.3. Competitive Situations and Trends
9.3.1. Product Launches and Developments
9.3.2. Partnerships, Collaborations, and Agreements
9.3.3. Mergers & Acquisitions
9.3.4. Expansions
10. Company Profiles
10.1. 3M
10.1.1. Business Overview
10.1.2. Company Snapshot
10.1.3. Company Market Share Analysis
10.1.4. Company Product Portfolio
10.1.5. Recent Developments
10.1.6. SWOT Analysis
10.2. Allegheny Technologies Incorporated
10.2.1. Business Overview
10.2.2. Company Snapshot
10.2.3. Company Market Share Analysis
10.2.4. Company Product Portfolio
10.2.5. Recent Developments
10.2.6. SWOT Analysis
10.3. AGY Holding Corp.
10.3.1. Business Overview
10.3.2. Company Snapshot
10.3.3. Company Market Share Analysis
10.3.4. Company Product Portfolio
10.3.5. Recent Developments
10.3.6. SWOT Analysis
10.4. CeramTec GmbH
10.4.1. Business Overview
10.4.2. Company Snapshot
10.4.3. Company Market Share Analysis
10.4.4. Company Product Portfolio
10.4.5. Recent Developments
10.4.6. SWOT Analysis
10.5. CoorsTek Inc.
10.5.1. Business Overview
10.5.2. Company Snapshot
10.5.3. Company Market Share Analysis
10.5.4. Company Product Portfolio
10.5.5. Recent Developments
10.5.6. SWOT Analysis
10.6. Compagnie de Saint-Gobain SA
10.6.1. Business Overview
10.6.2. Company Snapshot
10.6.3. Company Market Share Analysis
10.6.4. Company Product Portfolio
10.6.5. Recent Developments
10.6.6. SWOT Analysis
10.7. DSM NV
10.7.1. Business Overview
10.7.2. Company Snapshot
10.7.3. Company Market Share Analysis
10.7.4. Company Product Portfolio
10.7.5. Recent Developments
10.7.6. SWOT Analysis
10.8. Honeywell International Inc.
10.8.1. Business Overview
10.8.2. Company Snapshot
10.8.3. Company Market Share Analysis
10.8.4. Company Product Portfolio
10.8.5. Recent Developments
10.8.6. SWOT Analysis
10.9. E. I. Du Pont De Nemours and Company
10.9.1. Business Overview
10.9.2. Company Snapshot
10.9.3. Company Market Share Analysis
10.9.4. Company Product Portfolio
10.9.5. Recent Developments
10.9.6. SWOT Analysis
10.10. Morgan Advanced Materials
10.10.1. Business Overview
10.10.2. Company Snapshot
10.10.3. Company Market Share Analysis
10.10.4. Company Product Portfolio
10.10.5. Recent Developments
10.10.6. SWOT Analysis
10.11. Royal TenCate NV
10.11.1. Business Overview
10.11.2. Company Snapshot
10.11.3. Company Market Share Analysis
10.11.4. Company Product Portfolio
10.11.5. Recent Developments
10.11.6. SWOT Analysis
10.12. PPG Industries Inc.
10.12.1. Business Overview
10.12.2. Company Snapshot
10.12.3. Company Market Share Analysis
10.12.4. Company Product Portfolio
10.12.5. Recent Developments
10.12.6. SWOT Analysis
10.13. Saab AB
10.13.1. Business Overview
10.13.2. Company Snapshot
10.13.3. Company Market Share Analysis
10.13.4. Company Product Portfolio
10.13.5. Recent Developments
10.13.6. SWOT Analysis
10.14. Tata Steel Limited
10.14.1. Business Overview
10.14.2. Company Snapshot
10.14.3. Company Market Share Analysis
10.14.4. Company Product Portfolio
10.14.5. Recent Developments
10.14.6. SWOT Analysis
10.15. Saint-Gobain SA
10.15.1. Business Overview
10.15.2. Company Snapshot
10.15.3. Company Market Share Analysis
10.15.4. Company Product Portfolio
10.15.5. Recent Developments
10.15.6. SWOT Analysis
List of Table
1. Global Armor Materials Market, By Material Type, 2020-2033 (USD Billion)
2. Global Composites, Armor Materials Market, By Region, 2020-2033 (USD Billion)
3. Global Metals and Alloys, Armor Materials Market, By Region, 2020-2033 (USD Billion)
4. Global Fiberglass, Armor Materials Market, By Region, 2020-2033 (USD Billion)
5. Global Para-Aramid Fiber, Armor Materials Market, By Region, 2020-2033 (USD Billion)
6. Global UHMWPE, Armor Materials Market, By Region, 2020-2033 (USD Billion)
7. Global Armor Materials Market, By Application, 2020-2033 (USD Billion)
8. Global Body Armor, Armor Materials Market, By Region, 2020-2033 (USD Billion)
9. Global Vehicle Armor, Armor Materials Market, By Region, 2020-2033 (USD Billion)
10. Global Civil Armor, Armor Materials Market, By Region, 2020-2033 (USD Billion)
11. Global Aerospace Armor, Armor Materials Market, By Region, 2020-2033 (USD Billion)
12. Global Marine Armor, Armor Materials Market, By Region, 2020-2033 (USD Billion)
13. Global Armor Materials Market, By Region, 2020-2033 (USD Billion)
14. North America Armor Materials Market, By Material Type, 2020-2033 (USD Billion)
15. North America Armor Materials Market, By Application, 2020-2033 (USD Billion)
16. U.S. Armor Materials Market, By Material Type, 2020-2033 (USD Billion)
17. U.S. Armor Materials Market, By Application, 2020-2033 (USD Billion)
18. Canada Armor Materials Market, By Material Type, 2020-2033 (USD Billion)
19. Canada Armor Materials Market, By Application, 2020-2033 (USD Billion)
20. Mexico Armor Materials Market, By Material Type, 2020-2033 (USD Billion)
21. Mexico Armor Materials Market, By Application, 2020-2033 (USD Billion)
22. Europe Armor Materials Market, By Material Type, 2020-2033 (USD Billion)
23. Europe Armor Materials Market, By Application, 2020-2033 (USD Billion)
24. Germany Armor Materials Market, By Material Type, 2020-2033 (USD Billion)
25. Germany Armor Materials Market, By Application, 2020-2033 (USD Billion)
26. France Armor Materials Market, By Material Type, 2020-2033 (USD Billion)
27. France Armor Materials Market, By Application, 2020-2033 (USD Billion)
28. U.K. Armor Materials Market, By Material Type, 2020-2033 (USD Billion)
29. U.K. Armor Materials Market, By Application, 2020-2033 (USD Billion)
30. Italy Armor Materials Market, By Material Type, 2020-2033 (USD Billion)
31. Italy Armor Materials Market, By Application, 2020-2033 (USD Billion)
32. Spain Armor Materials Market, By Material Type, 2020-2033 (USD Billion)
33. Spain Armor Materials Market, By Application, 2020-2033 (USD Billion)
34. Asia Pacific Armor Materials Market, By Material Type, 2020-2033 (USD Billion)
35. Asia Pacific Armor Materials Market, By Application, 2020-2033 (USD Billion)
36. Japan Armor Materials Market, By Material Type, 2020-2033 (USD Billion)
37. Japan Armor Materials Market, By Application, 2020-2033 (USD Billion)
38. China Armor Materials Market, By Material Type, 2020-2033 (USD Billion)
39. China Armor Materials Market, By Application, 2020-2033 (USD Billion)
40. India Armor Materials Market, By Material Type, 2020-2033 (USD Billion)
41. India Armor Materials Market, By Application, 2020-2033 (USD Billion)
42. South America Armor Materials Market, By Material Type, 2020-2033 (USD Billion)
43. South America Armor Materials Market, By Application, 2020-2033 (USD Billion)
44. Brazil Armor Materials Market, By Material Type, 2020-2033 (USD Billion)
45. Brazil Armor Materials Market, By Application, 2020-2033 (USD Billion)
46. Middle East and Africa Armor Materials Market, By Material Type, 2020-2033 (USD Billion)
47. Middle East and Africa Armor Materials Market, By Application, 2020-2033 (USD Billion)
48. UAE Armor Materials Market, By Material Type, 2020-2033 (USD Billion)
49. UAE Armor Materials Market, By Application, 2020-2033 (USD Billion)
50. South Africa Armor Materials Market, By Material Type, 2020-2033 (USD Billion)
51. South Africa Armor Materials Market, By Application, 2020-2033 (USD Billion)
List of Figures
1. Global Armor Materials Market Segmentation
2. Armor Materials Market: Research Methodology
3. Market Size Estimation Methodology: Bottom-Up Approach
4. Market Size Estimation Methodology: Top-Down Approach
5. Data Triangulation
6. Porter’s Five Forces Analysis
7. Value Chain Analysis
8. Global Armor Materials Market Attractiveness Analysis by Material Type
9. Global Armor Materials Market Attractiveness Analysis by Application
10. Global Armor Materials Market Attractiveness Analysis by Region
11. Global Armor Materials Market: Dynamics
12. Global Armor Materials Market Share by Material Type (2023 & 2033)
13. Global Armor Materials Market Share by Application (2023 & 2033)
14. Global Armor Materials Market Share by Regions (2023 & 2033)
15. Global Armor Materials Market Share by Company (2023)
This study forecasts revenue at global, regional, and country levels from 2020 to 2033. The Brainy Insights has segmented the global armor materials market based on below mentioned segments:
Global Armor Materials Market by Type:
Global Armor Materials Market by Application:
Global Armor Materials Market by Region:
Research has its special purpose to undertake marketing efficiently. In this competitive scenario, businesses need information across all industry verticals; the information about customer wants, market demand, competition, industry trends, distribution channels etc. This information needs to be updated regularly because businesses operate in a dynamic environment. Our organization, The Brainy Insights incorporates scientific and systematic research procedures in order to get proper market insights and industry analysis for overall business success. The analysis consists of studying the market from a miniscule level wherein we implement statistical tools which helps us in examining the data with accuracy and precision.
Our research reports feature both; quantitative and qualitative aspects for any market. Qualitative information for any market research process are fundamental because they reveal the customer needs and wants, usage and consumption for any product/service related to a specific industry. This in turn aids the marketers/investors in knowing certain perceptions of the customers. Qualitative research can enlighten about the different product concepts and designs along with unique service offering that in turn, helps define marketing problems and generate opportunities. On the other hand, quantitative research engages with the data collection process through interviews, e-mail interactions, surveys and pilot studies. Quantitative aspects for the market research are useful to validate the hypotheses generated during qualitative research method, explore empirical patterns in the data with the help of statistical tools, and finally make the market estimations.
The Brainy Insights offers comprehensive research and analysis, based on a wide assortment of factual insights gained through interviews with CXOs and global experts and secondary data from reliable sources. Our analysts and industry specialist assume vital roles in building up statistical tools and analysis models, which are used to analyse the data and arrive at accurate insights with exceedingly informative research discoveries. The data provided by our organization have proven precious to a diverse range of companies, facilitating them to address issues such as determining which products/services are the most appealing, whether or not customers use the product in the manner anticipated, the purchasing intentions of the market and many others.
Our research methodology encompasses an idyllic combination of primary and secondary initiatives. Key phases involved in this process are listed below:

The phase involves the gathering and collecting of market data and its related information with the help of different sources & research procedures.

The data procurement stage involves in data gathering and collecting through various data sources.
This stage involves in extensive research. These data sources includes:
Purchased Database: Purchased databases play a crucial role in estimating the market sizes irrespective of the domain. Our purchased database includes:
Primary Research: The Brainy Insights interacts with leading companies and experts of the concerned domain to develop the analyst team’s market understanding and expertise. It improves and substantiates every single data presented in the market reports. Primary research mainly involves in telephonic interviews, E-mail interactions and face-to-face interviews with the raw material providers, manufacturers/producers, distributors, & independent consultants. The interviews that we conduct provides valuable data on market size and industry growth trends prevailing in the market. Our organization also conducts surveys with the various industry experts in order to gain overall insights of the industry/market. For instance, in healthcare industry we conduct surveys with the pharmacists, doctors, surgeons and nurses in order to gain insights and key information of a medical product/device/equipment which the customers are going to usage. Surveys are conducted in the form of questionnaire designed by our own analyst team. Surveys plays an important role in primary research because surveys helps us to identify the key target audiences of the market. Additionally, surveys helps to identify the key target audience engaged with the market. Our survey team conducts the survey by targeting the key audience, thus gaining insights from them. Based on the perspectives of the customers, this information is utilized to formulate market strategies. Moreover, market surveys helps us to understand the current competitive situation of the industry. To be precise, our survey process typically involve with the 360 analysis of the market. This analytical process begins by identifying the prospective customers for a product or service related to the market/industry to obtain data on how a product/service could fit into customers’ lives.

Secondary Research: The secondary data sources includes information published by the on-profit organizations such as World bank, WHO, company fillings, investor presentations, annual reports, national government documents, statistical databases, blogs, articles, white papers and others. From the annual report, we analyse a company’s revenue to understand the key segment and market share of that organization in a particular region. We analyse the company websites and adopt the product mapping technique which is important for deriving the segment revenue. In the product mapping method, we select and categorize the products offered by the companies catering to domain specific market, deduce the product revenue for each of the companies so as to get overall estimation of the market size. We also source data and analyses trends based on information received from supply side and demand side intermediaries in the value chain. The supply side denotes the data gathered from supplier, distributor, wholesaler and the demand side illustrates the data gathered from the end customers for respective market domain.

The supply side for a domain specific market is analysed by:
The demand side for the market is estimated through:
In-house Library: Apart from these third-party sources, we have our in-house library of qualitative and quantitative information. Our in-house database includes market data for various industry and domains. These data are updated on regular basis as per the changing market scenario. Our library includes, historic databases, internal audit reports and archives.
Sometimes there are instances where there is no metadata or raw data available for any domain specific market. For those cases, we use our expertise to forecast and estimate the market size in order to generate comprehensive data sets. Our analyst team adopt a robust research technique in order to produce the estimates:
Data Synthesis: This stage involves the analysis & mapping of all the information obtained from the previous step. It also involves in scrutinizing the data for any discrepancy observed while data gathering related to the market. The data is collected with consideration to the heterogeneity of sources. Robust scientific techniques are in place for synthesizing disparate data sets and provide the essential contextual information that can orient market strategies. The Brainy Insights has extensive experience in data synthesis where the data passes through various stages:


Market Deduction & Formulation: The final stage comprises of assigning data points at appropriate market spaces so as to deduce feasible conclusions. Analyst perspective & subject matter expert based holistic form of market sizing coupled with industry analysis also plays a crucial role in this stage.
This stage involves in finalization of the market size and numbers that we have collected from data integration step. With data interpolation, it is made sure that there is no gap in the market data. Successful trend analysis is done by our analysts using extrapolation techniques, which provide the best possible forecasts for the market.
Data Validation & Market Feedback: Validation is the most important step in the process. Validation & re-validation via an intricately designed process helps us finalize data-points to be used for final calculations.

The Brainy Insights interacts with leading companies and experts of the concerned domain to develop the analyst team’s market understanding and expertise. It improves and substantiates every single data presented in the market reports. The data validation interview and discussion panels are typically composed of the most experienced industry members. The participants include, however, are not limited to:
Moreover, we always validate our data and findings through primary respondents from all the major regions we are working on.


Free Customization
Fortune 500 Clients
Free Yearly Update On Purchase Of Multi/Corporate License
Companies Served Till Date