- +1-315-215-1633
- sales@thebrainyinsights.com

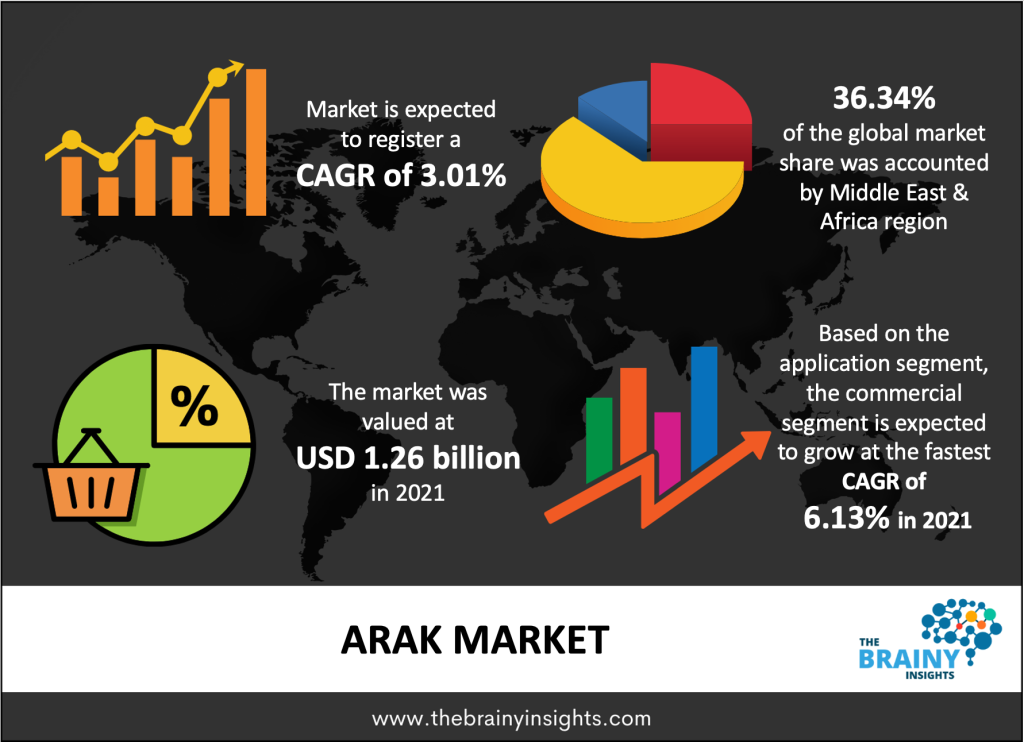
The global arak market is expected to reach USD 1.64 billion by 2030, at a CAGR of 3.01% from 2022 to 2030. Arak market growth would be driven by rising consumer interest and awareness about traditional drinks such as arak. The growing demand for alcoholic beverages, given the increase in the young population and the rise in disposable income of consumers, will also facilitate the market's growth. The prominent historical prestige of arak as a social beverage at gatherings, dinners, or get-togethers in the Middle East has contributed to the growing arak market. The rising popularity of arak beyond the Middle East and Africa has led to increased commercial production of arak which will benefit the market. The increase in the number of bars, restaurants, and pubs worldwide will contribute to the growth of the arak market as arak is in high demand for cocktails and other alcoholic beverage mixtures.
Arak is a traditional alcoholic beverage consumed in the Middle East. It has a high concentration of alcohol in it, around 40%-60%. Waste is usually added to arak to dilute it, and it turns arak into a translucent milky white color. The drink's color and potency have nick-named it 'the milk of the lions' in the Middle East. The main ingredients of arak are grapes and anise seeds. Anise seeds are gathered from anise pants, which, when crushed, give a licorice taste, the dominant taste of arak. Arak is consumed in several countries in the Middle East and Africa. However, a local variant of arak is consumed depending on the country. For instance, some arak drinks have dates, figs, or molasses. Arak is a very popular drink in the Middle East and Africa, and it is served at dinner, social gatherings, and get-togethers. Moderate drinking of arak can accelerate blood flow, strengthen the body, helps maintain a healthy heart, prevent nervous clotting, treat sleeping disorders, and act as a stress relief. The popularity of arak in Lebanon has made it its national drink. Also, arak is conventionally the national drink of Jordan, Egypt, and Syria. It is consumed in Israel and Palestine as well.
Get an overview of this study by requesting a free sample
Rising awareness about arak
Consumers' growing interest in traditional drinks like arak will drive the market for arak. The commercial production of arak has been gaining traction given the growing popularity of arak in North America, Europe, and the Asia Pacific. Furthermore, the development of arak variants or the use of arak in cocktails contributes to the increasing demand for arak globally.
High production costs
Arak making is labor-intensive and requires detailed attention to the processes, which consumes time and increases costs. Arak production is an all-natural process and does not involve using protective or resistant sprays to help minimize the adverse effects of drastic weather changes on its ingredients like grapes and anise seeds. The ingredients used to prepare arak are native or indigenous to certain areas only, thereby increasing the cost of production. The volatile geopolitical situation in and around the Middle East and Africa also contributes to disrupted production and supply chain bottlenecks. Such disruptions can lead to the loss of production and turn the arak production into an expensive endeavor for the market players. Therefore, the high production costs of arak will hamper the market's growth.
The increasing number of liquor stores, bars, pubs, and restaurants
The changing demographics in developing countries, wherein the proportion of the young population is the highest, has contributed to the increasing demand for restaurants, pubs, and bars. The number of nightclubs, bars, and pubs is witnessing a similar increase in the developed world, given the high per capita income of the population in these nations. The growing trend of multiple offers being provided at these outlets and a varied menu of cocktails has contributed to their rising popularity. With the rise in the number and popularity of liquor stores, pubs, bars, and restaurants, the arak market will also witness a significant rise. Market players in the arak market can take advantage of the growing number of bars, pubs, and restaurants by partnering and collaborating with them to increase the number of arak consumers.
Absence of a universal regulatory body
Several countries produce arak, and all have different standards and regulatory procedures to be fulfilled to label the alcoholic beverage as arak. The definition of arak differs from country to country, and this might be a challenge while exporting or expanding arak production globally. The proportion or concentration of grapes, anise seeds, or other local spices makes it challenging to standardize arak as a specific type of drink. Additionally, every country develops its arak variant. There is no universal regulatory authority governing the arak identification, production, distribution, consumption, import, and export. The commercial production of arak is also not monitored by a single and universal authority. The ambiguity and lack of accountability can lead to confusion among consumers, market players, and other stakeholders and hamper the growth of this market.
The global arak market has been segmented based on product type, application, distribution channel, and region.
The product type segment is divided into anise seeds, merwah grapes, and others. The merwah grapes segment dominated the market with a market share of around 53% in 2021. Merwah grapes have been used in arak production for centuries. Merwah grape is an ancient indigenous white grape primarily grown in the Lebanese territory. It has a citrusy flavor. Stand-alone merwah grape-based arak is the most well-known form of arak in East, central Africa, and west Asia. Additionally, a range of varieties is being introduced frequently to further the sales of arak beyond these regions. The attached symbolism of arak with social gatherings, meetings, and heritage in the Middle East also bodes well for the segment's growth.
The application segment is divided into residential and commercial. Over the forecast period, the commercial segment is expected to grow at the fastest CAGR of 6.13%. The growing presence of arak restaurants, bars, and hotels will aid the future commercial segment's growth. Similarly, the rising emphasis on spreading the middle eastern alcoholic beverage to other parts of the world will also facilitate the development of the segment and the market. The increasing awareness about arak and its benefits when consumed in moderation is gaining traction globally and will bode well for the commercial segment.
The distribution channel segment is divided into liquor shops, bars & pubs, travel retail, and others. In 2021, the liquor shops segment dominated the market, accounting for around 37% of global revenue. The increasing presence of liquor shops in tier-1 & tier-2 cities, providing easy accessibility to consumers with a wide variety of flavors and products of numerous brands in one place, are some contributing factors making liquor shops the most popular destination for purchasing arak.
The regions analyzed for the market include North America, Europe, South America, Asia Pacific, and the Middle East and Africa. The Middle East and Africa emerged as the largest market for the global arak market, with a 36.34% share of the market revenue in 2021.
The Middle East and Africa currently dominate the arak market due to the region's mature and well-established arak-making industry. Also, arak is a traditional alcoholic beverage in the Middle East. Furthermore, it is the national alcoholic drink of Jordan, Syria, Palestine, and Lebanon. It is also consumed in Israel and UAE. The discovery of merwah grapes in the Lebanese territory has increased the arak production in the African peninsula. It is a staple drink in the Middle East and Africa when inviting friends or family for lunch/dinner or hosting social gatherings. The presence of significant arak producers in the region also contributes to its dominance in the arak market. The Asia Pacific is expected to rise in the forecast period due to the region's increasing population of arak consumers. The growing presence of pubs, bars, and arak restaurants will also contribute to the regional market's growth. The increasing use of arak cocktails attracts more consumers, thereby facilitating the market's growth.
The Middle East and Africa Region Arak Market Share in 2021 - 36.34%
www.thebrainyinsights.com
Check the geographical analysis of this market by requesting a free sample
On August 5, 2022, Bali Governor Wayan Koster encouraged the island's hotels and restaurants to feature the alcoholic beverage more prominently to promote Bali's indigenous liquor, arak.
| Attribute | Description |
|---|---|
| Market Size | Revenue (USD Million), Volume (MT) |
| Market size value in 2021 | USD 1.26 billion |
| Market size value in 2030 | USD 1.64 billion |
| CAGR (2022 to 2030) | 3.01% |
| Historical data | 2019-2020 |
| Base Year | 2021 |
| Forecast | 2022-2030 |
| Segments | product type , application, distribution channel |
| Regional Segments | The regions analyzed for the market are Europe, Asia Pacific, North America, South America, and Middle East & Africa. Furthermore, the regions are further analyzed at the country level. |
As per The Brainy Insights, the size of the arak market was valued at USD 1.26 billion in 2021 to USD 1.64 billion by 2030.
Global arak market is growing at a CAGR of 3.01% during the forecast period 2022-2030.
The global arak market has been segmented based on product type, application, distribution channel and regions. The merwah grapes segment led the market in 2021.
The Middle East and Africa emerged as the largest market for the Arak.
High production costs could hamper the market growth.
Increasing number of liquor stores, bars, pubs and restaurants will provide huge opportunities to the market.
1. Introduction
1.1. Objectives of the Study
1.2. Market Definition
1.3. Research Scope
1.4. Currency
1.5. Key Target Audience
2. Research Methodology and Assumptions
3. Executive Summary
4. Premium Insights
4.1. Porter’s Five Forces Analysis
4.2. Value Chain Analysis
4.3. Top Investment Pockets
4.3.1. Market Attractiveness Analysis By Product Type
4.3.2. Market Attractiveness Analysis By Application
4.3.3. Market Attractiveness Analysis By Distribution Channel
4.3.4. Market Attractiveness Analysis By Region
4.4. Industry Trends
5. Market Dynamics
5.1. Market Evaluation
5.2. Drivers
5.2.1. Rising awareness about arak
5.3. Restraints
5.3.1. High production costs
5.4. Opportunities
5.4.1. Increasing number of liquor stores, bars, pubs and restaurants
5.5. Challenges
5.5.1. Absence of universal regulatory body
6. Global Arak Market Analysis and Forecast, By Product Type
6.1. Segment Overview
6.2. Anise Seeds
6.3. Merwah Grapes
6.4. Others
7. Global Arak Market Analysis and Forecast, By Application
7.1. Segment Overview
7.2. Residential
7.3. Commercial
8. Global Arak Market Analysis and Forecast, By Distribution Channel
8.1. Segment Overview
8.2. Liquor Shops
8.3. Bars & Pubs
8.4. Travel Retail
8.5. Others
9. Global Arak Market Analysis and Forecast, By Regional Analysis
9.1. Segment Overview
9.2. North America
9.2.1. U.S.
9.2.2. Canada
9.2.3. Mexico
9.3. Europe
9.3.1. Germany
9.3.2. France
9.3.3. U.K.
9.3.4. Italy
9.3.5. Spain
9.4. Asia-Pacific
9.4.1. Japan
9.4.2. China
9.4.3. India
9.5. South America
9.5.1. Brazil
9.6. Middle East and Africa
9.6.1. UAE
9.6.2. South Africa
10. Global Arak Market-Competitive Landscape
10.1. Overview
10.2. Market Share of Key Players in the Arak Market
10.2.1. Global Company Market Share
10.2.2. North America Company Market Share
10.2.3. Europe Company Market Share
10.2.4. APAC Company Market Share
10.3. Competitive Situations and Trends
10.3.1. Product Launches and Developments
10.3.2. Partnerships, Collaborations, and Agreements
10.3.3. Mergers & Acquisitions
10.3.4. Expansions
11. Company Profiles
11.1. Abi Raad Group Sarl
11.1.1. Business Overview
11.1.2. Company Snapshot
11.1.3. Company Market Share Analysis
11.1.4. Company Component Portfolio
11.1.5. Recent Developments
11.1.6. SWOT Analysis
11.2. Chateau Ksara
11.2.1. Business Overview
11.2.2. Company Snapshot
11.2.3. Company Market Share Analysis
11.2.4. Company Component Portfolio
11.2.5. Recent Developments
11.2.6. SWOT Analysis
11.3. Domaine des Tourelles
11.3.1. Business Overview
11.3.2. Company Snapshot
11.3.3. Company Market Share Analysis
11.3.4. Company Component Portfolio
11.3.5. Recent Developments
11.3.6. SWOT Analysis
11.4. Eagle Distilleries Co.
11.4.1. Business Overview
11.4.2. Company Snapshot
11.4.3. Company Market Share Analysis
11.4.4. Company Component Portfolio
11.4.5. Recent Developments
11.4.6. SWOT Analysis
11.5. Haddad Distilleries
11.5.1. Business Overview
11.5.2. Company Snapshot
11.5.3. Company Market Share Analysis
11.5.4. Company Component Portfolio
11.5.5. Recent Developments
11.5.6. SWOT Analysis
11.6. Kawar Arak
11.6.1. Business Overview
11.6.2. Company Snapshot
11.6.3. Company Market Share Analysis
11.6.4. Company Component Portfolio
11.6.5. Recent Developments
11.6.6. SWOT Analysis
11.7. Lebanese Arak Corporation
11.7.1. Business Overview
11.7.2. Company Snapshot
11.7.3. Company Market Share Analysis
11.7.4. Company Component Portfolio
11.7.5. Recent Developments
11.7.6. SWOT Analysis
11.8. Lebanese Fine Wines
11.8.1. Business Overview
11.8.2. Company Snapshot
11.8.3. Company Market Share Analysis
11.8.4. Company Component Portfolio
11.8.5. Recent Developments
11.8.6. SWOT Analysis
11.9. LibanonWeine
11.9.1. Business Overview
11.9.2. Company Snapshot
11.9.3. Company Market Share Analysis
11.9.4. Company Component Portfolio
11.9.5. Recent Developments
11.9.6. SWOT Analysis
11.10. Zumot Distilleries
11.10.1. Business Overview
11.10.2. Company Snapshot
11.10.3. Company Market Share Analysis
11.10.4. Company Component Portfolio
11.10.5. Recent Developments
11.10.6. SWOT Analysis
List of Table
1. Global Arak Market, By Product Type, 2019-2030 (USD Billion)
2. Global Anise Seeds Arak Market, By Region, 2019-2030 (USD Billion)
3. Global Merwah Grapes Arak Market, By Region, 2019-2030 (USD Billion)
4. Global Others Arak Market, By Region, 2019-2030 (USD Billion)
5. Global Arak Market, By Application, 2019-2030 (USD Billion)
6. Global Residential Arak Market, By Region, 2019-2030 (USD Billion)
7. Global Commercial Arak Market, By Region, 2019-2030 (USD Billion)
8. Global Arak Market, By Distribution Channel, 2019-2030 (USD Billion)
9. Global Liquor Shops Arak Market, By Region, 2019-2030 (USD Billion)
10. Global Bars & Pubs Arak Market, By Region, 2019-2030 (USD Billion)
11. Global Travel Retail Arak Market, By Region, 2019-2030 (USD Billion)
12. Global Others Arak Market, By Region, 2019-2030 (USD Billion)
13. Global Arak Market, By Region, 2019-2030 (USD Billion)
14. North America Arak Market, By Product Type, 2019-2030 (USD Billion)
15. North America Arak Market, By Application, 2019-2030 (USD Billion)
16. North America Arak Market, By Distribution Channel, 2019-2030 (USD Billion)
17. U.S. Arak Market, By Product Type, 2019-2030 (USD Billion)
18. U.S. Arak Market, By Application, 2019-2030 (USD Billion)
19. U.S. Arak Market, By Distribution Channel, 2019-2030 (USD Billion)
20. Canada Arak Market, By Product Type, 2019-2030 (USD Billion)
21. Canada Arak Market, By Application, 2019-2030 (USD Billion)
22. Canada Arak Market, By Distribution Channel, 2019-2030 (USD Billion)
23. Mexico Arak Market, By Product Type, 2019-2030 (USD Billion)
24. Mexico Arak Market, By Application, 2019-2030 (USD Billion)
25. Mexico Arak Market, By Distribution Channel, 2019-2030 (USD Billion)
26. Europe Arak Market, By Product Type, 2019-2030 (USD Billion)
27. Europe Arak Market, By Application, 2019-2030 (USD Billion)
28. Europe Arak Market, By Distribution Channel, 2019-2030 (USD Billion)
29. Germany Arak Market, By Product Type, 2019-2030 (USD Billion)
30. Germany Arak Market, By Application, 2019-2030 (USD Billion)
31. Germany Arak Market, By Distribution Channel, 2019-2030 (USD Billion)
32. France Arak Market, By Product Type, 2019-2030 (USD Billion)
33. France Arak Market, By Application, 2019-2030 (USD Billion)
34. France Arak Market, By Distribution Channel, 2019-2030 (USD Billion)
35. U.K. Arak Market, By Product Type, 2019-2030 (USD Billion)
36. U.K. Arak Market, By Application, 2019-2030 (USD Billion)
37. U.K. Arak Market, By Distribution Channel, 2019-2030 (USD Billion)
38. Italy Arak Market, By Product Type, 2019-2030 (USD Billion)
39. Italy Arak Market, By Application, 2019-2030 (USD Billion)
40. Italy Arak Market, By Distribution Channel, 2019-2030 (USD Billion)
41. Spain Arak Market, By Product Type, 2019-2030 (USD Billion)
42. Spain Arak Market, By Application, 2019-2030 (USD Billion)
43. Spain Arak Market, By Distribution Channel, 2019-2030 (USD Billion)
44. Asia Pacific Arak Market, By Product Type, 2019-2030 (USD Billion)
45. Asia Pacific Arak Market, By Application, 2019-2030 (USD Billion)
46. Asia Pacific Arak Market, By Distribution Channel, 2019-2030 (USD Billion)
47. Japan Arak Market, By Product Type, 2019-2030 (USD Billion)
48. Japan Arak Market, By Application, 2019-2030 (USD Billion)
49. Japan Arak Market, By Distribution Channel, 2019-2030 (USD Billion)
50. China Arak Market, By Product Type, 2019-2030 (USD Billion)
51. China Arak Market, By Application, 2019-2030 (USD Billion)
52. China Arak Market, By Distribution Channel, 2019-2030 (USD Billion)
53. India Arak Market, By Product Type, 2019-2030 (USD Billion)
54. India Arak Market, By Application, 2019-2030 (USD Billion)
55. India Arak Market, By Distribution Channel, 2019-2030 (USD Billion)
56. South America Arak Market, By Product Type, 2019-2030 (USD Billion)
57. South America Arak Market, By Application, 2019-2030 (USD Billion)
58. South America Arak Market, By Distribution Channel, 2019-2030 (USD Billion)
59. Brazil Arak Market, By Product Type, 2019-2030 (USD Billion)
60. Brazil Arak Market, By Application, 2019-2030 (USD Billion)
61. Brazil Arak Market, By Distribution Channel, 2019-2030 (USD Billion)
62. Middle East and Africa Arak Market, By Product Type, 2019-2030 (USD Billion)
63. Middle East and Africa Arak Market, By Application, 2019-2030 (USD Billion)
64. Middle East and Africa Arak Market, By Distribution Channel, 2019-2030 (USD Billion)
65. UAE Arak Market, By Product Type, 2019-2030 (USD Billion)
66. UAE Arak Market, By Application, 2019-2030 (USD Billion)
67. UAE Arak Market, By Distribution Channel, 2019-2030 (USD Billion)
68. South Africa Arak Market, By Product Type, 2019-2030 (USD Billion)
69. South Africa Arak Market, By Application, 2019-2030 (USD Billion)
70. South Africa Arak Market, By Distribution Channel, 2019-2030 (USD Billion)
List of Figures
1. Global Arak Market Segmentation
2. Arak Market: Research Methodology
3. Market Size Estimation Methodology: Bottom-Up Approach
4. Market Size Estimation Methodology: Top-Down Approach
5. Data Triangulation
6. Porter’s Five Forces Analysis
7. Value Chain Analysis
8. Global Arak Market Attractiveness Analysis By Product Type
9. Global Arak Market Attractiveness Analysis By Application
10. Global Arak Market Attractiveness Analysis By Distribution Channel
11. Global Arak Market Attractiveness Analysis By Region
12. Global Arak Market: Dynamics
13. Global Arak Market Share by Product Type (2022 & 2030)
14. Global Arak Market Share by Application (2022 & 2030)
15. Global Arak Market Share by Distribution Channel (2022 & 2030)
16. Global Arak Market Share by Regions (2022 & 2030)
17. Global Arak Market Share by Company (2021)
This study forecasts revenue at global, regional, and country levels from 2022 to 2030. The Brainy Insights has segmented the global arak market based on below mentioned segments:
Global Arak Market by Product Type:
Global Arak Market by Application:
Global Arak Market by Distribution Channel:
Global Arak Market by Region:
Research has its special purpose to undertake marketing efficiently. In this competitive scenario, businesses need information across all industry verticals; the information about customer wants, market demand, competition, industry trends, distribution channels etc. This information needs to be updated regularly because businesses operate in a dynamic environment. Our organization, The Brainy Insights incorporates scientific and systematic research procedures in order to get proper market insights and industry analysis for overall business success. The analysis consists of studying the market from a miniscule level wherein we implement statistical tools which helps us in examining the data with accuracy and precision.
Our research reports feature both; quantitative and qualitative aspects for any market. Qualitative information for any market research process are fundamental because they reveal the customer needs and wants, usage and consumption for any product/service related to a specific industry. This in turn aids the marketers/investors in knowing certain perceptions of the customers. Qualitative research can enlighten about the different product concepts and designs along with unique service offering that in turn, helps define marketing problems and generate opportunities. On the other hand, quantitative research engages with the data collection process through interviews, e-mail interactions, surveys and pilot studies. Quantitative aspects for the market research are useful to validate the hypotheses generated during qualitative research method, explore empirical patterns in the data with the help of statistical tools, and finally make the market estimations.
The Brainy Insights offers comprehensive research and analysis, based on a wide assortment of factual insights gained through interviews with CXOs and global experts and secondary data from reliable sources. Our analysts and industry specialist assume vital roles in building up statistical tools and analysis models, which are used to analyse the data and arrive at accurate insights with exceedingly informative research discoveries. The data provided by our organization have proven precious to a diverse range of companies, facilitating them to address issues such as determining which products/services are the most appealing, whether or not customers use the product in the manner anticipated, the purchasing intentions of the market and many others.
Our research methodology encompasses an idyllic combination of primary and secondary initiatives. Key phases involved in this process are listed below:

The phase involves the gathering and collecting of market data and its related information with the help of different sources & research procedures.

The data procurement stage involves in data gathering and collecting through various data sources.
This stage involves in extensive research. These data sources includes:
Purchased Database: Purchased databases play a crucial role in estimating the market sizes irrespective of the domain. Our purchased database includes:
Primary Research: The Brainy Insights interacts with leading companies and experts of the concerned domain to develop the analyst team’s market understanding and expertise. It improves and substantiates every single data presented in the market reports. Primary research mainly involves in telephonic interviews, E-mail interactions and face-to-face interviews with the raw material providers, manufacturers/producers, distributors, & independent consultants. The interviews that we conduct provides valuable data on market size and industry growth trends prevailing in the market. Our organization also conducts surveys with the various industry experts in order to gain overall insights of the industry/market. For instance, in healthcare industry we conduct surveys with the pharmacists, doctors, surgeons and nurses in order to gain insights and key information of a medical product/device/equipment which the customers are going to usage. Surveys are conducted in the form of questionnaire designed by our own analyst team. Surveys plays an important role in primary research because surveys helps us to identify the key target audiences of the market. Additionally, surveys helps to identify the key target audience engaged with the market. Our survey team conducts the survey by targeting the key audience, thus gaining insights from them. Based on the perspectives of the customers, this information is utilized to formulate market strategies. Moreover, market surveys helps us to understand the current competitive situation of the industry. To be precise, our survey process typically involve with the 360 analysis of the market. This analytical process begins by identifying the prospective customers for a product or service related to the market/industry to obtain data on how a product/service could fit into customers’ lives.

Secondary Research: The secondary data sources includes information published by the on-profit organizations such as World bank, WHO, company fillings, investor presentations, annual reports, national government documents, statistical databases, blogs, articles, white papers and others. From the annual report, we analyse a company’s revenue to understand the key segment and market share of that organization in a particular region. We analyse the company websites and adopt the product mapping technique which is important for deriving the segment revenue. In the product mapping method, we select and categorize the products offered by the companies catering to domain specific market, deduce the product revenue for each of the companies so as to get overall estimation of the market size. We also source data and analyses trends based on information received from supply side and demand side intermediaries in the value chain. The supply side denotes the data gathered from supplier, distributor, wholesaler and the demand side illustrates the data gathered from the end customers for respective market domain.

The supply side for a domain specific market is analysed by:
The demand side for the market is estimated through:
In-house Library: Apart from these third-party sources, we have our in-house library of qualitative and quantitative information. Our in-house database includes market data for various industry and domains. These data are updated on regular basis as per the changing market scenario. Our library includes, historic databases, internal audit reports and archives.
Sometimes there are instances where there is no metadata or raw data available for any domain specific market. For those cases, we use our expertise to forecast and estimate the market size in order to generate comprehensive data sets. Our analyst team adopt a robust research technique in order to produce the estimates:
Data Synthesis: This stage involves the analysis & mapping of all the information obtained from the previous step. It also involves in scrutinizing the data for any discrepancy observed while data gathering related to the market. The data is collected with consideration to the heterogeneity of sources. Robust scientific techniques are in place for synthesizing disparate data sets and provide the essential contextual information that can orient market strategies. The Brainy Insights has extensive experience in data synthesis where the data passes through various stages:


Market Deduction & Formulation: The final stage comprises of assigning data points at appropriate market spaces so as to deduce feasible conclusions. Analyst perspective & subject matter expert based holistic form of market sizing coupled with industry analysis also plays a crucial role in this stage.
This stage involves in finalization of the market size and numbers that we have collected from data integration step. With data interpolation, it is made sure that there is no gap in the market data. Successful trend analysis is done by our analysts using extrapolation techniques, which provide the best possible forecasts for the market.
Data Validation & Market Feedback: Validation is the most important step in the process. Validation & re-validation via an intricately designed process helps us finalize data-points to be used for final calculations.

The Brainy Insights interacts with leading companies and experts of the concerned domain to develop the analyst team’s market understanding and expertise. It improves and substantiates every single data presented in the market reports. The data validation interview and discussion panels are typically composed of the most experienced industry members. The participants include, however, are not limited to:
Moreover, we always validate our data and findings through primary respondents from all the major regions we are working on.


Free Customization
Fortune 500 Clients
Free Yearly Update On Purchase Of Multi/Corporate License
Companies Served Till Date