- +1-315-215-1633
- sales@thebrainyinsights.com

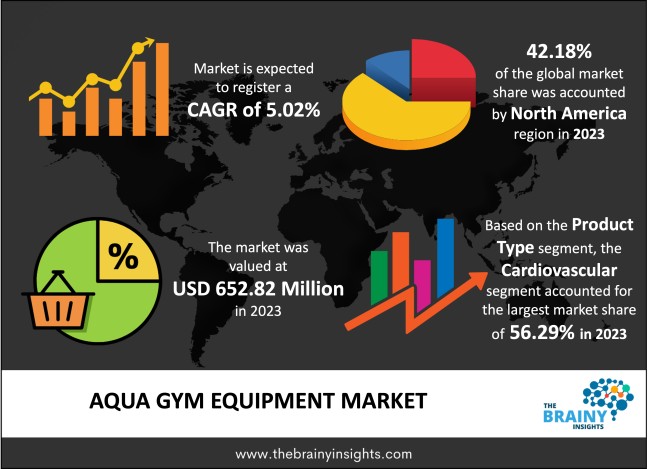
The global Aqua Gym Equipment market generated USD 652.82 Million revenue in 2023 and is projected to grow at a CAGR of 5.02% from 2024 to 2033. The market is expected to reach USD 1065.40 Million by 2033. A significant surge in consumer consciousness regarding healthy living has notably impacted the aqua gym equipment sector. Additionally, the market is propelled by various health advantages linked to aqua gym activities, including enhanced cardiovascular endurance, muscle strength, flexibility, and more.
Aqua gym equipment encompasses diverse specialized fitness gear designed for aquatic exercise routines. This equipment is tailored to provide effective workouts in water environments, offering a unique blend of resistance and buoyancy to enhance physical fitness. These tools cater to various exercise needs and skill levels, from buoyant dumbbells and resistance bands to aqua jogging belts and underwater treadmills. Aqua gym equipment is renowned for providing low-impact workouts that reduce joint strain while delivering a comprehensive cardiovascular and strength-training regimen. Additionally, many pieces of aqua gym equipment are designed for versatility, allowing users to target specific muscle groups or engage in full-body workouts. As consumer interest in aquatic fitness continues to grow, innovations in aqua gym equipment aim to further enhance effectiveness, comfort, and safety during water-based exercise sessions.
Get an overview of this study by requesting a free sample
Increasing Awareness About Fitness - With rising health consciousness among individuals, there's a growing awareness about the importance of regular exercise. Aqua gym equipment offers a unique and enjoyable way to stay fit, attracting more people to water-based workouts.
Growing Popularity of Aqua Workouts - Aqua workouts, such as water aerobics, aqua cycling, and aqua yoga, have gained a reputation due to their low-impact nature and effectiveness in improving cardiovascular health, strength, and flexibility. This trend fuels the demand for specialized aqua gym equipment for these activities.
Rising Demand for Rehabilitation and Therapy - Aqua therapy is widely acknowledged for its therapeutic advantages in rehabilitation programs for various conditions, including joint injuries, arthritis, and muscle rehabilitation. As the demand for rehabilitation and therapy services grows, so does the need for aqua gym equipment tailored for these purposes.
High Initial Investment - Aqua gym equipment often requires a significant initial investment, especially for commercial-grade products in fitness centers, rehabilitation facilities, and aquatic therapy clinics. This high upfront cost can deter potential buyers, particularly individuals or SMEs with limited budgets.
Limited Awareness and Accessibility - Despite the growing popularity of aqua workouts, certain demographics may still be limitedly aware of the benefits of water-based exercise and the availability of specialized aqua gym equipment. Additionally, accessibility to aqua fitness facilities and equipment may be limited in certain regions, particularly in areas with fewer aquatic centers or retail outlets offering such products.
Product Innovation and Differentiation - Continuous innovation in aqua gym equipment design, materials, and features presents opportunities for manufacturers to differentiate their offerings and stay competitive. Incorporating smart technology, customizable resistance levels, ergonomic designs, and eco-friendly materials can enhance product performance and appeal to discerning consumers.
Digital Integration and Virtual Training - Integrating aqua gym equipment with digital fitness platforms, mobile apps, and virtual training programs can enhance user engagement and accessibility. Offering virtual aqua fitness classes, online tutorials, and interactive training sessions can extend the reach of aqua workouts beyond physical fitness centers and appeal to tech-savvy consumers.
Perception of Aqua Fitness - Aqua Fitness may still need help with stigma or misconceptions among certain demographic groups, who may perceive it as less intense or effective than land-based exercise. Overcoming these misconceptions and positioning aqua fitness as a viable and inclusive workout option requires targeted marketing and educational campaigns.
Space Constraints and Facility Limitations - Aqua gym equipment, such as pool-based resistance machines and inflatable water exercise gear, often requires ample space for installation and use. In densely populated urban areas, space constraints in aquatic facilities, residential pools, or community centers may limit aqua fitness programs and equipment adoption.
The regions analyzed for the market include North America, Europe, South America, Asia Pacific, the Middle East, and Africa. North America emerged as the most prominent global Aqua Gym Equipment market, with a 42.18% market revenue share in 2023.
North America has a strong culture and history of fitness and wellness, with a significant portion of the population prioritizing regular exercise and healthy lifestyles. This fitness consciousness creates a favourable environment for adopting various workout modalities, including aqua fitness, driving demand for specialized equipment. Furthermore, the fitness industry in North America is well-developed, with a wide network of fitness centers, gyms, and aquatic facilities offering a diverse range of exercise programs and equipment. The presence of established fitness chains and aquatic leisure facilities provides ample opportunities for aqua gym equipment manufacturers to penetrate the market. Additionally, North America has many aquatic facilities, including public pools, community centers, aquatic therapy clinics, and resort spas, equipped with pools suitable for aqua fitness activities. The availability of well-maintained aquatic infrastructure creates a conducive environment for aqua gym equipment usage and market growth. Moreover, many leading aqua gym equipment manufacturers are based in North America, leveraging advanced technologies, innovative designs, and research-driven product development to meet evolving consumer demands. This focus on innovation drives product differentiation and enhances the competitiveness of North American aqua gym equipment in the global market. Besides, the prevalence of lifestyle-related health issues, such as obesity, cardiovascular diseases, and joint problems, in North America has heightened awareness about the importance of regular exercise and preventive healthcare measures. With its low-impact nature and therapeutic benefits, Aqua Fitness appeals to individuals seeking effective yet gentle workout options.
North America Region Aqua Gym Equipment Market Share in 2023 - 42.18%
www.thebrainyinsights.com
Check the geographical analysis of this market by requesting a free sample
The product type segment is divided into cardiovascular, strength training and others. The cardiovascular segment dominated the market, with a share of around 56.29% in 2023. Cardiovascular exercise is of utmost importance for overall fitness and heart health. Aqua gym equipment designed for cardiovascular workouts, such as aquatic treadmills, stationary bikes, and elliptical trainers, offer effective ways to improve cardiovascular endurance, burn calories, and strengthen the heart muscle. In addition, water-based cardiovascular exercise provides a low-impact alternative to traditional land-based workouts. The buoyancy of water reduces stress on muscles, joints, and connective tissues, making it suitable for individuals with arthritis, joint pain, or mobility limitations. Aqua gym equipment allows users to engage in vigorous cardiovascular activity with reduced risk of injury or discomfort. Besides, cardiovascular aqua gym equipment comes in various forms and configurations, catering to diverse fitness levels, preferences, and workout goals. Users can choose equipment that aligns with their cardiovascular fitness needs and preferences, from aquatic bikes and rowing machines to underwater treadmills and resistance trainers.
The consumer group segment is classified into men and women. The men segment dominated the market, with a share of around 72.39% in 2023. Historically, men are more likely to engage in fitness activities and sports than women. This inclination towards physical activity extends to aqua fitness, where men may be more likely to explore and adopt new workout modalities, including those involving aqua gym equipment. Furthermore, aqua fitness, particularly when utilizing specialized equipment, is often perceived as offering intensive workouts suitable for individuals seeking high-intensity exercise and muscle development. This perception aligns with traditional notions of fitness that may appeal more to men, driving their interest in aqua gym equipment. Moreover, some aqua gym equipment, such as resistance-based machines and aquatic weights, cater to individuals looking to build strength, muscle mass, and power. Men, who may prioritize these fitness goals, are more likely to gravitate towards equipment that supports strength-based workouts, contributing to their dominance in the market.
The distribution channel segment includes supermarkets & hypermarkets, specialty store, online and others. The supermarkets & hypermarkets segment dominated the market, with a share of around 39.71% in 2023. Supermarkets and hypermarkets are widely accessible and available to shoppers, with numerous locations in Rural, urban, and suburban areas. Their suitable locations and extended operating hours make it effortless for consumers to browse and purchase aqua gym equipment during regular shopping trips for groceries and household items. Most importantly, supermarkets and hypermarkets typically offer diverse products, including aqua gym equipment, catering to a broad customer base with varying preferences and budgets. Shoppers can find various equipment options, from basic water dumbbells and resistance bands to more advanced aquatic treadmills and stationary bikes, all under one roof. In addition, supermarkets and hypermarkets leverage economies of scale and bulk purchasing power to offer competitive pricing on aqua gym equipment. Consumers can benefit from discounted prices, promotional offers, and bundled deals, making purchasing equipment alongside other household essentials cost-effective.
| Attribute | Description |
|---|---|
| Market Size | Revenue (USD Million) |
| Market size value in 2023 | USD 652.82 Million |
| Market size value in 2033 | USD 1065.40 Million |
| CAGR (2024 to 2033) | 5.02% |
| Historical data | 2020-2022 |
| Base Year | 2023 |
| Forecast | 2024-2033 |
| Region | The regions analyzed for the market are Asia Pacific, Europe, South America, North America, and Middle East & Africa. Furthermore, the regions are further analyzed at the country level. |
| Segments | Product Type, Consumer Group, and Distribution Channel |
As per The Brainy Insights, the size of the aqua gym equipment market was valued at USD 652.82 million in 2023 to USD 1065.40 million by 2033.
The global aqua gym equipment market is growing at a CAGR of 5.02% during the forecast period 2024-2033.
North America became the largest market for aqua gym equipment.
Increasing awareness about fitness and rising demand for rehabilitation and therapy drive the market's growth.
1. Introduction
1.1. Objectives of the Study
1.2. Market Definition
1.3. Research Scope
1.4. Currency
1.5. Key Target Audience
2. Research Methodology and Assumptions
3. Executive Summary
4. Premium Insights
4.1. Porter’s Five Forces Analysis
4.2. Value Chain Analysis
4.3. Top Investment Pockets
4.3.1. Market Attractiveness Analysis By Product Type
4.3.2. Market Attractiveness Analysis By Consumer Group
4.3.3. Market Attractiveness Analysis By Distribution Channel
4.3.4. Market Attractiveness Analysis By Region
4.4. Industry Trends
5. Market Dynamics
5.1. Market Evaluation
5.2. Drivers
5.2.1. Increasing Awareness About Fitness
5.2.2. Rising Demand for Rehabilitation and Therapy
5.3. Restraints
5.3.1. High Initial Investment
5.4. Opportunities
5.4.1. Product Innovation and Differentiation
5.5. Challenges
5.5.1. Perception of Aqua Fitness
6. Global Aqua Gym Equipment Market Analysis and Forecast, By Product Type
6.1. Segment Overview
6.2. Cardiovascular
6.3. Strength Training
6.4. Others
7. Global Aqua Gym Equipment Market Analysis and Forecast, By Consumer Group
7.1. Segment Overview
7.2. Men
7.3. Women
8. Global Aqua Gym Equipment Market Analysis and Forecast, By Distribution Channel
8.1. Segment Overview
8.2. Supermarkets & Hypermarkets
8.3. Specialty Store
8.4. Online
8.5. Others
9. Global Aqua Gym Equipment Market Analysis and Forecast, By Regional Analysis
9.1. Segment Overview
9.2. North America
9.2.1. U.S.
9.2.2. Canada
9.2.3. Mexico
9.3. Europe
9.3.1. Germany
9.3.2. France
9.3.3. U.K.
9.3.4. Italy
9.3.5. Spain
9.4. Asia-Pacific
9.4.1. Japan
9.4.2. China
9.4.3. India
9.5. South America
9.5.1. Brazil
9.6. Middle East and Africa
9.6.1. UAE
9.6.2. South Africa
10. Global Aqua Gym Equipment Market-Competitive Landscape
10.1. Overview
10.2. Market Share of Key Players in the Aqua Gym Equipment Market
10.2.1. Global Company Market Share
10.2.2. North America Company Market Share
10.2.3. Europe Company Market Share
10.2.4. APAC Company Market Share
10.3. Competitive Situations and Trends
10.3.1. Product Launches and Developments
10.3.2. Partnerships, Collaborations, and Agreements
10.3.3. Mergers & Acquisitions
10.3.4. Expansions
11. Company Profiles
11.1. Aqua Lung International
11.1.1. Business Overview
11.1.2. Company Snapshot
11.1.3. Company Market Share Analysis
11.1.4. Company Product Portfolio
11.1.5. Recent Developments
11.1.6. SWOT Analysis
11.2. Aqua Fitness
11.2.1. Business Overview
11.2.2. Company Snapshot
11.2.3. Company Market Share Analysis
11.2.4. Company Product Portfolio
11.2.5. Recent Developments
11.2.6. SWOT Analysis
11.3. Aquajogger
11.3.1. Business Overview
11.3.2. Company Snapshot
11.3.3. Company Market Share Analysis
11.3.4. Company Product Portfolio
11.3.5. Recent Developments
11.3.6. SWOT Analysis
11.4. Acquapole
11.4.1. Business Overview
11.4.2. Company Snapshot
11.4.3. Company Market Share Analysis
11.4.4. Company Product Portfolio
11.4.5. Recent Developments
11.4.6. SWOT Analysis
11.5. BECO Beermann
11.5.1. Business Overview
11.5.2. Company Snapshot
11.5.3. Company Market Share Analysis
11.5.4. Company Product Portfolio
11.5.5. Recent Developments
11.5.6. SWOT Analysis
11.6. Black Lagoon Products
11.6.1. Business Overview
11.6.2. Company Snapshot
11.6.3. Company Market Share Analysis
11.6.4. Company Product Portfolio
11.6.5. Recent Developments
11.6.6. SWOT Analysis
11.7. Cosco
11.7.1. Business Overview
11.7.2. Company Snapshot
11.7.3. Company Market Share Analysis
11.7.4. Company Product Portfolio
11.7.5. Recent Developments
11.7.6. SWOT Analysis
11.8. Finis
11.8.1. Business Overview
11.8.2. Company Snapshot
11.8.3. Company Market Share Analysis
11.8.4. Company Product Portfolio
11.8.5. Recent Developments
11.8.6. SWOT Analysis
11.9. Fluid Running
11.9.1. Business Overview
11.9.2. Company Snapshot
11.9.3. Company Market Share Analysis
11.9.4. Company Product Portfolio
11.9.5. Recent Developments
11.9.6. SWOT Analysis
11.10. HydroWorx
11.10.1. Business Overview
11.10.2. Company Snapshot
11.10.3. Company Market Share Analysis
11.10.4. Company Product Portfolio
11.10.5. Recent Developments
11.10.6. SWOT Analysis
11.11. Hydro Fit
11.11.1. Business Overview
11.11.2. Company Snapshot
11.11.3. Company Market Share Analysis
11.11.4. Company Product Portfolio
11.11.5. Recent Developments
11.11.6. SWOT Analysis
11.12. N FOX
11.12.1. Business Overview
11.12.2. Company Snapshot
11.12.3. Company Market Share Analysis
11.12.4. Company Product Portfolio
11.12.5. Recent Developments
11.12.6. SWOT Analysis
11.13. PlayCore, Inc.
11.13.1. Business Overview
11.13.2. Company Snapshot
11.13.3. Company Market Share Analysis
11.13.4. Company Product Portfolio
11.13.5. Recent Developments
11.13.6. SWOT Analysis
11.14. Speedo International
11.14.1. Business Overview
11.14.2. Company Snapshot
11.14.3. Company Market Share Analysis
11.14.4. Company Product Portfolio
11.14.5. Recent Developments
11.14.6. SWOT Analysis
11.15. Sprint Aquatics
11.15.1. Business Overview
11.15.2. Company Snapshot
11.15.3. Company Market Share Analysis
11.15.4. Company Product Portfolio
11.15.5. Recent Developments
11.15.6. SWOT Analysis
11.16. Syndicate Gym Equipment
11.16.1. Business Overview
11.16.2. Company Snapshot
11.16.3. Company Market Share Analysis
11.16.4. Company Product Portfolio
11.16.5. Recent Developments
11.16.6. SWOT Analysis
11.17. Theraquatics
11.17.1. Business Overview
11.17.2. Company Snapshot
11.17.3. Company Market Share Analysis
11.17.4. Company Product Portfolio
11.17.5. Recent Developments
11.17.6. SWOT Analysis
11.18. Texas Rec
11.18.1. Business Overview
11.18.2. Company Snapshot
11.18.3. Company Market Share Analysis
11.18.4. Company Product Portfolio
11.18.5. Recent Developments
11.18.6. SWOT Analysis
11.19. WaterGym
11.19.1. Business Overview
11.19.2. Company Snapshot
11.19.3. Company Market Share Analysis
11.19.4. Company Product Portfolio
11.19.5. Recent Developments
11.19.6. SWOT Analysis
List of Table
1. Global Aqua Gym Equipment Market, By Product Type, 2020-2033 (USD Million) (Units)
2. Global Cardiovascular, Aqua Gym Equipment Market, By Region, 2020-2033 (USD Million) (Units)
3. Global Strength Training, Aqua Gym Equipment Market, By Region, 2020-2033 (USD Million) (Units)
4. Global Others, Aqua Gym Equipment Market, By Region, 2020-2033 (USD Million) (Units)
5. Global Aqua Gym Equipment Market, By Consumer Group, 2020-2033 (USD Million) (Units)
6. Global Men, Aqua Gym Equipment Market, By Region, 2020-2033 (USD Million) (Units)
7. Global Women, Aqua Gym Equipment Market, By Region, 2020-2033 (USD Million) (Units)
8. Global Aqua Gym Equipment Market, By Distribution Channel, 2020-2033 (USD Million) (Units)
9. Global Supermarkets & Hypermarkets, Aqua Gym Equipment Market, By Region, 2020-2033 (USD Million) (Units)
10. Global Specialty Store, Aqua Gym Equipment Market, By Region, 2020-2033 (USD Million) (Units)
11. Global Online, Aqua Gym Equipment Market, By Region, 2020-2033 (USD Million) (Units)
12. Global Others, Aqua Gym Equipment Market, By Region, 2020-2033 (USD Million) (Units)
13. Global Aqua Gym Equipment Market, By Region, 2020-2033 (USD Million) (Units)
14. North America Aqua Gym Equipment Market, By Product Type, 2020-2033 (USD Million) (Units)
15. North America Aqua Gym Equipment Market, By Consumer Group, 2020-2033 (USD Million) (Units)
16. North America Aqua Gym Equipment Market, By Distribution Channel, 2020-2033 (USD Million) (Units)
17. U.S. Aqua Gym Equipment Market, By Product Type, 2020-2033 (USD Million) (Units)
18. U.S. Aqua Gym Equipment Market, By Consumer Group, 2020-2033 (USD Million) (Units)
19. U.S. Aqua Gym Equipment Market, By Distribution Channel, 2020-2033 (USD Million) (Units)
20. Canada Aqua Gym Equipment Market, By Product Type, 2020-2033 (USD Million) (Units)
21. Canada Aqua Gym Equipment Market, By Consumer Group, 2020-2033 (USD Million) (Units)
22. Canada Aqua Gym Equipment Market, By Distribution Channel, 2020-2033 (USD Million) (Units)
23. Mexico Aqua Gym Equipment Market, By Product Type, 2020-2033 (USD Million) (Units)
24. Mexico Aqua Gym Equipment Market, By Consumer Group, 2020-2033 (USD Million) (Units)
25. Mexico Aqua Gym Equipment Market, By Distribution Channel, 2020-2033 (USD Million) (Units)
26. Europe Aqua Gym Equipment Market, By Product Type, 2020-2033 (USD Million) (Units)
27. Europe Aqua Gym Equipment Market, By Consumer Group, 2020-2033 (USD Million) (Units)
28. Europe Aqua Gym Equipment Market, By Distribution Channel, 2020-2033 (USD Million) (Units)
29. Germany Aqua Gym Equipment Market, By Product Type, 2020-2033 (USD Million) (Units)
30. Germany Aqua Gym Equipment Market, By Consumer Group, 2020-2033 (USD Million) (Units)
31. Germany Aqua Gym Equipment Market, By Distribution Channel, 2020-2033 (USD Million) (Units)
32. France Aqua Gym Equipment Market, By Product Type, 2020-2033 (USD Million) (Units)
33. France Aqua Gym Equipment Market, By Consumer Group, 2020-2033 (USD Million) (Units)
34. France Aqua Gym Equipment Market, By Distribution Channel, 2020-2033 (USD Million) (Units)
35. U.K. Aqua Gym Equipment Market, By Product Type, 2020-2033 (USD Million) (Units)
36. U.K. Aqua Gym Equipment Market, By Consumer Group, 2020-2033 (USD Million) (Units)
37. U.K. Aqua Gym Equipment Market, By Distribution Channel, 2020-2033 (USD Million) (Units)
38. Italy Aqua Gym Equipment Market, By Product Type, 2020-2033 (USD Million) (Units)
39. Italy Aqua Gym Equipment Market, By Consumer Group, 2020-2033 (USD Million) (Units)
40. Italy Aqua Gym Equipment Market, By Distribution Channel, 2020-2033 (USD Million) (Units)
41. Spain Aqua Gym Equipment Market, By Product Type, 2020-2033 (USD Million) (Units)
42. Spain Aqua Gym Equipment Market, By Consumer Group, 2020-2033 (USD Million) (Units)
43. Spain Aqua Gym Equipment Market, By Distribution Channel, 2020-2033 (USD Million) (Units)
44. Asia Pacific Aqua Gym Equipment Market, By Product Type, 2020-2033 (USD Million) (Units)
45. Asia Pacific Aqua Gym Equipment Market, By Consumer Group, 2020-2033 (USD Million) (Units)
46. Asia Pacific Aqua Gym Equipment Market, By Distribution Channel, 2020-2033 (USD Million) (Units)
47. Japan Aqua Gym Equipment Market, By Product Type, 2020-2033 (USD Million) (Units)
48. Japan Aqua Gym Equipment Market, By Consumer Group, 2020-2033 (USD Million) (Units)
49. Japan Aqua Gym Equipment Market, By Distribution Channel, 2020-2033 (USD Million) (Units)
50. China Aqua Gym Equipment Market, By Product Type, 2020-2033 (USD Million) (Units)
51. China Aqua Gym Equipment Market, By Consumer Group, 2020-2033 (USD Million) (Units)
52. China Aqua Gym Equipment Market, By Distribution Channel, 2020-2033 (USD Million) (Units)
53. India Aqua Gym Equipment Market, By Product Type, 2020-2033 (USD Million) (Units)
54. India Aqua Gym Equipment Market, By Consumer Group, 2020-2033 (USD Million) (Units)
55. India Aqua Gym Equipment Market, By Distribution Channel, 2020-2033 (USD Million) (Units)
56. South America Aqua Gym Equipment Market, By Product Type, 2020-2033 (USD Million) (Units)
57. South America Aqua Gym Equipment Market, By Consumer Group, 2020-2033 (USD Million) (Units)
58. South America Aqua Gym Equipment Market, By Distribution Channel, 2020-2033 (USD Million) (Units)
59. Brazil Aqua Gym Equipment Market, By Product Type, 2020-2033 (USD Million) (Units)
60. Brazil Aqua Gym Equipment Market, By Consumer Group, 2020-2033 (USD Million) (Units)
61. Brazil Aqua Gym Equipment Market, By Distribution Channel, 2020-2033 (USD Million) (Units)
62. Middle East and Africa Aqua Gym Equipment Market, By Product Type, 2020-2033 (USD Million) (Units)
63. Middle East and Africa Aqua Gym Equipment Market, By Consumer Group, 2020-2033 (USD Million) (Units)
64. Middle East and Africa Aqua Gym Equipment Market, By Distribution Channel, 2020-2033 (USD Million) (Units)
65. UAE Aqua Gym Equipment Market, By Product Type, 2020-2033 (USD Million) (Units)
66. UAE Aqua Gym Equipment Market, By Consumer Group, 2020-2033 (USD Million) (Units)
67. UAE Aqua Gym Equipment Market, By Distribution Channel, 2020-2033 (USD Million) (Units)
68. South Africa Aqua Gym Equipment Market, By Product Type, 2020-2033 (USD Million) (Units)
69. South Africa Aqua Gym Equipment Market, By Consumer Group, 2020-2033 (USD Million) (Units)
70. South Africa Aqua Gym Equipment Market, By Distribution Channel, 2020-2033 (USD Million) (Units)
List of Figures
1. Global Aqua Gym Equipment Market Segmentation
2. Aqua Gym Equipment Market: Research Methodology
3. Market Size Estimation Methodology: Bottom-Up Approach
4. Market Size Estimation Methodology: Top-Down Approach
5. Data Triangulation
6. Porter’s Five Forces Analysis
7. Value Chain Analysis
8. Global Aqua Gym Equipment Market Attractiveness Analysis By Product Type
9. Global Aqua Gym Equipment Market Attractiveness Analysis By Consumer Group
10. Global Aqua Gym Equipment Market Attractiveness Analysis By Distribution Channel
11. Global Aqua Gym Equipment Market Attractiveness Analysis by Region
12. Global Aqua Gym Equipment Market: Dynamics
13. Global Aqua Gym Equipment Market Share By Product Type (2024 & 2033)
14. Global Aqua Gym Equipment Market Share By Consumer Group (2024 & 2033)
15. Global Aqua Gym Equipment Market Share By Distribution Channel (2024 & 2033)
16. Global Aqua Gym Equipment Market Share by Regions (2024 & 2033)
17. Global Aqua Gym Equipment Market Share by Company (2023)
This study forecasts revenue at global, regional, and country levels from 2020 to 2033. The Brainy Insights has segmented the global Aqua Gym Equipment market based on below-mentioned segments:
Global Aqua Gym Equipment Market by Product Type:
Global Aqua Gym Equipment Market by Consumer Group:
Global Aqua Gym Equipment Market by Distribution Channel:
Global Aqua Gym Equipment Market by Region:
Research has its special purpose to undertake marketing efficiently. In this competitive scenario, businesses need information across all industry verticals; the information about customer wants, market demand, competition, industry trends, distribution channels etc. This information needs to be updated regularly because businesses operate in a dynamic environment. Our organization, The Brainy Insights incorporates scientific and systematic research procedures in order to get proper market insights and industry analysis for overall business success. The analysis consists of studying the market from a miniscule level wherein we implement statistical tools which helps us in examining the data with accuracy and precision.
Our research reports feature both; quantitative and qualitative aspects for any market. Qualitative information for any market research process are fundamental because they reveal the customer needs and wants, usage and consumption for any product/service related to a specific industry. This in turn aids the marketers/investors in knowing certain perceptions of the customers. Qualitative research can enlighten about the different product concepts and designs along with unique service offering that in turn, helps define marketing problems and generate opportunities. On the other hand, quantitative research engages with the data collection process through interviews, e-mail interactions, surveys and pilot studies. Quantitative aspects for the market research are useful to validate the hypotheses generated during qualitative research method, explore empirical patterns in the data with the help of statistical tools, and finally make the market estimations.
The Brainy Insights offers comprehensive research and analysis, based on a wide assortment of factual insights gained through interviews with CXOs and global experts and secondary data from reliable sources. Our analysts and industry specialist assume vital roles in building up statistical tools and analysis models, which are used to analyse the data and arrive at accurate insights with exceedingly informative research discoveries. The data provided by our organization have proven precious to a diverse range of companies, facilitating them to address issues such as determining which products/services are the most appealing, whether or not customers use the product in the manner anticipated, the purchasing intentions of the market and many others.
Our research methodology encompasses an idyllic combination of primary and secondary initiatives. Key phases involved in this process are listed below:

The phase involves the gathering and collecting of market data and its related information with the help of different sources & research procedures.

The data procurement stage involves in data gathering and collecting through various data sources.
This stage involves in extensive research. These data sources includes:
Purchased Database: Purchased databases play a crucial role in estimating the market sizes irrespective of the domain. Our purchased database includes:
Primary Research: The Brainy Insights interacts with leading companies and experts of the concerned domain to develop the analyst team’s market understanding and expertise. It improves and substantiates every single data presented in the market reports. Primary research mainly involves in telephonic interviews, E-mail interactions and face-to-face interviews with the raw material providers, manufacturers/producers, distributors, & independent consultants. The interviews that we conduct provides valuable data on market size and industry growth trends prevailing in the market. Our organization also conducts surveys with the various industry experts in order to gain overall insights of the industry/market. For instance, in healthcare industry we conduct surveys with the pharmacists, doctors, surgeons and nurses in order to gain insights and key information of a medical product/device/equipment which the customers are going to usage. Surveys are conducted in the form of questionnaire designed by our own analyst team. Surveys plays an important role in primary research because surveys helps us to identify the key target audiences of the market. Additionally, surveys helps to identify the key target audience engaged with the market. Our survey team conducts the survey by targeting the key audience, thus gaining insights from them. Based on the perspectives of the customers, this information is utilized to formulate market strategies. Moreover, market surveys helps us to understand the current competitive situation of the industry. To be precise, our survey process typically involve with the 360 analysis of the market. This analytical process begins by identifying the prospective customers for a product or service related to the market/industry to obtain data on how a product/service could fit into customers’ lives.

Secondary Research: The secondary data sources includes information published by the on-profit organizations such as World bank, WHO, company fillings, investor presentations, annual reports, national government documents, statistical databases, blogs, articles, white papers and others. From the annual report, we analyse a company’s revenue to understand the key segment and market share of that organization in a particular region. We analyse the company websites and adopt the product mapping technique which is important for deriving the segment revenue. In the product mapping method, we select and categorize the products offered by the companies catering to domain specific market, deduce the product revenue for each of the companies so as to get overall estimation of the market size. We also source data and analyses trends based on information received from supply side and demand side intermediaries in the value chain. The supply side denotes the data gathered from supplier, distributor, wholesaler and the demand side illustrates the data gathered from the end customers for respective market domain.

The supply side for a domain specific market is analysed by:
The demand side for the market is estimated through:
In-house Library: Apart from these third-party sources, we have our in-house library of qualitative and quantitative information. Our in-house database includes market data for various industry and domains. These data are updated on regular basis as per the changing market scenario. Our library includes, historic databases, internal audit reports and archives.
Sometimes there are instances where there is no metadata or raw data available for any domain specific market. For those cases, we use our expertise to forecast and estimate the market size in order to generate comprehensive data sets. Our analyst team adopt a robust research technique in order to produce the estimates:
Data Synthesis: This stage involves the analysis & mapping of all the information obtained from the previous step. It also involves in scrutinizing the data for any discrepancy observed while data gathering related to the market. The data is collected with consideration to the heterogeneity of sources. Robust scientific techniques are in place for synthesizing disparate data sets and provide the essential contextual information that can orient market strategies. The Brainy Insights has extensive experience in data synthesis where the data passes through various stages:


Market Deduction & Formulation: The final stage comprises of assigning data points at appropriate market spaces so as to deduce feasible conclusions. Analyst perspective & subject matter expert based holistic form of market sizing coupled with industry analysis also plays a crucial role in this stage.
This stage involves in finalization of the market size and numbers that we have collected from data integration step. With data interpolation, it is made sure that there is no gap in the market data. Successful trend analysis is done by our analysts using extrapolation techniques, which provide the best possible forecasts for the market.
Data Validation & Market Feedback: Validation is the most important step in the process. Validation & re-validation via an intricately designed process helps us finalize data-points to be used for final calculations.

The Brainy Insights interacts with leading companies and experts of the concerned domain to develop the analyst team’s market understanding and expertise. It improves and substantiates every single data presented in the market reports. The data validation interview and discussion panels are typically composed of the most experienced industry members. The participants include, however, are not limited to:
Moreover, we always validate our data and findings through primary respondents from all the major regions we are working on.


Free Customization
Fortune 500 Clients
Free Yearly Update On Purchase Of Multi/Corporate License
Companies Served Till Date