- +1-315-215-1633
- sales@thebrainyinsights.com

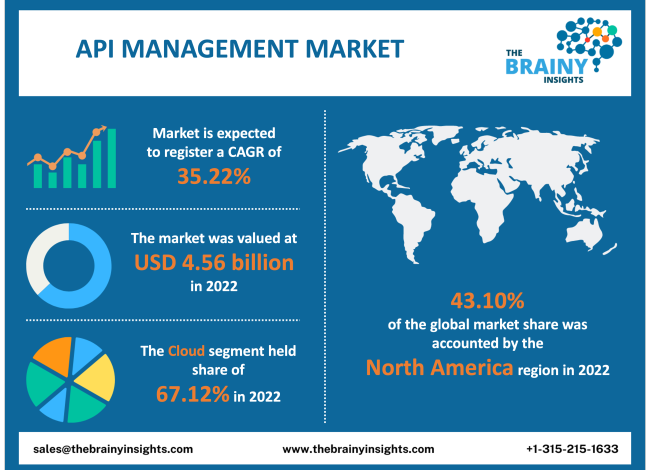
The global API management market is expected to grow from USD 4.56 Billion in 2022 to USD 93.19 Billion by 2032, at a CAGR of 35.22% during the forecast period 2023-2032. The North American region dominated the market in 2022.
API management is the cumulative process of releasing, designing, documenting, and analyzing APIs in a secure setting. A company may ensure the usability and security of both internal and external APIs by using an API management solution. There are many capabilities that API management solutions on the market can offer to customers. Developers and partners alike can create, publish, and deploy APIs using the required management tools and store documentation, security guidelines, usage caps, runtime capabilities, and other pertinent data. The API gateway, which serves as a gatekeeper for all APIs by enforcing applicable API security regulations and requests and ensuring authorization and security, is another function of API management solutions. To adapt quickly to changes in client needs, organizations are putting systems in place to manage their APIs. Most often, these businesses use a microservices architecture to accelerate software development and satisfy demand.
Get an overview of this study by requesting a free sample
Increasing use of API management across industries: A company undergoing digital transformation needs the implementation of API management. With the help of API management, enterprises can define security and access regulations and track the viability of delivering new services. API management has applications across a variety of industries, as healthcare providers use it in implementing interoperability rules, or financial organizations can utilize the software for launching the open banking program. Companies have found that better communication results from this adaptability since users may interact with one another and comment on the services. These factors have contributed to the growth of the API management market.
High cost of API management software– The high cost of installation of API management software has hindered market growth. API management software implementation has a high capital requirement. Many medium-scale and small-scale industries cannot afford API management software with all the in-house features. Apart from the high initial cost, the maintenance cost of API management software is also hindering market growth.
Rising adoption of data-centric production approach- Data-centric architecture has started to dominate the global market due to digital transformation. The corporate sector has already begun using cutting-edge technologies like artificial intelligence, big data, data science, and many others to embrace digital transformation. The implementation of API management results in greater levels of profit and customer involvement. In an era where data is at the center of every decision-making process, a data-centric organization may better align its strategy with the interests of its stakeholders by utilizing the information generated by its operations. An organization can function more effectively if the outcome is more precise, organized, and transparent. API management may make it possible to transform traditional processes into intelligent ones.
Lack of awareness - The benefits of API management are not well-known in development areas. The employment of such instruments is not well known in these regions' businesses. Furthermore, the owners are cautious about investing in breakthrough technology since they are unsure of the prospective profits. In addition, many people in developing countries are unaware of the advantages of API management in corporate and healthcare applications. This aspect limits the market's expansion in these areas even further.
The regions analyzed for the market include North America, Europe, South America, Asia Pacific, the Middle East, and Africa. The North American region emerged as the most significant global API Management market, with a revenue share of 43.10% in 2022. The region has a high market growth rate due to the increasing number of data-operating companies. The investment in API management software and services will drive the North American market. The growing utility of solutions such as big data, IoT, cloud-based software, digital transformation, etc., is propelling the growth of API management. The Asia-Pacific region is anticipated to grow lucratively during the forecast period. The market is witnessing a lucrative growth rate due to the rising adoption of API technology, such as in India and China. Further, the rise in investment in cloud solutions has positively impacted the API management market.
North America region API Management Market Share in 2022 - 43.10%
www.thebrainyinsights.com
Check the geographical analysis of this market by requesting a free sample
The deployment segment is divided into cloud and on-premises. The cloud segment dominated the market with a revenue share of 67.12% in 2022. Cloud-based API management allows the client companies to utilize the applications and services without installing them on the hardware device. Companies utilize cloud-based API management applications to improve their functionality and remote working operations.
The component segment includes services and software. The services segment further includes consulting, training and education, support and maintenance. The software segment further includes API security, API platform and API analytics. The software segment dominated the market with a revenue share of 67.10% in 2022. API management software is a solution that helps companies improve their applications' experience. The API management software also enables tracking of the organization's performance and meeting the requirement of front-end developers.
The organization size segment includes small and medium-scale organizations and large-scale organizations. The large-scale organization segment dominated the market with a revenue share of 53.86% in 2022. Large enterprises adopt API management technologies to maintain their economies of scale. Further, large-size organizations are keen on adapting new technologies to increase profitability.
The end-user segment includes retail, BFSI, telecom and IT, healthcare and life science, government and education, and others. The telecom and IT segment dominated the market with a revenue share of 31.29% in 2022. The telecommunication and IT software industry implement API management to enhance their customers' experience. The industry is investing heavily in API solutions due to the integration of several services.
| Attribute | Description |
|---|---|
| Market Size | Revenue (USD Billion) |
| Market size value in 2022 | USD 4.56 Billion |
| Market size value in 2032 | USD 93.19 Billion |
| CAGR (2023 to 2032) | 35.22% |
| Historical data | 2019-2021 |
| Base Year | 2022 |
| Forecast | 2023-2032 |
| Regional Segments | The regions examined for the market are Europe, Asia Pacific, North America, South America, and Middle East & Africa. |
| Segments | The research segment is based on deployment, component, organization size, and end-user. |
As per The Brainy Insights, the size of the API management market was valued 4.56 billion in 2022 to USD 93.19 Billion by 2032.
Global API management market is growing at a CAGR of 35.22% during the forecast period 2023-2032.
North America region emerged as the largest market for the API Management.
The market's growth will be influenced by the growing use of API management across verticals.
The high cost of API management software could hamper the market growth.
The increasing adoption of data-centric approach is providing huge opportunities to the market.
1. Introduction
1.1. Objectives of the Study
1.2. Market Definition
1.3. Research Scope
1.4. Currency
1.5. Key Target Audience
2. Research Methodology and Assumptions
3. Executive Summary
4. Premium Insights
4.1. Porter’s Five Forces Analysis
4.2. Value Chain Analysis
4.3. Top Investment Pockets
4.3.1. Market Attractiveness Analysis by Deployment
4.3.2. Market Attractiveness Analysis by Component
4.3.3. Market Attractiveness Analysis by Organization Size
4.3.4. Market Attractiveness Analysis by End-user
4.3.5. Market Attractiveness Analysis by Region
4.4. Industry Trends
5. Market Dynamics
5.1. Market Evaluation
5.2. Drivers
5.2.1. Increasing use of API management across verticals
5.3. Restraints
5.3.1. High cost of software
5.4. Opportunities
5.4.1. Adoption of data centric models
5.5. Challenges
5.5.1. Lack of awareness
6. Global API Management Market Analysis and Forecast, By Deployment
6.1. Segment Overview
6.2. Cloud
6.3. On-Premises
7. Global API Management Market Analysis and Forecast, By Component
7.1. Segment Overview
7.2. Services
7.2.1. Consulting
7.2.2. Training And Education
7.2.3. Support And Maintenance
7.3. Software
7.3.1. API Security
7.3.2. API Platform
7.3.3. API Analytics
8. Global API Management Market Analysis and Forecast, By Organization Size
8.1. Segment Overview
8.2. Small and Medium Scale Organization
8.3. Large Scale Organization
9. Global API Management Market Analysis and Forecast, By End-user
9.1. Segment Overview
9.2. Retail
9.3. BFSI
9.4. Telecom and IT
9.5. Healthcare and Life Science
9.6. Government and Education
9.7. Others
10. Global API Management Market Analysis and Forecast, By Regional Analysis
10.1. Segment Overview
10.2. North America
10.2.1. U.S.
10.2.2. Canada
10.2.3. Mexico
10.3. Europe
10.3.1. Germany
10.3.2. France
10.3.3. U.K.
10.3.4. Italy
10.3.5. Spain
10.4. Asia-Pacific
10.4.1. Japan
10.4.2. China
10.4.3. India
10.5. South America
10.5.1. Brazil
10.6. Middle East and Africa
10.6.1. UAE
10.6.2. South Africa
11. Global API Management Market-Competitive Landscape
11.1. Overview
11.2. Market Share of Key Players in the API Management Market
11.2.1. Global Company Market Share
11.2.2. North America Company Market Share
11.2.3. Europe Company Market Share
11.2.4. APAC Company Market Share
11.3. Competitive Situations and Trends
11.3.1. Product Launches and Developments
11.3.2. Partnerships, Collaborations, and Agreements
11.3.3. Mergers & Acquisitions
11.3.4. Expansions
12. Company Profiles
12.1. IBM
12.1.1. Business Overview
12.1.2. Company Snapshot
12.1.3. Company Market Share Analysis
12.1.4. Company Product Portfolio
12.1.5. Recent Developments
12.1.6. SWOT Analysis
12.2. Microsoft
12.2.1. Business Overview
12.2.2. Company Snapshot
12.2.3. Company Market Share Analysis
12.2.4. Company Product Portfolio
12.2.5. Recent Developments
12.2.6. SWOT Analysis
12.3. Google
12.3.1. Business Overview
12.3.2. Company Snapshot
12.3.3. Company Market Share Analysis
12.3.4. Company Product Portfolio
12.3.5. Recent Developments
12.3.6. SWOT Analysis
12.4. Broadcom Inc.
12.4.1. Business Overview
12.4.2. Company Snapshot
12.4.3. Company Market Share Analysis
12.4.4. Company Product Portfolio
12.4.5. Recent Developments
12.4.6. SWOT Analysis
12.5. Axway Software
12.5.1. Business Overview
12.5.2. Company Snapshot
12.5.3. Company Market Share Analysis
12.5.4. Company Product Portfolio
12.5.5. Recent Developments
12.5.6. SWOT Analysis
12.6. Oracle Corporation
12.6.1. Business Overview
12.6.2. Company Snapshot
12.6.3. Company Market Share Analysis
12.6.4. Company Product Portfolio
12.6.5. Recent Developments
12.6.6. SWOT Analysis
12.7. Kong Inc.
12.7.1. Business Overview
12.7.2. Company Snapshot
12.7.3. Company Market Share Analysis
12.7.4. Company Product Portfolio
12.7.5. Recent Developments
12.7.6. SWOT Analysis
12.8. SAP SE
1.1.1. Business Overview
1.1.2. Company Snapshot
1.1.3. Company Market Share Analysis
1.1.4. Company Product Portfolio
1.1.5. Recent Developments
1.1.6. SWOT Analysis
12.9. Amazon Web Services
12.9.1. Business Overview
12.9.2. Company Snapshot
12.9.3. Company Market Share Analysis
12.9.4. Company Product Portfolio
12.9.5. Recent Developments
12.9.6. SWOT Analysis
12.10. Nevatech Inc.
12.10.1. Business Overview
12.10.2. Company Snapshot
12.10.3. Company Market Share Analysis
12.10.4. Company Product Portfolio
12.10.5. Recent Developments
12.10.6. SWOT Analysis
12.11. Kraken D
12.11.1. Business Overview
12.11.2. Company Snapshot
12.11.3. Company Market Share Analysis
12.11.4. Company Product Portfolio
12.11.5. Recent Developments
12.11.6. SWOT Analysis
12.12. Software AG
12.12.1. Business Overview
12.12.2. Company Snapshot
12.12.3. Company Market Share Analysis
12.12.4. Company Product Portfolio
12.12.5. Recent Developments
12.12.6. SWOT Analysis
12.13. WSO2
12.13.1. Business Overview
12.13.2. Company Snapshot
12.13.3. Company Market Share Analysis
12.13.4. Company Product Portfolio
12.13.5. Recent Developments
12.13.6. SWOT Analysis
12.14. TeejLab Inc.
12.14.1. Business Overview
12.14.2. Company Snapshot
12.14.3. Company Market Share Analysis
12.14.4. Company Product Portfolio
12.14.5. Recent Developments
12.14.6. SWOT Analysis
12.15. Workato
12.15.1. Business Overview
12.15.2. Company Snapshot
12.15.3. Company Market Share Analysis
12.15.4. Company Product Portfolio
12.15.5. Recent Developments
12.15.6. SWOT Analysis
12.16. OpenLegacy Technology
12.16.1. Business Overview
12.16.2. Company Snapshot
12.16.3. Company Market Share Analysis
12.16.4. Company Product Portfolio
12.16.5. Recent Developments
12.16.6. SWOT Analysis
12.17. DreamFactory Software
12.17.1. Business Overview
12.17.2. Company Snapshot
12.17.3. Company Market Share Analysis
12.17.4. Company Product Portfolio
12.17.5. Recent Developments
12.17.6. SWOT Analysis
12.18. Postman
12.18.1. Business Overview
12.18.2. Company Snapshot
12.18.3. Company Market Share Analysis
12.18.4. Company Product Portfolio
12.18.5. Recent Developments
12.18.6. SWOT Analysis
12.19. Sensedia
12.19.1. Business Overview
12.19.2. Company Snapshot
12.19.3. Company Market Share Analysis
12.19.4. Company Product Portfolio
12.19.5. Recent Developments
12.19.6. SWOT Analysis
List of Table
1. Global API Management Market, By Deployment, 2019-2032 (USD Billion)
2. Global Cloud, API Management Market, By Region, 2019-2032 (USD Billion)
3. Global On-Premises, API Management Market, By Region, 2019-2032 (USD Billion)
4. Global API Management Market, By Component, 2019-2032 (USD Billion)
5. Global Services, API Management Market, By Region, 2019-2032 (USD Billion)
6. Global Software, API Management Market, By Region, 2019-2032 (USD Billion)
7. Global API Management Market, By Organization Size, 2019-2032 (USD Billion)
8. Global Small and Medium Scale Organization, API Management Market, By Region, 2019-2032 (USD Billion)
9. Global Large Scale Organization, API Management Market, By Region, 2019-2032 (USD Billion)
10. Global API Management Market, By End-user, 2019-2032 (USD Billion)
11. Global Retail, API Management Market, By Region, 2019-2032 (USD Billion)
12. Global BFSI, API Management Market, By Region, 2019-2032 (USD Billion)
13. Global Telecom and IT, API Management Market, By Region, 2019-2032 (USD Billion)
14. Global Healthcare and Life Science, API Management Market, By Region, 2019-2032 (USD Billion)
15. Global Government and Education, API Management Market, By Region, 2019-2032 (USD Billion)
16. Global Others, API Management Market, By Region, 2019-2032 (USD Billion)
17. Global API Management Market, By Region, 2019-2032 (USD Billion)
18. North America API Management Market, By Deployment, 2019-2032 (USD Billion)
19. North America API Management Market, By Component, 2019-2032 (USD Billion)
20. North America API Management Market, By Organization Size, 2019-2032 (USD Billion)
21. North America API Management Market, By End-user, 2019-2032 (USD Billion)
22. U.S. API Management Market, By Deployment, 2019-2032 (USD Billion)
23. U.S. API Management Market, By Component, 2019-2032 (USD Billion)
24. U.S. API Management Market, By Organization Size, 2019-2032 (USD Billion)
25. U.S. API Management Market, By End-user, 2019-2032 (USD Billion)
26. Canada API Management Market, By Deployment, 2019-2032 (USD Billion)
27. Canada API Management Market, By Component, 2019-2032 (USD Billion)
28. Canada API Management Market, By Organization Size, 2019-2032 (USD Billion)
29. Canada API Management Market, By End-user, 2019-2032 (USD Billion)
30. Mexico API Management Market, By Deployment, 2019-2032 (USD Billion)
31. Mexico API Management Market, By Component, 2019-2032 (USD Billion)
32. Mexico API Management Market, By Organization Size, 2019-2032 (USD Billion)
33. Mexico API Management Market, By End-user, 2019-2032 (USD Billion)
34. Europe API Management Market, By Deployment, 2019-2032 (USD Billion)
35. Europe API Management Market, By Component, 2019-2032 (USD Billion)
36. Europe API Management Market, By Organization Size, 2019-2032 (USD Billion)
37. Europe API Management Market, By End-user, 2019-2032 (USD Billion)
38. Germany API Management Market, By Deployment, 2019-2032 (USD Billion)
39. Germany API Management Market, By Component, 2019-2032 (USD Billion)
40. Germany API Management Market, By Organization Size, 2019-2032 (USD Billion)
41. Germany API Management Market, By End-user, 2019-2032 (USD Billion)
42. France API Management Market, By Deployment, 2019-2032 (USD Billion)
43. France API Management Market, By Component, 2019-2032 (USD Billion)
44. France API Management Market, By Organization Size, 2019-2032 (USD Billion)
45. France API Management Market, By End-user, 2019-2032 (USD Billion)
46. U.K. API Management Market, By Deployment, 2019-2032 (USD Billion)
47. U.K. API Management Market, By Component, 2019-2032 (USD Billion)
48. U.K. API Management Market, By Organization Size, 2019-2032 (USD Billion)
49. U.K. API Management Market, By End-user, 2019-2032 (USD Billion)
50. Italy API Management Market, By Deployment, 2019-2032 (USD Billion)
51. Italy API Management Market, By Component, 2019-2032 (USD Billion)
52. Italy API Management Market, By Organization Size, 2019-2032 (USD Billion)
53. Italy API Management Market, By End-user, 2019-2032 (USD Billion)
54. Spain API Management Market, By Deployment, 2019-2032 (USD Billion)
55. Spain API Management Market, By Component, 2019-2032 (USD Billion)
56. Spain API Management Market, By Organization Size, 2019-2032 (USD Billion)
57. Spain API Management Market, By End-user, 2019-2032 (USD Billion)
58. Asia Pacific API Management Market, By Deployment, 2019-2032 (USD Billion)
59. Asia Pacific API Management Market, By Component, 2019-2032 (USD Billion)
60. Asia Pacific API Management Market, By Organization Size, 2019-2032 (USD Billion)
61. Asia Pacific API Management Market, By End-user, 2019-2032 (USD Billion)
62. Japan API Management Market, By Deployment, 2019-2032 (USD Billion)
63. Japan API Management Market, By Component, 2019-2032 (USD Billion)
64. Japan API Management Market, By Organization Size, 2019-2032 (USD Billion)
65. Japan API Management Market, By End-user, 2019-2032 (USD Billion)
66. China API Management Market, By Deployment, 2019-2032 (USD Billion)
67. China API Management Market, By Component, 2019-2032 (USD Billion)
68. China API Management Market, By Organization Size, 2019-2032 (USD Billion)
69. China API Management Market, By End-user, 2019-2032 (USD Billion)
70. India API Management Market, By Deployment, 2019-2032 (USD Billion)
71. India API Management Market, By Component, 2019-2032 (USD Billion)
72. India API Management Market, By Organization Size, 2019-2032 (USD Billion)
73. India API Management Market, By End-user, 2019-2032 (USD Billion)
74. South America API Management Market, By Deployment, 2019-2032 (USD Billion)
75. South America API Management Market, By Component, 2019-2032 (USD Billion)
76. South America API Management Market, By Organization Size, 2019-2032 (USD Billion)
77. South America API Management Market, By End-user, 2019-2032 (USD Billion)
78. Brazil API Management Market, By Deployment, 2019-2032 (USD Billion)
79. Brazil API Management Market, By Component, 2019-2032 (USD Billion)
80. Brazil API Management Market, By Organization Size, 2019-2032 (USD Billion)
81. Brazil API Management Market, By End-user, 2019-2032 (USD Billion)
82. Middle East and Africa API Management Market, By Deployment, 2019-2032 (USD Billion)
83. Middle East and Africa API Management Market, By Component, 2019-2032 (USD Billion)
84. Middle East and Africa API Management Market, By Organization Size, 2019-2032 (USD Billion)
85. Middle East and Africa API Management Market, By End-user, 2019-2032 (USD Billion)
86. UAE API Management Market, By Deployment, 2019-2032 (USD Billion)
87. UAE API Management Market, By Component, 2019-2032 (USD Billion)
88. UAE API Management Market, By Organization Size, 2019-2032 (USD Billion)
89. UAE API Management Market, By End-user, 2019-2032 (USD Billion)
90. South Africa API Management Market, By Deployment, 2019-2032 (USD Billion)
91. South Africa API Management Market, By Component, 2019-2032 (USD Billion)
92. South Africa API Management Market, By Organization Size, 2019-2032 (USD Billion)
South Africa API Management Market, By End-user, 2019-2032 (USD Billion)
List of Figures
1. Global API Management Market Segmentation
2. API Management Market: Research Methodology
3. Market Size Estimation Methodology: Bottom-Up Approach
4. Market Size Estimation Methodology: Top-Down Approach
5. Data Triangulation
6. Porter’s Five Forces Analysis
7. Value Chain Analysis
8. Global API Management Market Attractiveness Analysis by Deployment
9. Global API Management Market Attractiveness Analysis by Component
10. Global API Management Market Attractiveness Analysis by Organization Size
11. Global API Management Market Attractiveness Analysis by End-user
12. Global API Management Market Attractiveness Analysis by Region
13. Global API Management Market: Dynamics
14. Global API Management Market Share by Deployment (2022 & 2032)
15. Global API Management Market Share by Component (2022 & 2032)
16. Global API Management Market Share by Organization Size (2022 & 2032)
17. Global API Management Market Share by End-user (2022 & 2032)
18. Global API Management Market Share by Regions (2022 & 2032)
19. Global API Management Market Share by Company (2022)
This study forecasts revenue at global, regional, and country levels from 2019 to 2032. The Brainy Insights has segmented the global API management market based on below mentioned segments:
Global API Management Market by Deployment:
Global API Management Market by Component:
Global API Management Market by Organization Size:
Global API Management Market by End-user:
Global API Management Market by Region:
Research has its special purpose to undertake marketing efficiently. In this competitive scenario, businesses need information across all industry verticals; the information about customer wants, market demand, competition, industry trends, distribution channels etc. This information needs to be updated regularly because businesses operate in a dynamic environment. Our organization, The Brainy Insights incorporates scientific and systematic research procedures in order to get proper market insights and industry analysis for overall business success. The analysis consists of studying the market from a miniscule level wherein we implement statistical tools which helps us in examining the data with accuracy and precision.
Our research reports feature both; quantitative and qualitative aspects for any market. Qualitative information for any market research process are fundamental because they reveal the customer needs and wants, usage and consumption for any product/service related to a specific industry. This in turn aids the marketers/investors in knowing certain perceptions of the customers. Qualitative research can enlighten about the different product concepts and designs along with unique service offering that in turn, helps define marketing problems and generate opportunities. On the other hand, quantitative research engages with the data collection process through interviews, e-mail interactions, surveys and pilot studies. Quantitative aspects for the market research are useful to validate the hypotheses generated during qualitative research method, explore empirical patterns in the data with the help of statistical tools, and finally make the market estimations.
The Brainy Insights offers comprehensive research and analysis, based on a wide assortment of factual insights gained through interviews with CXOs and global experts and secondary data from reliable sources. Our analysts and industry specialist assume vital roles in building up statistical tools and analysis models, which are used to analyse the data and arrive at accurate insights with exceedingly informative research discoveries. The data provided by our organization have proven precious to a diverse range of companies, facilitating them to address issues such as determining which products/services are the most appealing, whether or not customers use the product in the manner anticipated, the purchasing intentions of the market and many others.
Our research methodology encompasses an idyllic combination of primary and secondary initiatives. Key phases involved in this process are listed below:

The phase involves the gathering and collecting of market data and its related information with the help of different sources & research procedures.

The data procurement stage involves in data gathering and collecting through various data sources.
This stage involves in extensive research. These data sources includes:
Purchased Database: Purchased databases play a crucial role in estimating the market sizes irrespective of the domain. Our purchased database includes:
Primary Research: The Brainy Insights interacts with leading companies and experts of the concerned domain to develop the analyst team’s market understanding and expertise. It improves and substantiates every single data presented in the market reports. Primary research mainly involves in telephonic interviews, E-mail interactions and face-to-face interviews with the raw material providers, manufacturers/producers, distributors, & independent consultants. The interviews that we conduct provides valuable data on market size and industry growth trends prevailing in the market. Our organization also conducts surveys with the various industry experts in order to gain overall insights of the industry/market. For instance, in healthcare industry we conduct surveys with the pharmacists, doctors, surgeons and nurses in order to gain insights and key information of a medical product/device/equipment which the customers are going to usage. Surveys are conducted in the form of questionnaire designed by our own analyst team. Surveys plays an important role in primary research because surveys helps us to identify the key target audiences of the market. Additionally, surveys helps to identify the key target audience engaged with the market. Our survey team conducts the survey by targeting the key audience, thus gaining insights from them. Based on the perspectives of the customers, this information is utilized to formulate market strategies. Moreover, market surveys helps us to understand the current competitive situation of the industry. To be precise, our survey process typically involve with the 360 analysis of the market. This analytical process begins by identifying the prospective customers for a product or service related to the market/industry to obtain data on how a product/service could fit into customers’ lives.

Secondary Research: The secondary data sources includes information published by the on-profit organizations such as World bank, WHO, company fillings, investor presentations, annual reports, national government documents, statistical databases, blogs, articles, white papers and others. From the annual report, we analyse a company’s revenue to understand the key segment and market share of that organization in a particular region. We analyse the company websites and adopt the product mapping technique which is important for deriving the segment revenue. In the product mapping method, we select and categorize the products offered by the companies catering to domain specific market, deduce the product revenue for each of the companies so as to get overall estimation of the market size. We also source data and analyses trends based on information received from supply side and demand side intermediaries in the value chain. The supply side denotes the data gathered from supplier, distributor, wholesaler and the demand side illustrates the data gathered from the end customers for respective market domain.

The supply side for a domain specific market is analysed by:
The demand side for the market is estimated through:
In-house Library: Apart from these third-party sources, we have our in-house library of qualitative and quantitative information. Our in-house database includes market data for various industry and domains. These data are updated on regular basis as per the changing market scenario. Our library includes, historic databases, internal audit reports and archives.
Sometimes there are instances where there is no metadata or raw data available for any domain specific market. For those cases, we use our expertise to forecast and estimate the market size in order to generate comprehensive data sets. Our analyst team adopt a robust research technique in order to produce the estimates:
Data Synthesis: This stage involves the analysis & mapping of all the information obtained from the previous step. It also involves in scrutinizing the data for any discrepancy observed while data gathering related to the market. The data is collected with consideration to the heterogeneity of sources. Robust scientific techniques are in place for synthesizing disparate data sets and provide the essential contextual information that can orient market strategies. The Brainy Insights has extensive experience in data synthesis where the data passes through various stages:


Market Deduction & Formulation: The final stage comprises of assigning data points at appropriate market spaces so as to deduce feasible conclusions. Analyst perspective & subject matter expert based holistic form of market sizing coupled with industry analysis also plays a crucial role in this stage.
This stage involves in finalization of the market size and numbers that we have collected from data integration step. With data interpolation, it is made sure that there is no gap in the market data. Successful trend analysis is done by our analysts using extrapolation techniques, which provide the best possible forecasts for the market.
Data Validation & Market Feedback: Validation is the most important step in the process. Validation & re-validation via an intricately designed process helps us finalize data-points to be used for final calculations.

The Brainy Insights interacts with leading companies and experts of the concerned domain to develop the analyst team’s market understanding and expertise. It improves and substantiates every single data presented in the market reports. The data validation interview and discussion panels are typically composed of the most experienced industry members. The participants include, however, are not limited to:
Moreover, we always validate our data and findings through primary respondents from all the major regions we are working on.


Free Customization
Fortune 500 Clients
Free Yearly Update On Purchase Of Multi/Corporate License
Companies Served Till Date