- +1-315-215-1633
- sales@thebrainyinsights.com

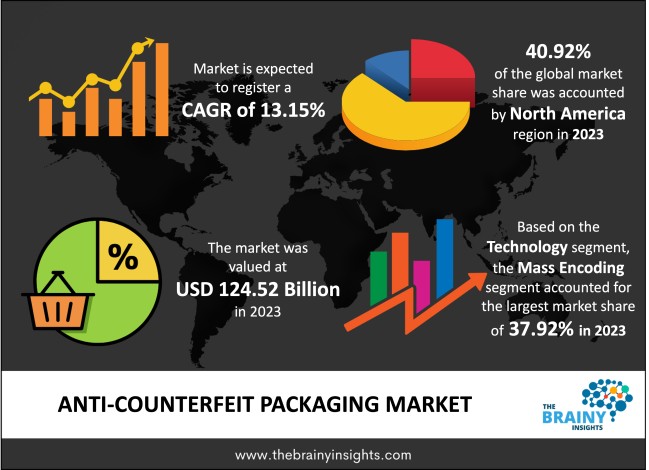
The global anti-counterfeit packaging market was valued at USD 124.52 Billion in 2023 and grew at a CAGR of 13.15% from 2024 to 2033. The market is expected to reach USD 428.33 Billion by 2033. The growth of the anti-counterfeit packaging market can be attributed to the rising applications of it in different end-user industries such as food and beverages, pharmaceutical, automotive, etc. Further, the increasing investment in the logistics industry has played a pivotal role in the market growth.
With the aid of packaging, anti-counterfeit packaging is a cutting-edge technique used to identify counterfeit goods in any business. 2-D barcodes, forensic methods, visible or overt features, radio frequency identification, holograms, hidden or covert markers, and serialization are a few anti-counterfeit packaging solutions. Anti-counterfeit packaging also includes trace and track options to shield customers from fake goods. One of the most important methods to prevent counterfeiting is using secure packaging. Secure product packaging reduces product infringement and counterfeiting thanks to anti-counterfeit packaging. This validates the products' safety and aids in preventing imitation. Many businesses and sectors implement anti-counterfeit measures to reduce the income and customer loyalty losses brought on by product counterfeiting. Businesses also enhance their reputation and safeguard client loyalty, helping propel the market for anti-counterfeit packaging.
Get an overview of this study by requesting a free sample
Increasing number of counterfeit products: The packaging sector is expanding rapidly due to the increasing demand for packaged goods from well-known industries, including personal care, food and beverage, and pharmaceuticals. The market for anti-counterfeit packaging products is expanding across numerous industries due to growing concerns about the detrimental consequences of counterfeit goods. Most of the damage caused by counterfeiting is suffered by retailers and premium companies, particularly those selling their goods on international markets. Although counterfeiting hurts these companies, there are larger geopolitical ramifications as well. The market for anti-counterfeit packaging items is rapidly expanding due to the ongoing growth in counterfeit goods across all industries, which has caused financial losses and a decline in customer loyalty for numerous businesses.
High setup cost: The production of anti-counterfeit packaging necessitates sophisticated setup and substantial innovation expenses, impeding market expansion. The market is growing more slowly due to potential customers and new competitors being discouraged by the high manufacturing cost.
Public spending for controlling illicit trading: The toxic and corrosive character of illicit commerce and organized transnational crime stifles economic growth and job creation, undermines the rule of law, deprives governments of essential revenue, and jeopardizes human rights and quality of life, necessitating a forceful, globally coordinated response. Drug trafficking is a global illegal enterprise that includes the cultivation, manufacture, distribution, and sale of substances that are prohibited by law. In the Customs context, IPR and health and safety threats include interdicting fake or counterfeit medications, other counterfeit and pirated commodities, and tainted foodstuffs, among other things. Thus, the use of anti-counterfeit packaging should increase substantially during the forecast period.
The regions analyzed for the market include North America, Europe, South America, Asia Pacific, the Middle East, and Africa. North America emerged as the most significant Anti-Counterfeit Packaging market, with a 40.92% market revenue share in 2023.
North America region will account for the largest market share with revenue growth. The market is being driven by the numerous end-user businesses in the regional countries. End-users in the region extensively utilize such products to limit the sales of illicit products. Through technology and policy, the regional government and business sector are successfully addressing the high rate of counterfeiting in the nation, fostering the expansion of the North American market.
North America region Anti-Counterfeit Packaging Market Share in 2023 - 40.92%
www.thebrainyinsights.com
Check the geographical analysis of this market by requesting a free sample
The technology segment is divided into forensic markers, mass encoding, holograms, RFID, and tamper evidence. The mass encoding segment dominated the market, with a share of around 37.92% in 2023. Large encoded combinatorial libraries can be produced by a revolutionary coding approach called mass encoding. The mass encoding technology's product tracking solution was the cause of this high proportion. The supply chain management and logistics systems offer the tracking solution at different nodes.
The end-user segment is divided into pharmaceuticals, food and beverages, electrical and electronics, automotive, personal care, apparel and footwear, and luxury products. The pharmaceutical segment dominated the market, with a share of around 35.04% in 2023. The increased sales of pharmaceutical items during the COVID-19 pandemic have contributed to the pharmaceutical sector's growth. The market is expanding due to growing awareness of the risks to human health and the safety of pharmaceutical products.
Report Description:
| Attribute | Description |
|---|---|
| Market Size | Revenue (USD Billion) |
| Market size value in 2023 | USD 124.52 Billion |
| Market size value in 2033 | USD 428.33 Billion |
| CAGR (2024 to 2033) | 13.15% |
| Historical data | 2020-2022 |
| Base Year | 2023 |
| Forecast | 2024-2033 |
| Region | The regions analyzed for the market are Asia Pacific, Europe, South America, North America, and Middle East & Africa. Furthermore, the regions are further analyzed at the country level. |
| Segments | Technology and End-user |
As per The Brainy Insights, the size of the anti-counterfeit packaging market was valued at USD 124.52 Billion in 2023 to USD 428.33 Billion by 2033.
Global anti-counterfeit packaging market is growing at a CAGR of 13.15% during the forecast period 2024-2033.
The global anti-counterfeit packaging market has been segmented based on technology, end-user and regions. Mass encoding led the market in 2023 in the application segment. Pharmaceutical led the market in 2023 in the end-user segment.
North America region emerged as the largest market for the anti-counterfeit packaging.
The market's growth will be influenced by the growing usage of anti-counterfeit packaging.
The high setup cost can hamper the market growth.
The increasing public spending on limiting the sale of illicit product is providing huge opportunities to the market.
Key players are Alien Technology Corp, Flint Group, Avery Dennison Corporation, Alpvision, Zebra Technologies, Sicapa, TraceLink Inc, Avery Dennison, Inksure Technologies, Authentix Inc., Catalent Pharma Solution Inc., among others.
1. Introduction
1.1. Objectives of the Study
1.2. Market Definition
1.3. Research Scope
1.4. Currency
1.5. Key Target Audience
2. Research Methodology and Assumptions
3. Executive Summary
4. Premium Insights
4.1. Porter’s Five Forces Analysis
4.2. Value Chain Analysis
4.3. Top Investment Pockets
4.3.1. Market Attractiveness Analysis by Technology
4.3.2. Market Attractiveness Analysis by End-user
4.3.3. Market Attractiveness Analysis by Region
4.4. Industry Trends
5. Market Dynamics
5.1. Market Evaluation
5.2. Drivers
5.2.1. Increasing usage of anti-counterfeit packaging across end-users
5.3. Restraints
5.3.1. High cost of setup
5.4. Opportunities
5.4.1. Increasing investment in controlling sales of illicit products
5.5. Challenges
5.5.1. Lack of awareness
6. Global Anti-Counterfeit Packaging Market Analysis and Forecast, By Technology
6.1. Segment Overview
6.2. Forensic Markers
6.3. Mass Encoding
6.4. Holograms
6.5. RFID
6.6. Tamper Evidence
7. Global Anti-Counterfeit Packaging Market Analysis and Forecast, By End-user
7.1. Segment Overview
7.2. Pharmaceutical
7.3. Food and Beverages
7.4. Electrical and Electronics
7.5. Automotive
7.6. Personal Care
7.7. Apparel and Footwear
7.8. Luxury Products
7.9. Others
8. Global Anti-Counterfeit Packaging Market Analysis and Forecast, By Regional Analysis
8.1. Segment Overview
8.2. North America
8.2.1. U.S.
8.2.2. Canada
8.2.3. Mexico
8.3. Europe
8.3.1. Germany
8.3.2. France
8.3.3. U.K.
8.3.4. Italy
8.3.5. Spain
8.4. Asia-Pacific
8.4.1. Japan
8.4.2. China
8.4.3. India
8.5. South America
8.5.1. Brazil
8.6. Middle East and Africa
8.6.1. UAE
8.6.2. South Africa
9. Global Anti-Counterfeit Packaging Market-Competitive Landscape
9.1. Overview
9.2. Market Share of Key Players in the Anti-Counterfeit Packaging Market
9.2.1. Global Company Market Share
9.2.2. North America Company Market Share
9.2.3. Europe Company Market Share
9.2.4. APAC Company Market Share
9.3. Competitive Situations and Trends
9.3.1. Product Launches and Developments
9.3.2. Partnerships, Collaborations, and Agreements
9.3.3. Mergers & Acquisitions
9.3.4. Expansions
10. Company Profiles
10.1. Alien Technology Corp
10.1.1. Business Overview
10.1.2. Company Snapshot
10.1.3. Company Market Share Analysis
10.1.4. Company Product Portfolio
10.1.5. Recent Developments
10.1.6. SWOT Analysis
10.2. Flint Group
10.2.1. Business Overview
10.2.2. Company Snapshot
10.2.3. Company Market Share Analysis
10.2.4. Company Product Portfolio
10.2.5. Recent Developments
10.2.6. SWOT Analysis
10.3. Avery Dennison Corporation
10.3.1. Business Overview
10.3.2. Company Snapshot
10.3.3. Company Market Share Analysis
10.3.4. Company Product Portfolio
10.3.5. Recent Developments
10.3.6. SWOT Analysis
10.4. Alpvision
10.4.1. Business Overview
10.4.2. Company Snapshot
10.4.3. Company Market Share Analysis
10.4.4. Company Product Portfolio
10.4.5. Recent Developments
10.4.6. SWOT Analysis
10.5. Zebra Technologies
10.5.1. Business Overview
10.5.2. Company Snapshot
10.5.3. Company Market Share Analysis
10.5.4. Company Product Portfolio
10.5.5. Recent Developments
10.5.6. SWOT Analysis
10.6. Sicapa
10.6.1. Business Overview
10.6.2. Company Snapshot
10.6.3. Company Market Share Analysis
10.6.4. Company Product Portfolio
10.6.5. Recent Developments
10.6.6. SWOT Analysis
10.7. TraceLink Inc
10.7.1. Business Overview
10.7.2. Company Snapshot
10.7.3. Company Market Share Analysis
10.7.4. Company Product Portfolio
10.7.5. Recent Developments
10.7.6. SWOT Analysis
10.8. Avery Dennison
10.8.1. Business Overview
10.8.2. Company Snapshot
10.8.3. Company Market Share Analysis
10.8.4. Company Product Portfolio
10.8.5. Recent Developments
10.8.6. SWOT Analysis
10.9. Inksure Technologies
10.9.1. Business Overview
10.9.2. Company Snapshot
10.9.3. Company Market Share Analysis
10.9.4. Company Product Portfolio
10.9.5. Recent Developments
10.9.6. SWOT Analysis
10.10. Authentix Inc.
10.10.1. Business Overview
10.10.2. Company Snapshot
10.10.3. Company Market Share Analysis
10.10.4. Company Product Portfolio
10.10.5. Recent Developments
10.10.6. SWOT Analysis
10.11. Catalent Pharma Solution Inc.
10.11.1. Business Overview
10.11.2. Company Snapshot
10.11.3. Company Market Share Analysis
10.11.4. Company Product Portfolio
10.11.5. Recent Developments
10.11.6. SWOT Analysis
List of Table
1. Global Anti-Counterfeit Packaging Market, By Technology, 2020-2033 (USD Billion)
2. Global Forensic Markers, Anti-Counterfeit Packaging Market, By Region, 2020-2033 (USD Billion)
3. Global Mass Encoding, Anti-Counterfeit Packaging Market, By Region, 2020-2033 (USD Billion)
4. Global Holograms, Anti-Counterfeit Packaging Market, By Region, 2020-2033 (USD Billion)
5. Global RFID, Anti-Counterfeit Packaging Market, By Region, 2020-2033 (USD Billion)
6. Global Tamper Evidence, Anti-Counterfeit Packaging Market, By Region, 2020-2033 (USD Billion)
7. Global Others, Anti-Counterfeit Packaging Market, By Region, 2020-2033 (USD Billion)
8. Global Anti-Counterfeit Packaging Market, By End-user, 2020-2033 (USD Billion)
9. Global Pharmaceutical, Anti-Counterfeit Packaging Market, By Region, 2020-2033 (USD Billion)
10. Global Food and Beverages, Anti-Counterfeit Packaging Market, By Region, 2020-2033 (USD Billion)
11. Global Electrical and Electronics, Anti-Counterfeit Packaging Market, By Region, 2020-2033 (USD Billion)
12. Global Automotive, Anti-Counterfeit Packaging Market, By Region, 2020-2033 (USD Billion)
13. Global Personal Care, Anti-Counterfeit Packaging Market, By Region, 2020-2033 (USD Billion)
14. Global Apparel and Footwear, Anti-Counterfeit Packaging Market, By Region, 2020-2033 (USD Billion)
15. Global Luxury Products, Anti-Counterfeit Packaging Market, By Region, 2020-2033 (USD Billion)
16. Global Others, Anti-Counterfeit Packaging Market, By Region, 2020-2033 (USD Billion)
17. Global Anti-Counterfeit Packaging Market, By Region, 2020-2033 (USD Billion)
18. North America Anti-Counterfeit Packaging Market, By Technology, 2020-2033 (USD Billion)
19. North America Anti-Counterfeit Packaging Market, By End-user, 2020-2033 (USD Billion)
20. U.S. Anti-Counterfeit Packaging Market, By Technology, 2020-2033 (USD Billion)
21. U.S. Anti-Counterfeit Packaging Market, By End-user, 2020-2033 (USD Billion)
22. Canada Anti-Counterfeit Packaging Market, By Technology, 2020-2033 (USD Billion)
23. Canada Anti-Counterfeit Packaging Market, By End-user, 2020-2033 (USD Billion)
24. Mexico Anti-Counterfeit Packaging Market, By Technology, 2020-2033 (USD Billion)
25. Mexico Anti-Counterfeit Packaging Market, By End-user, 2020-2033 (USD Billion)
26. Europe Anti-Counterfeit Packaging Market, By Technology, 2020-2033 (USD Billion)
27. Europe Anti-Counterfeit Packaging Market, By End-user, 2020-2033 (USD Billion)
28. Germany Anti-Counterfeit Packaging Market, By Technology, 2020-2033 (USD Billion)
29. Germany Anti-Counterfeit Packaging Market, By End-user, 2020-2033 (USD Billion)
30. France Anti-Counterfeit Packaging Market, By Technology, 2020-2033 (USD Billion)
31. France Anti-Counterfeit Packaging Market, By End-user, 2020-2033 (USD Billion)
32. U.K. Anti-Counterfeit Packaging Market, By Technology, 2020-2033 (USD Billion)
33. U.K. Anti-Counterfeit Packaging Market, By End-user, 2020-2033 (USD Billion)
34. Italy Anti-Counterfeit Packaging Market, By Technology, 2020-2033 (USD Billion)
35. Italy Anti-Counterfeit Packaging Market, By End-user, 2020-2033 (USD Billion)
36. Spain Anti-Counterfeit Packaging Market, By Technology, 2020-2033 (USD Billion)
37. Spain Anti-Counterfeit Packaging Market, By End-user, 2020-2033 (USD Billion)
38. Asia Pacific Anti-Counterfeit Packaging Market, By Technology, 2020-2033 (USD Billion)
39. Asia Pacific Anti-Counterfeit Packaging Market, By End-user, 2020-2033 (USD Billion)
40. Japan Anti-Counterfeit Packaging Market, By Technology, 2020-2033 (USD Billion)
41. Japan Anti-Counterfeit Packaging Market, By End-user, 2020-2033 (USD Billion)
42. China Anti-Counterfeit Packaging Market, By Technology, 2020-2033 (USD Billion)
43. China Anti-Counterfeit Packaging Market, By End-user, 2020-2033 (USD Billion)
44. India Anti-Counterfeit Packaging Market, By Technology, 2020-2033 (USD Billion)
45. India Anti-Counterfeit Packaging Market, By End-user, 2020-2033 (USD Billion)
46. South America Anti-Counterfeit Packaging Market, By Technology, 2020-2033 (USD Billion)
47. South America Anti-Counterfeit Packaging Market, By End-user, 2020-2033 (USD Billion)
48. Brazil Anti-Counterfeit Packaging Market, By Technology, 2020-2033 (USD Billion)
49. Brazil Anti-Counterfeit Packaging Market, By End-user, 2020-2033 (USD Billion)
50. Middle East and Africa Anti-Counterfeit Packaging Market, By Technology, 2020-2033 (USD Billion)
51. Middle East and Africa Anti-Counterfeit Packaging Market, By End-user, 2020-2033 (USD Billion)
52. UAE Anti-Counterfeit Packaging Market, By Technology, 2020-2033 (USD Billion)
53. UAE Anti-Counterfeit Packaging Market, By End-user, 2020-2033 (USD Billion)
54. South Africa Anti-Counterfeit Packaging Market, By Technology, 2020-2033 (USD Billion)
55. South Africa Anti-Counterfeit Packaging Market, By End-user, 2020-2033 (USD Billion)
List of Figures
1. Global Anti-Counterfeit Packaging Market Segmentation
2. Anti-Counterfeit Packaging Market: Research Methodology
3. Market Size Estimation Methodology: Bottom-Up Approach
4. Market Size Estimation Methodology: Top-Down Approach
5. Data Triangulation
6. Porter’s Five Forces Analysis
7. Value Chain Analysis
8. Global Anti-Counterfeit Packaging Market Attractiveness Analysis by Technology
9. Global Anti-Counterfeit Packaging Market Attractiveness Analysis by End-user
10. Global Anti-Counterfeit Packaging Market Attractiveness Analysis by Region
11. Global Anti-Counterfeit Packaging Market: Dynamics
12. Global Anti-Counterfeit Packaging Market Share by Technology (2023 & 2033)
13. Global Anti-Counterfeit Packaging Market Share by End-user (2023 & 2033)
14. Global Anti-Counterfeit Packaging Market Share by Regions (2023 & 2033)
15. Global Anti-Counterfeit Packaging Market Share by Company (2023)
This study forecasts revenue at global, regional, and country levels from 2020 to 2033. The Brainy Insights has segmented the global anti-counterfeit packaging market based on below mentioned segments:
Global Anti-Counterfeit Packaging Market by Technology:
Global Anti-Counterfeit Packaging Market by End-user:
Global Anti-Counterfeit Packaging Market by Region:
Research has its special purpose to undertake marketing efficiently. In this competitive scenario, businesses need information across all industry verticals; the information about customer wants, market demand, competition, industry trends, distribution channels etc. This information needs to be updated regularly because businesses operate in a dynamic environment. Our organization, The Brainy Insights incorporates scientific and systematic research procedures in order to get proper market insights and industry analysis for overall business success. The analysis consists of studying the market from a miniscule level wherein we implement statistical tools which helps us in examining the data with accuracy and precision.
Our research reports feature both; quantitative and qualitative aspects for any market. Qualitative information for any market research process are fundamental because they reveal the customer needs and wants, usage and consumption for any product/service related to a specific industry. This in turn aids the marketers/investors in knowing certain perceptions of the customers. Qualitative research can enlighten about the different product concepts and designs along with unique service offering that in turn, helps define marketing problems and generate opportunities. On the other hand, quantitative research engages with the data collection process through interviews, e-mail interactions, surveys and pilot studies. Quantitative aspects for the market research are useful to validate the hypotheses generated during qualitative research method, explore empirical patterns in the data with the help of statistical tools, and finally make the market estimations.
The Brainy Insights offers comprehensive research and analysis, based on a wide assortment of factual insights gained through interviews with CXOs and global experts and secondary data from reliable sources. Our analysts and industry specialist assume vital roles in building up statistical tools and analysis models, which are used to analyse the data and arrive at accurate insights with exceedingly informative research discoveries. The data provided by our organization have proven precious to a diverse range of companies, facilitating them to address issues such as determining which products/services are the most appealing, whether or not customers use the product in the manner anticipated, the purchasing intentions of the market and many others.
Our research methodology encompasses an idyllic combination of primary and secondary initiatives. Key phases involved in this process are listed below:

The phase involves the gathering and collecting of market data and its related information with the help of different sources & research procedures.

The data procurement stage involves in data gathering and collecting through various data sources.
This stage involves in extensive research. These data sources includes:
Purchased Database: Purchased databases play a crucial role in estimating the market sizes irrespective of the domain. Our purchased database includes:
Primary Research: The Brainy Insights interacts with leading companies and experts of the concerned domain to develop the analyst team’s market understanding and expertise. It improves and substantiates every single data presented in the market reports. Primary research mainly involves in telephonic interviews, E-mail interactions and face-to-face interviews with the raw material providers, manufacturers/producers, distributors, & independent consultants. The interviews that we conduct provides valuable data on market size and industry growth trends prevailing in the market. Our organization also conducts surveys with the various industry experts in order to gain overall insights of the industry/market. For instance, in healthcare industry we conduct surveys with the pharmacists, doctors, surgeons and nurses in order to gain insights and key information of a medical product/device/equipment which the customers are going to usage. Surveys are conducted in the form of questionnaire designed by our own analyst team. Surveys plays an important role in primary research because surveys helps us to identify the key target audiences of the market. Additionally, surveys helps to identify the key target audience engaged with the market. Our survey team conducts the survey by targeting the key audience, thus gaining insights from them. Based on the perspectives of the customers, this information is utilized to formulate market strategies. Moreover, market surveys helps us to understand the current competitive situation of the industry. To be precise, our survey process typically involve with the 360 analysis of the market. This analytical process begins by identifying the prospective customers for a product or service related to the market/industry to obtain data on how a product/service could fit into customers’ lives.

Secondary Research: The secondary data sources includes information published by the on-profit organizations such as World bank, WHO, company fillings, investor presentations, annual reports, national government documents, statistical databases, blogs, articles, white papers and others. From the annual report, we analyse a company’s revenue to understand the key segment and market share of that organization in a particular region. We analyse the company websites and adopt the product mapping technique which is important for deriving the segment revenue. In the product mapping method, we select and categorize the products offered by the companies catering to domain specific market, deduce the product revenue for each of the companies so as to get overall estimation of the market size. We also source data and analyses trends based on information received from supply side and demand side intermediaries in the value chain. The supply side denotes the data gathered from supplier, distributor, wholesaler and the demand side illustrates the data gathered from the end customers for respective market domain.

The supply side for a domain specific market is analysed by:
The demand side for the market is estimated through:
In-house Library: Apart from these third-party sources, we have our in-house library of qualitative and quantitative information. Our in-house database includes market data for various industry and domains. These data are updated on regular basis as per the changing market scenario. Our library includes, historic databases, internal audit reports and archives.
Sometimes there are instances where there is no metadata or raw data available for any domain specific market. For those cases, we use our expertise to forecast and estimate the market size in order to generate comprehensive data sets. Our analyst team adopt a robust research technique in order to produce the estimates:
Data Synthesis: This stage involves the analysis & mapping of all the information obtained from the previous step. It also involves in scrutinizing the data for any discrepancy observed while data gathering related to the market. The data is collected with consideration to the heterogeneity of sources. Robust scientific techniques are in place for synthesizing disparate data sets and provide the essential contextual information that can orient market strategies. The Brainy Insights has extensive experience in data synthesis where the data passes through various stages:


Market Deduction & Formulation: The final stage comprises of assigning data points at appropriate market spaces so as to deduce feasible conclusions. Analyst perspective & subject matter expert based holistic form of market sizing coupled with industry analysis also plays a crucial role in this stage.
This stage involves in finalization of the market size and numbers that we have collected from data integration step. With data interpolation, it is made sure that there is no gap in the market data. Successful trend analysis is done by our analysts using extrapolation techniques, which provide the best possible forecasts for the market.
Data Validation & Market Feedback: Validation is the most important step in the process. Validation & re-validation via an intricately designed process helps us finalize data-points to be used for final calculations.

The Brainy Insights interacts with leading companies and experts of the concerned domain to develop the analyst team’s market understanding and expertise. It improves and substantiates every single data presented in the market reports. The data validation interview and discussion panels are typically composed of the most experienced industry members. The participants include, however, are not limited to:
Moreover, we always validate our data and findings through primary respondents from all the major regions we are working on.


Free Customization
Fortune 500 Clients
Free Yearly Update On Purchase Of Multi/Corporate License
Companies Served Till Date