- +1-315-215-1633
- sales@thebrainyinsights.com

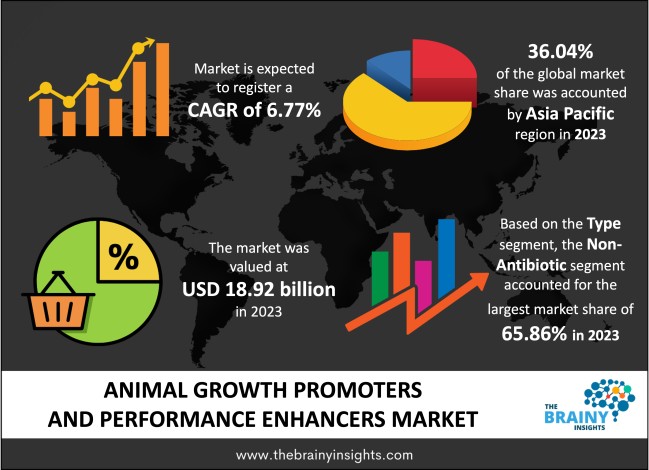
The global animal growth promoters and performance enhancers market was valued at USD 18.92 Billion in 2023 and grew at a CAGR of 6.77% from 2024 to 2033. The market is expected to reach USD 36.42 Billion by 2033. The growth of the animal growth promoters and performance enhancers market can be attributed to the rising demand for meat products. Further, the increasing investment in the animal husbandry industry has played a pivotal role in the market growth.
Drugs or substances known as animal growth promoters or performance enhancers are those that facilitate easier growth by maximizing food digestion and helping animals mature into robust, healthy adults. Additionally, these substances protect animals from a range of pathogenic illnesses. Cattle producers use such products to enhance the quality of their output, and boost productivity overall. Various substances, such as hormones and antibacterial treatments, have been tested to promote growth. Antibiotic and non-antibiotic are two main categories of animal growth promoters and performance enhancers. The use of antibiotics to promote growth has become more common as livestock production has become more intensive. Animal food additives come in various forms and are referred to as natural or non-antibiotic growth boosters.
Get an overview of this study by requesting a free sample
Increasing demand for meat: Meat is a staple food worldwide. Meat output has more than tripled over the previous 50 years, indicating a growing global need for meat. Presently, the global production exceeds 350 million tonnes annually. Asia is currently the world's largest meat producer in terms of region, accounting for a significant amount of the total meat produced worldwide. For instance, the amount of meat produced from poultry used to be smaller overall, but it now makes up a much larger part. In the meantime, the proportion of pig meat produced worldwide has remained unchanged. There has been a discernible shift in global agriculture in recent years. The increased production of animal feed, such as soy or maize, reduced the cost of producing meat, boosting the availability of meat in many nations.
Adverse effects: Certain promoters, such as β-agonists, have the potential to create negative side effects in users, including dizziness, headaches, tachycardia and tremors. When utilized under acceptable veterinary standards, many risk assessment studies for natural steroid hormones have shown insignificant consequences. Thus, the adverse effects on humans are restraining factors for the market.
Increasing investment in natural growth promoters: The primary goals of using growth promoters in agricultural animals are to raise feed-to-muscle conversion rates, improve fat and protein distribution, and stimulate growth. Growth boosters and metabolic modifiers increase production efficiency, provide a favourable return on investment, and reduce environmental impact, all of which contribute significantly to the sustainability of beef cattle production. Businesses in the market are spending more money on phytogenics to boost the effectiveness of growth promoters that are obtained naturally.
The regions analyzed for the market include North America, Europe, South America, Asia Pacific, the Middle East, and Africa. Asia-Pacific emerged as the most significant animal growth promoters and performance enhancers market, with a 36.04% market revenue share in 2023.
Asia Pacific region will account for the largest market share with revenue growth. The region has a high demand for animal growth promoters and performance enhancers to meet the requirements of food production quantity. Further, the growing population is leading to an increase in food production, which is eventually promoting the use of growth promoters and performance enhancers.
Asia-Pacific region Animal Growth Promoters and Performance Enhancers Market Share in 2023 - 36.04%
www.thebrainyinsights.com
Check the geographical analysis of this market by requesting a free sample
The type segment is divided into antibiotic and non-antibiotic. The non-antibiotic segment further includes feed enzyme, probiotic, organic acid, prebiotic, hormonal growth promoters, phytogenic and others. The non-antibiotic segment dominated the market, with a share of around 65.86% in 2023. As antibiotic growth promoters are prohibited in some countries, non-antibiotic growth promoters, or NAGPs, are frequently employed. NAGPs have been used in immunomodulation, growth promotion, and feed additives. They can also enhance productivity and aid in the treatment of illnesses.
The animal type segment is divided into porcine, poultry, equine, livestock and others. The poultry segment dominated the market, with a share of around 37.31% in 2023. Using non-antibiotic feed additives in the poultry business is important during the growing phase. It assists in maintaining the poultry industry's standards and improves production while ensuring food safety and the industry's standards and quality.
| Attribute | Description |
|---|---|
| Market Size | Revenue (USD Billion) |
| Market size value in 2023 | USD 18.92 Billion |
| Market size value in 2033 | USD 36.42 Billion |
| CAGR (2024 to 2033) | 6.77% |
| Historical data | 2020-2022 |
| Base Year | 2023 |
| Forecast | 2024-2033 |
| Region | The regions analyzed for the market are Asia Pacific, Europe, South America, North America, and Middle East & Africa. Furthermore, the regions are further analyzed at the country level. |
| Segments | Type and Animal Type |
As per The Brainy Insights, the size of the animal growth promoters and performance enhancers market was valued 18.92 Billion in 2023 to USD 36.42 Billion by 2033.
Global animal growth promoters and performance enhancers market is growing at a CAGR of 6.77% during the forecast period 2024-2033.
The global animal growth promoters and performance enhancers market has been segmented based on type, animal type, and regions. Non-antibiotic led the market in 2023 in the type segment. Poultry led the market in 2023 in the animal type segment.
Asia Pacific region emerged as the largest market for the animal growth promoters and performance enhancers.
The market's growth will be influenced by the growing usage of animal growth promoters and performance enhancers in production of feed.
The adverse effects can hamper the market growth.
The increasing demand for animal protein are providing huge opportunities to the market.
1. Introduction
1.1. Objectives of the Study
1.2. Market Definition
1.3. Research Scope
1.4. Currency
1.5. Key Target Audience
2. Research Methodology and Assumptions
3. Executive Summary
4. Premium Insights
4.1. Porter’s Five Forces Analysis
4.2. Value Chain Analysis
4.3. Top Investment Pockets
4.3.1. Market Attractiveness Analysis by Type
4.3.2. Market Attractiveness Analysis by Animal Type
4.3.3. Market Attractiveness Analysis by Region
4.4. Industry Trends
5. Market Dynamics
5.1. Market Evaluation
5.2. Drivers
5.2.1. Increasing use of animal growth promoters and performance enhancers
5.3. Restraints
5.3.1. Adverse effects
5.4. Opportunities
5.4.1. Increasing investment in natural growth promoters
5.5. Challenges
5.5.1. Stringent regulations
6. Global Animal Growth Promoters and Performance Enhancers Market Analysis and Forecast, By Type
6.1. Segment Overview
6.2. Antibiotic
6.3. Non-Antibiotic
6.3.1. Feed Enzyme
6.3.2. Probiotic
6.3.3. Organic Acid
6.3.4. Prebiotic
6.3.5. Hormonal Growth Promoters
6.3.6. Phytogenic
6.3.7. Others
7. Global Animal Growth Promoters and Performance Enhancers Market Analysis and Forecast, By Animal Type
7.1. Segment Overview
7.2. Porcine
7.3. Poultry
7.4. Equine
7.5. Livestock
7.6. Others
8. Global Animal Growth Promoters and Performance Enhancers Market Analysis and Forecast, By Regional Analysis
8.1. Segment Overview
8.2. North America
8.2.1. U.S.
8.2.2. Canada
8.2.3. Mexico
8.3. Europe
8.3.1. Germany
8.3.2. France
8.3.3. U.K.
8.3.4. Italy
8.3.5. Spain
8.4. Asia-Pacific
8.4.1. Japan
8.4.2. China
8.4.3. India
8.5. South America
8.5.1. Brazil
8.6. Middle East and Africa
8.6.1. UAE
8.6.2. South Africa
9. Global Animal Growth Promoters and Performance Enhancers Market-Competitive Landscape
9.1. Overview
9.2. Market Share of Key Players in the Animal Growth Promoters and Performance Enhancers Market
9.2.1. Global Company Market Share
9.2.2. North America Company Market Share
9.2.3. Europe Company Market Share
9.2.4. APAC Company Market Share
9.3. Competitive Situations and Trends
9.3.1. Product Launches and Developments
9.3.2. Partnerships, Collaborations, and Agreements
9.3.3. Mergers & Acquisitions
9.3.4. Expansions
10. Company Profiles
10.1. BASF SE
10.1.1. Business Overview
10.1.2. Company Snapshot
10.1.3. Company Market Share Analysis
10.1.4. Company Product Portfolio
10.1.5. Recent Developments
10.1.6. SWOT Analysis
10.2. Chr. Hansen Holding A/S
10.2.1. Business Overview
10.2.2. Company Snapshot
10.2.3. Company Market Share Analysis
10.2.4. Company Product Portfolio
10.2.5. Recent Developments
10.2.6. SWOT Analysis
10.3. Cargill
10.3.1. Business Overview
10.3.2. Company Snapshot
10.3.3. Company Market Share Analysis
10.3.4. Company Product Portfolio
10.3.5. Recent Developments
10.3.6. SWOT Analysis
10.4. DuPont
10.4.1. Business Overview
10.4.2. Company Snapshot
10.4.3. Company Market Share Analysis
10.4.4. Company Product Portfolio
10.4.5. Recent Developments
10.4.6. SWOT Analysis
10.5. Vetoquinol Group
10.5.1. Business Overview
10.5.2. Company Snapshot
10.5.3. Company Market Share Analysis
10.5.4. Company Product Portfolio
10.5.5. Recent Developments
10.5.6. SWOT Analysis
10.6. Bayer AG
10.6.1. Business Overview
10.6.2. Company Snapshot
10.6.3. Company Market Share Analysis
10.6.4. Company Product Portfolio
10.6.5. Recent Developments
10.6.6. SWOT Analysis
10.7. Novus International
10.7.1. Business Overview
10.7.2. Company Snapshot
10.7.3. Company Market Share Analysis
10.7.4. Company Product Portfolio
10.7.5. Recent Developments
10.7.6. SWOT Analysis
10.8. Merck Sharp & Dohme Corp.
10.8.1. Business Overview
10.8.2. Company Snapshot
10.8.3. Company Market Share Analysis
10.8.4. Company Product Portfolio
10.8.5. Recent Developments
10.8.6. SWOT Analysis
10.9. Boehringer Ingelheim International GmbH
10.9.1. Business Overview
10.9.2. Company Snapshot
10.9.3. Company Market Share Analysis
10.9.4. Company Product Portfolio
10.9.5. Recent Developments
10.9.6. SWOT Analysis
10.10. Bupo Animal Health Ltd
10.10.1. Business Overview
10.10.2. Company Snapshot
10.10.3. Company Market Share Analysis
10.10.4. Company Product Portfolio
10.10.5. Recent Developments
10.10.6. SWOT Analysis
10.11. ERBER AG
10.11.1. Business Overview
10.11.2. Company Snapshot
10.11.3. Company Market Share Analysis
10.11.4. Company Product Portfolio
10.11.5. Recent Developments
10.11.6. SWOT Analysis
10.12. Alltech
10.12.1. Business Overview
10.12.2. Company Snapshot
10.12.3. Company Market Share Analysis
10.12.4. Company Product Portfolio
10.12.5. Recent Developments
10.12.6. SWOT Analysis
10.13. Elanco
10.13.1. Business Overview
10.13.2. Company Snapshot
10.13.3. Company Market Share Analysis
10.13.4. Company Product Portfolio
10.13.5. Recent Developments
10.13.6. SWOT Analysis
10.14. Novozymes
10.14.1. Business Overview
10.14.2. Company Snapshot
10.14.3. Company Market Share Analysis
10.14.4. Company Product Portfolio
10.14.5. Recent Developments
10.14.6. SWOT Analysis
10.15. Zoetis
10.15.1. Business Overview
10.15.2. Company Snapshot
10.15.3. Company Market Share Analysis
10.15.4. Company Product Portfolio
10.15.5. Recent Developments
10.15.6. SWOT Analysis
10.16. Protexin
10.16.1. Business Overview
10.16.2. Company Snapshot
10.16.3. Company Market Share Analysis
10.16.4. Company Product Portfolio
10.16.5. Recent Developments
10.16.6. SWOT Analysis
10.17. MSPrebiotics Inc.
10.17.1. Business Overview
10.17.2. Company Snapshot
10.17.3. Company Market Share Analysis
10.17.4. Company Product Portfolio
10.17.5. Recent Developments
10.17.6. SWOT Analysis
10.18. BENEO
10.18.1. Business Overview
10.18.2. Company Snapshot
10.18.3. Company Market Share Analysis
10.18.4. Company Product Portfolio
10.18.5. Recent Developments
10.18.6. SWOT Analysis
10.19. Royal DSM
10.19.1. Business Overview
10.19.2. Company Snapshot
10.19.3. Company Market Share Analysis
10.19.4. Company Product Portfolio
10.19.5. Recent Developments
10.19.6. SWOT Analysis
List of Table
1. Global Animal Growth Promoters and Performance Enhancers Market, By Type, 2020-2033 (USD Billion)
2. Global Antibiotic, Animal Growth Promoters and Performance Enhancers Market, By Region, 2020-2033 (USD Billion)
3. Global Non-Antibiotic, Animal Growth Promoters and Performance Enhancers Market, By Region, 2020-2033 (USD Billion)
4. Global Animal Growth Promoters and Performance Enhancers Market, By Animal Type, 2020-2033 (USD Billion)
5. Global Porcine, Animal Growth Promoters and Performance Enhancers Market, By Region, 2020-2033 (USD Billion)
6. Global Poultry, Animal Growth Promoters and Performance Enhancers Market, By Region, 2020-2033 (USD Billion)
7. Global Equine, Animal Growth Promoters and Performance Enhancers Market, By Region, 2020-2033 (USD Billion)
8. Global Livestock, Animal Growth Promoters and Performance Enhancers Market, By Region, 2020-2033 (USD Billion)
9. Global Others, Animal Growth Promoters and Performance Enhancers Market, By Region, 2020-2033 (USD Billion)
10. Global Animal Growth Promoters and Performance Enhancers Market, By Region, 2020-2033 (USD Billion)
11. North America Animal Growth Promoters and Performance Enhancers Market, By Type, 2020-2033 (USD Billion)
12. North America Animal Growth Promoters and Performance Enhancers Market, By Animal Type, 2020-2033 (USD Billion)
13. U.S. Animal Growth Promoters and Performance Enhancers Market, By Type, 2020-2033 (USD Billion)
14. U.S. Animal Growth Promoters and Performance Enhancers Market, By Animal Type, 2020-2033 (USD Billion)
15. Canada Animal Growth Promoters and Performance Enhancers Market, By Type, 2020-2033 (USD Billion)
16. Canada Animal Growth Promoters and Performance Enhancers Market, By Animal Type, 2020-2033 (USD Billion)
17. Mexico Animal Growth Promoters and Performance Enhancers Market, By Type, 2020-2033 (USD Billion)
18. Mexico Animal Growth Promoters and Performance Enhancers Market, By Animal Type, 2020-2033 (USD Billion)
19. Europe Animal Growth Promoters and Performance Enhancers Market, By Type, 2020-2033 (USD Billion)
20. Europe Animal Growth Promoters and Performance Enhancers Market, By Animal Type, 2020-2033 (USD Billion)
21. Germany Animal Growth Promoters and Performance Enhancers Market, By Type, 2020-2033 (USD Billion)
22. Germany Animal Growth Promoters and Performance Enhancers Market, By Animal Type, 2020-2033 (USD Billion)
23. France Animal Growth Promoters and Performance Enhancers Market, By Type, 2020-2033 (USD Billion)
24. France Animal Growth Promoters and Performance Enhancers Market, By Animal Type, 2020-2033 (USD Billion)
25. U.K. Animal Growth Promoters and Performance Enhancers Market, By Type, 2020-2033 (USD Billion)
26. U.K. Animal Growth Promoters and Performance Enhancers Market, By Animal Type, 2020-2033 (USD Billion)
27. Italy Animal Growth Promoters and Performance Enhancers Market, By Type, 2020-2033 (USD Billion)
28. Italy Animal Growth Promoters and Performance Enhancers Market, By Animal Type, 2020-2033 (USD Billion)
29. Spain Animal Growth Promoters and Performance Enhancers Market, By Type, 2020-2033 (USD Billion)
30. Spain Animal Growth Promoters and Performance Enhancers Market, By Animal Type, 2020-2033 (USD Billion)
31. Asia Pacific Animal Growth Promoters and Performance Enhancers Market, By Type, 2020-2033 (USD Billion)
32. Asia Pacific Animal Growth Promoters and Performance Enhancers Market, By Animal Type, 2020-2033 (USD Billion)
33. Japan Animal Growth Promoters and Performance Enhancers Market, By Type, 2020-2033 (USD Billion)
34. Japan Animal Growth Promoters and Performance Enhancers Market, By Animal Type, 2020-2033 (USD Billion)
35. China Animal Growth Promoters and Performance Enhancers Market, By Type, 2020-2033 (USD Billion)
36. China Animal Growth Promoters and Performance Enhancers Market, By Animal Type, 2020-2033 (USD Billion)
37. India Animal Growth Promoters and Performance Enhancers Market, By Type, 2020-2033 (USD Billion)
38. India Animal Growth Promoters and Performance Enhancers Market, By Animal Type, 2020-2033 (USD Billion)
39. South America Animal Growth Promoters and Performance Enhancers Market, By Type, 2020-2033 (USD Billion)
40. South America Animal Growth Promoters and Performance Enhancers Market, By Animal Type, 2020-2033 (USD Billion)
41. Brazil Animal Growth Promoters and Performance Enhancers Market, By Type, 2020-2033 (USD Billion)
42. Brazil Animal Growth Promoters and Performance Enhancers Market, By Animal Type, 2020-2033 (USD Billion)
43. Middle East and Africa Animal Growth Promoters and Performance Enhancers Market, By Type, 2020-2033 (USD Billion)
44. Middle East and Africa Animal Growth Promoters and Performance Enhancers Market, By Animal Type, 2020-2033 (USD Billion)
45. UAE Animal Growth Promoters and Performance Enhancers Market, By Type, 2020-2033 (USD Billion)
46. UAE Animal Growth Promoters and Performance Enhancers Market, By Animal Type, 2020-2033 (USD Billion)
47. South Africa Animal Growth Promoters and Performance Enhancers Market, By Type, 2020-2033 (USD Billion)
48. South Africa Animal Growth Promoters and Performance Enhancers Market, By Animal Type, 2020-2033 (USD Billion)
List of Figures
1. Global Animal Growth Promoters and Performance Enhancers Market Segmentation
2. Animal Growth Promoters and Performance Enhancers Market: Research Methodology
3. Market Size Estimation Methodology: Bottom-Up Approach
4. Market Size Estimation Methodology: Top-Down Approach
5. Data Triangulation
6. Porter’s Five Forces Analysis
7. Value Chain Analysis
8. Global Animal Growth Promoters and Performance Enhancers Market Attractiveness Analysis by Type
9. Global Animal Growth Promoters and Performance Enhancers Market Attractiveness Analysis by Animal Type
10. Global Animal Growth Promoters and Performance Enhancers Market Attractiveness Analysis by Region
11. Global Animal Growth Promoters and Performance Enhancers Market: Dynamics
12. Global Animal Growth Promoters and Performance Enhancers Market Share by Type (2023 & 2033)
13. Global Animal Growth Promoters and Performance Enhancers Market Share by Animal Type (2023 & 2033)
14. Global Animal Growth Promoters and Performance Enhancers Market Share by Regions (2023 & 2033)
15. Global Animal Growth Promoters and Performance Enhancers Market Share by Company (2023)
This study forecasts revenue at global, regional, and country levels from 2020 to 2033. The Brainy Insights has segmented the global animal growth promoters and performance enhancers market based on below mentioned segments:
Global Animal Growth Promoters and Performance Enhancers Market by Type:
Global Animal Growth Promoters and Performance Enhancers Market by Animal Type:
Global Animal Growth Promoters and Performance Enhancers Market by Region:
Research has its special purpose to undertake marketing efficiently. In this competitive scenario, businesses need information across all industry verticals; the information about customer wants, market demand, competition, industry trends, distribution channels etc. This information needs to be updated regularly because businesses operate in a dynamic environment. Our organization, The Brainy Insights incorporates scientific and systematic research procedures in order to get proper market insights and industry analysis for overall business success. The analysis consists of studying the market from a miniscule level wherein we implement statistical tools which helps us in examining the data with accuracy and precision.
Our research reports feature both; quantitative and qualitative aspects for any market. Qualitative information for any market research process are fundamental because they reveal the customer needs and wants, usage and consumption for any product/service related to a specific industry. This in turn aids the marketers/investors in knowing certain perceptions of the customers. Qualitative research can enlighten about the different product concepts and designs along with unique service offering that in turn, helps define marketing problems and generate opportunities. On the other hand, quantitative research engages with the data collection process through interviews, e-mail interactions, surveys and pilot studies. Quantitative aspects for the market research are useful to validate the hypotheses generated during qualitative research method, explore empirical patterns in the data with the help of statistical tools, and finally make the market estimations.
The Brainy Insights offers comprehensive research and analysis, based on a wide assortment of factual insights gained through interviews with CXOs and global experts and secondary data from reliable sources. Our analysts and industry specialist assume vital roles in building up statistical tools and analysis models, which are used to analyse the data and arrive at accurate insights with exceedingly informative research discoveries. The data provided by our organization have proven precious to a diverse range of companies, facilitating them to address issues such as determining which products/services are the most appealing, whether or not customers use the product in the manner anticipated, the purchasing intentions of the market and many others.
Our research methodology encompasses an idyllic combination of primary and secondary initiatives. Key phases involved in this process are listed below:

The phase involves the gathering and collecting of market data and its related information with the help of different sources & research procedures.

The data procurement stage involves in data gathering and collecting through various data sources.
This stage involves in extensive research. These data sources includes:
Purchased Database: Purchased databases play a crucial role in estimating the market sizes irrespective of the domain. Our purchased database includes:
Primary Research: The Brainy Insights interacts with leading companies and experts of the concerned domain to develop the analyst team’s market understanding and expertise. It improves and substantiates every single data presented in the market reports. Primary research mainly involves in telephonic interviews, E-mail interactions and face-to-face interviews with the raw material providers, manufacturers/producers, distributors, & independent consultants. The interviews that we conduct provides valuable data on market size and industry growth trends prevailing in the market. Our organization also conducts surveys with the various industry experts in order to gain overall insights of the industry/market. For instance, in healthcare industry we conduct surveys with the pharmacists, doctors, surgeons and nurses in order to gain insights and key information of a medical product/device/equipment which the customers are going to usage. Surveys are conducted in the form of questionnaire designed by our own analyst team. Surveys plays an important role in primary research because surveys helps us to identify the key target audiences of the market. Additionally, surveys helps to identify the key target audience engaged with the market. Our survey team conducts the survey by targeting the key audience, thus gaining insights from them. Based on the perspectives of the customers, this information is utilized to formulate market strategies. Moreover, market surveys helps us to understand the current competitive situation of the industry. To be precise, our survey process typically involve with the 360 analysis of the market. This analytical process begins by identifying the prospective customers for a product or service related to the market/industry to obtain data on how a product/service could fit into customers’ lives.

Secondary Research: The secondary data sources includes information published by the on-profit organizations such as World bank, WHO, company fillings, investor presentations, annual reports, national government documents, statistical databases, blogs, articles, white papers and others. From the annual report, we analyse a company’s revenue to understand the key segment and market share of that organization in a particular region. We analyse the company websites and adopt the product mapping technique which is important for deriving the segment revenue. In the product mapping method, we select and categorize the products offered by the companies catering to domain specific market, deduce the product revenue for each of the companies so as to get overall estimation of the market size. We also source data and analyses trends based on information received from supply side and demand side intermediaries in the value chain. The supply side denotes the data gathered from supplier, distributor, wholesaler and the demand side illustrates the data gathered from the end customers for respective market domain.

The supply side for a domain specific market is analysed by:
The demand side for the market is estimated through:
In-house Library: Apart from these third-party sources, we have our in-house library of qualitative and quantitative information. Our in-house database includes market data for various industry and domains. These data are updated on regular basis as per the changing market scenario. Our library includes, historic databases, internal audit reports and archives.
Sometimes there are instances where there is no metadata or raw data available for any domain specific market. For those cases, we use our expertise to forecast and estimate the market size in order to generate comprehensive data sets. Our analyst team adopt a robust research technique in order to produce the estimates:
Data Synthesis: This stage involves the analysis & mapping of all the information obtained from the previous step. It also involves in scrutinizing the data for any discrepancy observed while data gathering related to the market. The data is collected with consideration to the heterogeneity of sources. Robust scientific techniques are in place for synthesizing disparate data sets and provide the essential contextual information that can orient market strategies. The Brainy Insights has extensive experience in data synthesis where the data passes through various stages:


Market Deduction & Formulation: The final stage comprises of assigning data points at appropriate market spaces so as to deduce feasible conclusions. Analyst perspective & subject matter expert based holistic form of market sizing coupled with industry analysis also plays a crucial role in this stage.
This stage involves in finalization of the market size and numbers that we have collected from data integration step. With data interpolation, it is made sure that there is no gap in the market data. Successful trend analysis is done by our analysts using extrapolation techniques, which provide the best possible forecasts for the market.
Data Validation & Market Feedback: Validation is the most important step in the process. Validation & re-validation via an intricately designed process helps us finalize data-points to be used for final calculations.

The Brainy Insights interacts with leading companies and experts of the concerned domain to develop the analyst team’s market understanding and expertise. It improves and substantiates every single data presented in the market reports. The data validation interview and discussion panels are typically composed of the most experienced industry members. The participants include, however, are not limited to:
Moreover, we always validate our data and findings through primary respondents from all the major regions we are working on.


Free Customization
Fortune 500 Clients
Free Yearly Update On Purchase Of Multi/Corporate License
Companies Served Till Date