- +1-315-215-1633
- sales@thebrainyinsights.com

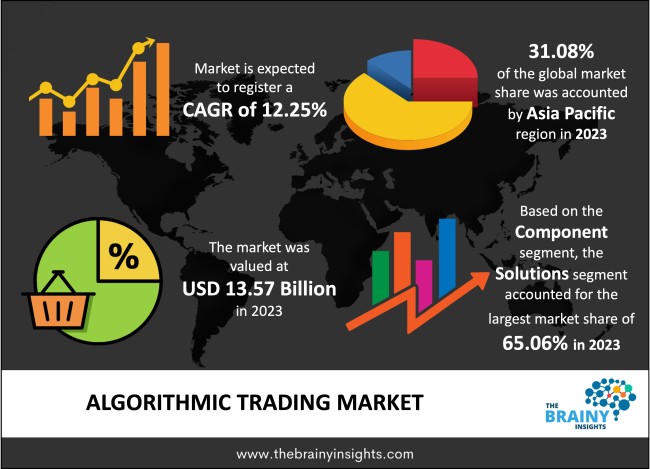
The global algorithmic trading market was valued at USD 13.57 billion in 2023 and grew at a CAGR of 12.25% from 2024 to 2033. The market is expected to reach USD 43.08 billion by 2033. The growth of algorithmic trading can be attributed to the rise in different traders across regions. Traders can track their portfolios and monitor market activities using algorithmic trading. Automation reduces the need for human work, which reduces the chances of mistakes & inefficiencies. Algorithms can offer better risk management and can handle multiple assets very easily.
The technique of employing computers designed to follow a specific set of instructions for placing a trade to earn profits at a pace and frequency impractical for a human trader is known as algorithmic trading. Any algorithmic trading strategy must find a profitable opportunity to increase earnings or decrease costs. The algorithmic trading techniques are based on price, timing, mathematical model, and quantity and adhere to predetermined rules. In the world of online trading, algorithms are becoming more and more popular, and many large clients use these technologies. These mathematical algorithms examine each quote and trade made on the stock market, look for possibilities for liquidity, and use the data to make wise trading decisions. Investment managers can take charge of their trading procedures due to algorithmic trading, also known as computer-directed trading, which lowers transaction costs. Algorithmic trading systems maintain transparency by providing detailed records of trade execution. Also, traders can easily participate in multiple markets across different time zones using these algorithms. These algorithms can handle large data sets and trade very easily, boosting trading activities. These algorithms can help firms utilize their resources efficiently, which will result in scaling their operations without increasing the cost.
Get an overview of this study by requesting a free sample
Benefits of algorithmic trading: Large investors and dealers can handle their trading in a massive number of transactions owing to the use of algorithmic trading. Executing buying and selling orders at precise times in the stock market uses computerized programming or formulae. It is used to carry out a sizable number of commands without the assistance of people. Algorithmic trading aims to execute several deals to make significant, fast profits from the cryptocurrency, stock, and forex markets. The primary advantage of algorithmic trading is the speed with which trading can be done. The orders are carried out in a fraction of a second, which is impossible for a human to do, and at such speed and accuracy, the trade can be carried out at the correct price. Algorithmic trading enables the use of various indicators and the execution of orders that are impossible for a human to perform. Additionally, traders have more possibilities to trade when analysis and execution are faster.
High cost of setting infrastructure: If the customer plans to execute several trade orders each day, algorithmic trading is cost-effective in the long run. However, the infrastructure for algorithmic trading is expensive to put up initially. Algorithmic traders want to have the quickest computers possible to execute trades quickly. The cost of such computers and the required hardware is high, restraining the market's growth.
Rising adoption of digitalizing among traders: Digitalization is a boom in a marketplace where companies seek increased innovation in the purchasing and delivery of shares to reduce costs while still looking for the ability to provide efficiency to their shareholders and stakeholders in a timely manner fashion. Many digitalization solutions in the share and commodity trading market aim to provide a single online destination combining innovative technology with comprehensive real-time analytics, insights, news, statements and transactional features, including straight-through processing of common investor maintenance transactions. In addition to this, companies are adopting the automation approach to transition the daily data. The automated process ensures a seamless experience for the company and investors. Thus, rising digitization in the equity market will give vendors more opportunities over the forecast period.
The regions analyzed for the market include North America, Europe, South America, Asia Pacific, the Middle East, and Africa. North America emerged as the largest market for the global algorithmic trading market, with a 31.08% market revenue share in 2023.
North American region will account for the largest market share with revenue growth. Nations such as U.S. and Canada have a tremendous demand for algorithmic trading among different end-users, which will expand the market enormously. The end-users are investing in algorithmic trading to gain more capital quickly. The rise in government investment is further fuelling the market growth.
Asia Pacific Region Algorithmic Trading Market Share in 2023 - 31.08%
www.thebrainyinsights.com
Check the geographical analysis of this market by requesting a free sample
The deployment mode segment is divided into cloud and on-premises. The cloud segment dominated the market, with a share of around 63.20% in 2023. Cloud-based algorithmic trading is popular among end-users such as retail and institutional investors. Cloud-based model is beneficial in many ways, including their low cost, broad accessibility and high scalability.
The component segment is divided into services and solutions. The services segment is further categorized into managed services and professional services. The solutions segment further consists of software and platforms. The solutions segment dominated the market, with a share of around 65.06% in 2023. The algorithmic trading solution offers a large pool of features and an efficient platform for traders. The tools and platforms help in formulating trading strategies and help in efficiently managing the portfolio.
The trading type segment is divided into stock markets, exchange-traded funds, foreign exchange, cryptocurrencies, bonds, and others. The exchange-traded fund's segment dominated the market, with a share of around 32.97% in 2023. Exchange-traded funds are pooled investments that work similarly to mutual funds. These funds usually follow an index, particular sector and commodity. Anything from the price of a single commodity to a sizable and varied group of securities can be tracked by an ETF.
The end-users segment is divided into short-term traders, long-term traders, retail investors and institutional investors. The institutional investor segment dominated the market, with a share of around 46.86% in 2023. Institutional investors typically have teams working independently, studying every facet of the markets they trade in. Compared to regular investors, these entities have high levels of trustworthiness and solvency.
| Attribute | Description |
|---|---|
| Market Size | Revenue (USD Billion) |
| Market size value in 2023 | USD 13.57 Billion |
| Market size value in 2033 | USD 43.08 Billion |
| CAGR (2024 to 2033) | 12.25% |
| Historical data | 2020-2022 |
| Base Year | 2023 |
| Forecast | 2024-2033 |
| Region | The regions analyzed for the market are Asia Pacific, Europe, South America, North America, and Middle East & Africa. Furthermore, the regions are further analyzed at the country level. |
| Segments | Deployment, Component, Trading Types and End-users |
As per The Brainy Insights, the size of the algorithmic trading market was valued USD 13.57 Billion in 2023 to USD 43.08 Billion by 2033.
Global algorithmic trading market is growing at a CAGR of 12.25% during the forecast period 2024-2033.
North America region emerged as the largest market for the algorithmic trading.
The market's growth will be influenced by the growing demand for effective and fast execution of trading orders.
The lack of accuracy could hamper the market growth.
The increasing imposition of artificial intelligence and algorithms is providing huge opportunities to the market.
1. Introduction
1.1. Objectives of the Study
1.2. Market Definition
1.3. Research Scope
1.4. Currency
1.5. Key Target Audience
2. Research Methodology and Assumptions
3. Executive Summary
4. Premium Insights
4.1. Porter’s Five Forces Analysis
4.2. Value Chain Analysis
4.3. Top Investment Pockets
4.3.1. Market Attractiveness Analysis by Deployment Mode
4.3.2. Market Attractiveness Analysis by Component
4.3.3. Market Attractiveness Analysis by Trading Type
4.3.4. Market Attractiveness Analysis by End-users
4.3.5. Market Attractiveness Analysis by Region
4.4. Industry Trends
5. Market Dynamics
5.1. Market Evaluation
5.2. Drivers
5.2.1. Increasing use of algorithmic trading among various end-user
5.3. Restraints
5.3.1. High cost of installation
5.4. Opportunities
5.4.1. Increasing investment in AI and ML industry
5.5. Challenges
5.5.1. Stringent regulations
6. Global Algorithmic Trading Market Analysis and Forecast, By Deployment Mode
6.1. Segment Overview
6.2. Cloud
6.3. On-Premises
7. Global Algorithmic Trading Market Analysis and Forecast, By Component
7.1. Segment Overview
7.2. Services
7.2.1. Managed Services
7.2.2. Professional Service
7.3. Solutions
7.3.1. Software
7.3.2. Platform
8. Global Algorithmic Trading Market Analysis and Forecast, By Trading Type
8.1. Segment Overview
8.2. Stock Markets
8.3. Exchange Traded Funds
8.4. Foreign Exchange
8.5. Cryptocurrencies
8.6. Bonds
8.7. Others
9. Global Algorithmic Trading Market Analysis and Forecast, By End-users
9.1. Segment Overview
9.2. Short-Term Traders
9.3. Long-Term Traders
9.4. Retail Investors
9.5. Institutional Investors
10. Global Algorithmic Trading Market Analysis and Forecast, By Regional Analysis
10.1. Segment Overview
10.2. North America
10.2.1. U.S.
10.2.2. Canada
10.2.3. Mexico
10.3. Europe
10.3.1. Germany
10.3.2. France
10.3.3. U.K.
10.3.4. Italy
10.3.5. Spain
10.4. Asia-Pacific
10.4.1. Japan
10.4.2. China
10.4.3. India
10.5. South America
10.5.1. Brazil
10.6. Middle East and Africa
10.6.1. UAE
10.6.2. South Africa
11. Global Algorithmic Trading Market-Competitive Landscape
11.1. Overview
11.2. Market Share of Key Players in the Algorithmic Trading Market
11.2.1. Global Company Market Share
11.2.2. North America Company Market Share
11.2.3. Europe Company Market Share
11.2.4. APAC Company Market Share
11.3. Competitive Situations and Trends
11.3.1. Product Launches and Developments
11.3.2. Partnerships, Collaborations, and Agreements
11.3.3. Mergers & Acquisitions
11.3.4. Expansions
12. Company Profiles
12.1. 63 Moons Technologies Limited
12.1.1. Business Overview
12.1.2. Company Snapshot
12.1.3. Company Market Share Analysis
12.1.4. Company Product Portfolio
12.1.5. Recent Developments
12.1.6. SWOT Analysis
12.2. Argo Software Engineering
12.2.1. Business Overview
12.2.2. Company Snapshot
12.2.3. Company Market Share Analysis
12.2.4. Company Product Portfolio
12.2.5. Recent Developments
12.2.6. SWOT Analysis
12.3. AlgoTrader
12.3.1. Business Overview
12.3.2. Company Snapshot
12.3.3. Company Market Share Analysis
12.3.4. Company Product Portfolio
12.3.5. Recent Developments
12.3.6. SWOT Analysis
12.4. InfoReach, Inc.
12.4.1. Business Overview
12.4.2. Company Snapshot
12.4.3. Company Market Share Analysis
12.4.4. Company Product Portfolio
12.4.5. Recent Developments
12.4.6. SWOT Analysis
12.5. MetaQuotes Ltd.
12.5.1. Business Overview
12.5.2. Company Snapshot
12.5.3. Company Market Share Analysis
12.5.4. Company Product Portfolio
12.5.5. Recent Developments
12.5.6. SWOT Analysis
12.6. Kuberre Systems, Inc.
12.6.1. Business Overview
12.6.2. Company Snapshot
12.6.3. Company Market Share Analysis
12.6.4. Company Product Portfolio
12.6.5. Recent Developments
12.6.6. SWOT Analysis
12.7. Refinitiv
12.7.1. Business Overview
12.7.2. Company Snapshot
12.7.3. Company Market Share Analysis
12.7.4. Company Product Portfolio
12.7.5. Recent Developments
12.7.6. SWOT Analysis
12.8. Tata Consultancy Services Limited
12.8.1. Business Overview
12.8.2. Company Snapshot
12.8.3. Company Market Share Analysis
12.8.4. Company Product Portfolio
12.8.5. Recent Developments
12.8.6. SWOT Analysis
12.9. Symphony
12.9.1. Business Overview
12.9.2. Company Snapshot
12.9.3. Company Market Share Analysis
12.9.4. Company Product Portfolio
12.9.5. Recent Developments
12.9.6. SWOT Analysis
12.10. Thomson Reuters
12.10.1. Business Overview
12.10.2. Company Snapshot
12.10.3. Company Market Share Analysis
12.10.4. Company Product Portfolio
12.10.5. Recent Developments
12.10.6. SWOT Analysis
12.11. VIRTU Finance Inc.
12.11.1. Business Overview
12.11.2. Company Snapshot
12.11.3. Company Market Share Analysis
12.11.4. Company Product Portfolio
12.11.5. Recent Developments
12.11.6. SWOT Analysis
12.12. Quant Core Capital Management
12.12.1. Business Overview
12.12.2. Company Snapshot
12.12.3. Company Market Share Analysis
12.12.4. Company Product Portfolio
12.12.5. Recent Developments
12.12.6. SWOT Analysis
12.13. uTrade
12.13.1. Business Overview
12.13.2. Company Snapshot
12.13.3. Company Market Share Analysis
12.13.4. Company Product Portfolio
12.13.5. Recent Developments
12.13.6. SWOT Analysis
12.14. Vela
12.14.1. Business Overview
12.14.2. Company Snapshot
12.14.3. Company Market Share Analysis
12.14.4. Company Product Portfolio
12.14.5. Recent Developments
12.14.6. SWOT Analysis
List of Table
1. Global Algorithmic Trading Market, By Deployment Mode, 2020-2033 (USD Billion)
2. Global Cloud, Algorithmic Trading Market, By Region, 2020-2033 (USD Billion)
3. Global On-Premises, Algorithmic Trading Market, By Region, 2020-2033 (USD Billion)
4. Global Algorithmic Trading Market, By Component, 2020-2033 (USD Billion)
5. Global Services, Algorithmic Trading Market, By Region, 2020-2033 (USD Billion)
6. Global Solution, Algorithmic Trading Market, By Region, 2020-2033 (USD Billion)
7. Global Algorithmic Trading Market, By Trading Type, 2020-2033 (USD Billion)
8. Global Stock Markets, Algorithmic Trading Market, By Region, 2020-2033 (USD Billion)
9. Global Exchange Traded Funds, Algorithmic Trading Market, By Region, 2020-2033 (USD Billion)
10. Global Foreign Exchange, Algorithmic Trading Market, By Region, 2020-2033 (USD Billion)
11. Global Cryptocurrencies, Algorithmic Trading Market, By Region, 2020-2033 (USD Billion)
12. Global Bonds, Algorithmic Trading Market, By Region, 2020-2033 (USD Billion)
13. Global Others, Algorithmic Trading Market, By Region, 2020-2033 (USD Billion)
14. Global Algorithmic Trading Market, By End-user, 2020-2033 (USD Billion)
15. Global Short-Term Traders, Algorithmic Trading Market, By Region, 2020-2033 (USD Billion)
16. Global Long-Term Traders, Algorithmic Trading Market, By Region, 2020-2033 (USD Billion)
17. Global Retail Investors, Algorithmic Trading Market, By Region, 2020-2033 (USD Billion)
18. Global Institutional Investors, Algorithmic Trading Market, By Region, 2020-2033 (USD Billion)
19. Global Algorithmic Trading Market, By Region, 2020-2033 (USD Billion)
20. North America Algorithmic Trading Market, By Deployment Mode, 2020-2033 (USD Billion)
21. North America Algorithmic Trading Market, By Component, 2020-2033 (USD Billion)
22. North America Algorithmic Trading Market, By Trading Type, 2020-2033 (USD Billion)
23. North America Algorithmic Trading Market, By End-user, 2020-2033 (USD Billion)
24. U.S. Algorithmic Trading Market, By Deployment Mode, 2020-2033 (USD Billion)
25. U.S. Algorithmic Trading Market, By Component, 2020-2033 (USD Billion)
26. U.S. Algorithmic Trading Market, By Trading Type, 2020-2033 (USD Billion)
27. U.S. Algorithmic Trading Market, By End-user, 2020-2033 (USD Billion)
28. Canada Algorithmic Trading Market, By Deployment Mode, 2020-2033 (USD Billion)
29. Canada Algorithmic Trading Market, By Component, 2020-2033 (USD Billion)
30. Canada Algorithmic Trading Market, By Trading Type, 2020-2033 (USD Billion)
31. Canada Algorithmic Trading Market, By End-user, 2020-2033 (USD Billion)
32. Mexico Algorithmic Trading Market, By Deployment Mode, 2020-2033 (USD Billion)
33. Mexico Algorithmic Trading Market, By Component, 2020-2033 (USD Billion)
34. Mexico Algorithmic Trading Market, By Trading Type, 2020-2033 (USD Billion)
35. Mexico Algorithmic Trading Market, By End-user, 2020-2033 (USD Billion)
36. Europe Algorithmic Trading Market, By Deployment Mode, 2020-2033 (USD Billion)
37. Europe Algorithmic Trading Market, By Component, 2020-2033 (USD Billion)
38. Europe Algorithmic Trading Market, By Trading Type, 2020-2033 (USD Billion)
39. Europe Algorithmic Trading Market, By End-user, 2020-2033 (USD Billion)
40. Germany Algorithmic Trading Market, By Deployment Mode, 2020-2033 (USD Billion)
41. Germany Algorithmic Trading Market, By Component, 2020-2033 (USD Billion)
42. Germany Algorithmic Trading Market, By Trading Type, 2020-2033 (USD Billion)
43. Germany Algorithmic Trading Market, By End-user, 2020-2033 (USD Billion)
44. France Algorithmic Trading Market, By Deployment Mode, 2020-2033 (USD Billion)
45. France Algorithmic Trading Market, By Component, 2020-2033 (USD Billion)
46. France Algorithmic Trading Market, By Trading Type, 2020-2033 (USD Billion)
47. France Algorithmic Trading Market, By End-user, 2020-2033 (USD Billion)
48. U.K. Algorithmic Trading Market, By Deployment Mode, 2020-2033 (USD Billion)
49. U.K. Algorithmic Trading Market, By Component, 2020-2033 (USD Billion)
50. U.K. Algorithmic Trading Market, By Trading Type, 2020-2033 (USD Billion)
51. U.K. Algorithmic Trading Market, By End-user, 2020-2033 (USD Billion)
52. Italy Algorithmic Trading Market, By Deployment Mode, 2020-2033 (USD Billion)
53. Italy Algorithmic Trading Market, By Component, 2020-2033 (USD Billion)
54. Italy Algorithmic Trading Market, By Trading Type, 2020-2033 (USD Billion)
55. Italy Algorithmic Trading Market, By End-user, 2020-2033 (USD Billion)
56. Spain Algorithmic Trading Market, By Deployment Mode, 2020-2033 (USD Billion)
57. Spain Algorithmic Trading Market, By Component, 2020-2033 (USD Billion)
58. Spain Algorithmic Trading Market, By Trading Type, 2020-2033 (USD Billion)
59. Spain Algorithmic Trading Market, By End-user, 2020-2033 (USD Billion)
60. Asia Pacific Algorithmic Trading Market, By Deployment Mode, 2020-2033 (USD Billion)
61. Asia Pacific Algorithmic Trading Market, By Component, 2020-2033 (USD Billion)
62. Asia Pacific Algorithmic Trading Market, By Trading Type, 2020-2033 (USD Billion)
63. Asia Pacific Algorithmic Trading Market, By End-user, 2020-2033 (USD Billion)
64. Japan Algorithmic Trading Market, By Deployment Mode, 2020-2033 (USD Billion)
65. Japan Algorithmic Trading Market, By Component, 2020-2033 (USD Billion)
66. Japan Algorithmic Trading Market, By Trading Type, 2020-2033 (USD Billion)
67. Japan Algorithmic Trading Market, By End-user, 2020-2033 (USD Billion)
68. China Algorithmic Trading Market, By Deployment Mode, 2020-2033 (USD Billion)
69. China Algorithmic Trading Market, By Component, 2020-2033 (USD Billion)
70. China Algorithmic Trading Market, By Trading Type, 2020-2033 (USD Billion)
71. China Algorithmic Trading Market, By End-user, 2020-2033 (USD Billion)
72. India Algorithmic Trading Market, By Deployment Mode, 2020-2033 (USD Billion)
73. India Algorithmic Trading Market, By Component, 2020-2033 (USD Billion)
74. India Algorithmic Trading Market, By Trading Type, 2020-2033 (USD Billion)
75. India Algorithmic Trading Market, By End-user, 2020-2033 (USD Billion)
76. South America Algorithmic Trading Market, By Deployment Mode, 2020-2033 (USD Billion)
77. South America Algorithmic Trading Market, By Component, 2020-2033 (USD Billion)
78. South America Algorithmic Trading Market, By Trading Type, 2020-2033 (USD Billion)
79. South America Algorithmic Trading Market, By End-user, 2020-2033 (USD Billion)
80. Brazil Algorithmic Trading Market, By Deployment Mode, 2020-2033 (USD Billion)
81. Brazil Algorithmic Trading Market, By Component, 2020-2033 (USD Billion)
82. Brazil Algorithmic Trading Market, By Trading Type, 2020-2033 (USD Billion)
83. BrazilAlgorithmic Trading Market, By End-user, 2020-2033 (USD Billion)
84. Middle East and Africa Algorithmic Trading Market, By Deployment Mode, 2020-2033 (USD Billion)
85. Middle East and Africa Algorithmic Trading Market, By Component, 2020-2033 (USD Billion)
86. Middle East and Africa Algorithmic Trading Market, By Trading Type, 2020-2033 (USD Billion)
87. Middle East and Africa Algorithmic Trading Market, By End-user, 2020-2033 (USD Billion)
88. UAE Algorithmic Trading Market, By Deployment Mode, 2020-2033 (USD Billion)
89. UAE Algorithmic Trading Market, By Component, 2020-2033 (USD Billion)
90. UAE Algorithmic Trading Market, By Trading Type, 2020-2033 (USD Billion)
91. UAE Algorithmic Trading Market, By End-user, 2020-2033 (USD Billion)
92. South Africa Algorithmic Trading Market, By Deployment Mode, 2020-2033 (USD Billion)
93. South Africa Algorithmic Trading Market, By Component, 2020-2033 (USD Billion)
94. South Africa Algorithmic Trading Market, By Trading Type, 2020-2033 (USD Billion)
95. South Africa Algorithmic Trading Market, By End-user, 2020-2033 (USD Billion)
List of Figures
1. Global Algorithmic Trading Market Segmentation
2. Algorithmic Trading Market: Research Methodology
3. Market Size Estimation Methodology: Bottom-Up Approach
4. Market Size Estimation Methodology: Top-Down Approach
5. Data Triangulation
6. Porter’s Five Forces Analysis
7. Value Chain Analysis
8. Global Algorithmic Trading Market Attractiveness Analysis by Deployment Mode
9. Global Algorithmic Trading Market Attractiveness Analysis by Component
10. Global Algorithmic Trading Market Attractiveness Analysis by Trading Type
11. Global Algorithmic Trading Market Attractiveness Analysis by End-user
12. Global Algorithmic Trading Market Attractiveness Analysis by Region
13. Global Algorithmic Trading Market: Dynamics
14. Global Algorithmic Trading Market Share by Deployment Mode (2023 & 2033)
15. Global Algorithmic Trading Market Share by Component (2023 & 2033)
16. Global Algorithmic Trading Market Share by Trading Type (2023 & 2033)
17. Global Algorithmic Trading Market Share by End-user (2023 & 2033)
18. Global Algorithmic Trading Market Share by Regions (2023 & 2033)
19. Global Algorithmic Trading Market Share by Company (2023)
This study forecasts revenue at global, regional, and country levels from 2019 to 2032. The Brainy Insights has segmented the global algorithmic trading market based on below mentioned segments:
Global Algorithmic Trading Market by Deployment Mode:
Global Algorithmic Trading Market by Components:
Global Algorithmic Trading Market by Trading Types:
Global Algorithmic Trading Market by End-users:
Global Algorithmic Trading Market by Region:
Research has its special purpose to undertake marketing efficiently. In this competitive scenario, businesses need information across all industry verticals; the information about customer wants, market demand, competition, industry trends, distribution channels etc. This information needs to be updated regularly because businesses operate in a dynamic environment. Our organization, The Brainy Insights incorporates scientific and systematic research procedures in order to get proper market insights and industry analysis for overall business success. The analysis consists of studying the market from a miniscule level wherein we implement statistical tools which helps us in examining the data with accuracy and precision.
Our research reports feature both; quantitative and qualitative aspects for any market. Qualitative information for any market research process are fundamental because they reveal the customer needs and wants, usage and consumption for any product/service related to a specific industry. This in turn aids the marketers/investors in knowing certain perceptions of the customers. Qualitative research can enlighten about the different product concepts and designs along with unique service offering that in turn, helps define marketing problems and generate opportunities. On the other hand, quantitative research engages with the data collection process through interviews, e-mail interactions, surveys and pilot studies. Quantitative aspects for the market research are useful to validate the hypotheses generated during qualitative research method, explore empirical patterns in the data with the help of statistical tools, and finally make the market estimations.
The Brainy Insights offers comprehensive research and analysis, based on a wide assortment of factual insights gained through interviews with CXOs and global experts and secondary data from reliable sources. Our analysts and industry specialist assume vital roles in building up statistical tools and analysis models, which are used to analyse the data and arrive at accurate insights with exceedingly informative research discoveries. The data provided by our organization have proven precious to a diverse range of companies, facilitating them to address issues such as determining which products/services are the most appealing, whether or not customers use the product in the manner anticipated, the purchasing intentions of the market and many others.
Our research methodology encompasses an idyllic combination of primary and secondary initiatives. Key phases involved in this process are listed below:

The phase involves the gathering and collecting of market data and its related information with the help of different sources & research procedures.

The data procurement stage involves in data gathering and collecting through various data sources.
This stage involves in extensive research. These data sources includes:
Purchased Database: Purchased databases play a crucial role in estimating the market sizes irrespective of the domain. Our purchased database includes:
Primary Research: The Brainy Insights interacts with leading companies and experts of the concerned domain to develop the analyst team’s market understanding and expertise. It improves and substantiates every single data presented in the market reports. Primary research mainly involves in telephonic interviews, E-mail interactions and face-to-face interviews with the raw material providers, manufacturers/producers, distributors, & independent consultants. The interviews that we conduct provides valuable data on market size and industry growth trends prevailing in the market. Our organization also conducts surveys with the various industry experts in order to gain overall insights of the industry/market. For instance, in healthcare industry we conduct surveys with the pharmacists, doctors, surgeons and nurses in order to gain insights and key information of a medical product/device/equipment which the customers are going to usage. Surveys are conducted in the form of questionnaire designed by our own analyst team. Surveys plays an important role in primary research because surveys helps us to identify the key target audiences of the market. Additionally, surveys helps to identify the key target audience engaged with the market. Our survey team conducts the survey by targeting the key audience, thus gaining insights from them. Based on the perspectives of the customers, this information is utilized to formulate market strategies. Moreover, market surveys helps us to understand the current competitive situation of the industry. To be precise, our survey process typically involve with the 360 analysis of the market. This analytical process begins by identifying the prospective customers for a product or service related to the market/industry to obtain data on how a product/service could fit into customers’ lives.

Secondary Research: The secondary data sources includes information published by the on-profit organizations such as World bank, WHO, company fillings, investor presentations, annual reports, national government documents, statistical databases, blogs, articles, white papers and others. From the annual report, we analyse a company’s revenue to understand the key segment and market share of that organization in a particular region. We analyse the company websites and adopt the product mapping technique which is important for deriving the segment revenue. In the product mapping method, we select and categorize the products offered by the companies catering to domain specific market, deduce the product revenue for each of the companies so as to get overall estimation of the market size. We also source data and analyses trends based on information received from supply side and demand side intermediaries in the value chain. The supply side denotes the data gathered from supplier, distributor, wholesaler and the demand side illustrates the data gathered from the end customers for respective market domain.

The supply side for a domain specific market is analysed by:
The demand side for the market is estimated through:
In-house Library: Apart from these third-party sources, we have our in-house library of qualitative and quantitative information. Our in-house database includes market data for various industry and domains. These data are updated on regular basis as per the changing market scenario. Our library includes, historic databases, internal audit reports and archives.
Sometimes there are instances where there is no metadata or raw data available for any domain specific market. For those cases, we use our expertise to forecast and estimate the market size in order to generate comprehensive data sets. Our analyst team adopt a robust research technique in order to produce the estimates:
Data Synthesis: This stage involves the analysis & mapping of all the information obtained from the previous step. It also involves in scrutinizing the data for any discrepancy observed while data gathering related to the market. The data is collected with consideration to the heterogeneity of sources. Robust scientific techniques are in place for synthesizing disparate data sets and provide the essential contextual information that can orient market strategies. The Brainy Insights has extensive experience in data synthesis where the data passes through various stages:


Market Deduction & Formulation: The final stage comprises of assigning data points at appropriate market spaces so as to deduce feasible conclusions. Analyst perspective & subject matter expert based holistic form of market sizing coupled with industry analysis also plays a crucial role in this stage.
This stage involves in finalization of the market size and numbers that we have collected from data integration step. With data interpolation, it is made sure that there is no gap in the market data. Successful trend analysis is done by our analysts using extrapolation techniques, which provide the best possible forecasts for the market.
Data Validation & Market Feedback: Validation is the most important step in the process. Validation & re-validation via an intricately designed process helps us finalize data-points to be used for final calculations.

The Brainy Insights interacts with leading companies and experts of the concerned domain to develop the analyst team’s market understanding and expertise. It improves and substantiates every single data presented in the market reports. The data validation interview and discussion panels are typically composed of the most experienced industry members. The participants include, however, are not limited to:
Moreover, we always validate our data and findings through primary respondents from all the major regions we are working on.


Free Customization
Fortune 500 Clients
Free Yearly Update On Purchase Of Multi/Corporate License
Companies Served Till Date