- +1-315-215-1633
- sales@thebrainyinsights.com

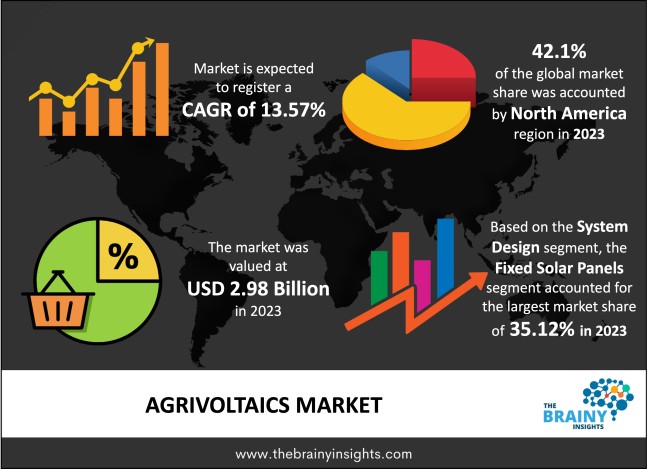
The global Agrivoltaics market was valued at USD 2.98 billion in 2023 and growing at a CAGR of 10.64% from 2024 to 2033. The market is expected to reach USD 10.64 billion by 2033. Varied advancements in farming techniques and increased demand for generating electricity drive the growth of the Agrivoltaics Market. Whereas, increased government initiatives to boost R&D in Agrivoltaics and rising population may drive the growth of the Agrivoltaics Market in the period forecasted.
Agrivoltaics, also known as agrisolar, involves the dual use of land for both agriculture and solar photovoltaic (PV) energy generation. This approach ensures that the land remains productive throughout the year. Additionally, agrivoltaics offers farmers the opportunity to diversify their income while contributing to the reduction of carbon footprints. The synergy between agriculture and solar generation creates a mutually beneficial relationship.
In this method, the photovoltaic panels provide shade, helping to reduce the temperature for the plants. Simultaneously, the plants release water vapor, which cools down the panels from below. This interaction enhances the efficiency of the solar panels. The cooling effect from the plants not only benefits the crops but also improves the performance of the solar energy system. Overall, agrivoltaics demonstrates a harmonious relationship between agriculture and renewable energy production, showcasing a sustainable and integrated approach to land use.
Get an overview of this study by requesting a free sample
Varied advancements in farming techniques– The rapidly growing global population and increasing pressure on crop products act as a major factor that spurs the growth of the Agrivoltaics Market. Catering to this, various advancements in the field of farming techniques prevail. These techniques utilize various techniques relating to sowing, crop protection, and irrigation among others.
High installation costs- The cost of Agrivoltaics rises primarily due to the higher cost of photovoltaic panels. The PV panels and their installation happen to be quite complex, thereby requiring specialized expertise and experience which in turn increases the overall cost of Photovoltaics in the market. For instance, according to NREL (Non-Renewable Energy Laboratory), the installation cost of Photovoltaics/watt ranges between $2.60 to $4.50.
Increased government initiatives to boost R&D in Agrivoltaics- Governments across the globe have undergone tremendous initiatives to boost investments, and increase subsidies in the market. To achieve net-zero carbon emissions the government across the globe is undergoing a renewable fuel-based economy.
The regions analyzed for the market include North America, Europe, South America, Asia Pacific, the Middle East, and Africa. North America emerged as the largest global Agrivoltaics market, accounting for 42.1% of the total market. Owing to increasing technological advancements and rising cutting-edge solutions in the region. Whereas, Asia Pacific accounts for the highest growth rate in the market owing rapidly growing population in the region.
North America Region Agrivoltaics Market Share in 2023 - 42.1%
www.thebrainyinsights.com
Check the geographical analysis of this market by requesting a free sample
Fixed Solar Panels dominated the market segment, with a market share of 35.12% in the global market. Owing to rising demand for the installation of solar panels on agricultural greenhouse fields. Whereas, Dynamic Agrivoltaic is the fastest-growing segment mainly because of the higher response of internal and external factors in the global market.
The Leafy Greens segment has dominated the Agrivoltaics market with a market share of 32% in 2023. Owing to the higher use of sunlight for specific leafy green vegetables, such as Kale, lettuce, peppers, chard, broccoli, and Brussels sprouts among others. Further, this segment is the fastest growing segment in the market, with the rise in population and higher consumption of these vegetables across the globe.
| Attribute | Description |
|---|---|
| Market Size | Revenue (USD Billion) |
| Market size value in 2023 | USD 2.98 Billion |
| Market size value in 2033 | USD 10.64 Billion |
| CAGR (2024 to 2033) | 13.57% |
| Historical data | 2020-2022 |
| Base Year | 2023 |
| Forecast | 2024-2033 |
| Region | The regions analyzed for the market are Asia Pacific, Europe, South America, North America, and Middle East & Africa. Furthermore, the regions are further analyzed at the country level. |
| Segments | System Design, Crop Type |
As per The Brainy Insights, the size of the agrivoltaics market was valued at USD 2.98 billion in 2023 to USD 10.64 billion by 2033.
The global agrivoltaics market is growing at a CAGR of 13.57% during the forecast period 2024-2033.
The North America region emerged as the largest market for the agrivoltaics.
The varied advancements in farming techniques will influence the market's growth.
1. Introduction
1.1. Objectives of the Study
1.2. Market Definition
1.3. Research Scope
1.4. Currency
1.5. Key Target Audience
2. Research Methodology and Assumptions
3. Executive Summary
4. Premium Insights
4.1. Porter’s Five Forces Analysis
4.2. Value Chain Analysis
4.3. Top Investment Pockets
4.3.1. Market Attractiveness Analysis by System Design
4.3.2. Market Attractiveness Analysis by Crop Type
4.3.3. Market Attractiveness Analysis by Region
4.4. Industry Trends
5. Market Dynamics
5.1. Market Evaluation
5.2. Drivers
5.2.1. Varied advancements in farming techniques
5.2.2. Increased demand for generating electricity
5.3. Restraints
5.3.1. High installation costs
5.4. Opportunities
5.4.1. Increased government initiatives to boost R&D in Agrivoltaics
5.4.2. Rising population
5.5. Challenges
5.5.1. Lack of awareness regarding Agrivoltaics systems
6. Global Agrivoltaics Market Analysis and Forecast, By System Design
6.1. Segment Overview
6.2. Dynamic Agrivoltaic
6.3. Fixed Solar Panels
7. Global Agrivoltaics Market Analysis and Forecast, By Crop Type
7.1. Segment Overview
7.2. Fruits
7.3. Leafy Greens
7.4. Root Crops
8. Global Agrivoltaics Market Analysis and Forecast, By Regional Analysis
8.1. Segment Overview
8.2. North America
8.2.1. U.S.
8.2.2. Canada
8.2.3. Mexico
8.3. Europe
8.3.1. Germany
8.3.2. France
8.3.3. U.K.
8.3.4. Italy
8.3.5. Spain
8.4. Asia-Pacific
8.4.1. Japan
8.4.2. China
8.4.3. India
8.5. South America
8.5.1. Brazil
8.6. Middle East and Africa
8.6.1. UAE
8.6.2. South Africa
9. Global Agrivoltaics Market-Competitive Landscape
9.1. Overview
9.2. Market Share of Key Players in Global Agrivoltaics Market
9.2.1. Global Company Market Share
9.2.2. North America Company Market Share
9.2.3. Europe Company Market Share
9.2.4. APAC Company Market Share
9.3. Competitive Situations and Trends
9.3.1. System Design Launches and Developments
9.3.2. Partnerships, Collaborations, and Agreements
9.3.3. Mergers & Acquisitions
9.3.4. Expansions
10. Company Profiles
10.1. Agrivoltaic Solution LLC
10.1.1. Business Overview
10.1.2. Company Snapshot
10.1.3. Company Market Share Analysis
10.1.4. Company System Design Portfolio
10.1.5. Recent Developments
10.1.6. SWOT Analysis
10.2. Sun Agri
10.2.1. Business Overview
10.2.2. Company Snapshot
10.2.3. Company Market Share Analysis
10.2.4. Company System Design Portfolio
10.2.5. Recent Developments
10.2.6. SWOT Analysis
10.3. REM TEC
10.3.1. Business Overview
10.3.2. Company Snapshot
10.3.3. Company Market Share Analysis
10.3.4. Company System Design Portfolio
10.3.5. Recent Developments
10.3.6. SWOT Analysis
10.4. Enel GreenPower
10.4.1. Business Overview
10.4.2. Company Snapshot
10.4.3. Company Market Share Analysis
10.4.4. Company System Design Portfolio
10.4.5. Recent Developments
10.4.6. SWOT Analysis
10.5. Boralex
10.5.1. Business Overview
10.5.2. Company Snapshot
10.5.3. Company Market Share Analysis
10.5.4. Company System Design Portfolio
10.5.5. Recent Developments
10.5.6. SWOT Analysis
10.6. BayWa AG
10.6.1. Business Overview
10.6.2. Company Snapshot
10.6.3. Company Market Share Analysis
10.6.4. Company System Design Portfolio
10.6.5. Recent Developments
10.6.6. SWOT Analysis
10.7. Total Energies
10.7.1. Business Overview
10.7.2. Company Snapshot
10.7.3. Company Market Share Analysis
10.7.4. Company System Design Portfolio
10.7.5. Recent Developments
10.7.6. SWOT Analysis
10.8. Mackin Energy
10.8.1. Business Overview
10.8.2. Company Snapshot
10.8.3. Company Market Share Analysis
10.8.4. Company System Design Portfolio
10.8.5. Recent Developments
10.8.6. SWOT Analysis
10.9. Sunise Power Solutions
10.9.1. Business Overview
10.9.2. Company Snapshot
10.9.3. Company Market Share Analysis
10.9.4. Company System Design Portfolio
10.9.5. Recent Developments
10.9.6. SWOT Analysis
10.10. Suntech Power Holdings
10.10.1. Business Overview
10.10.2. Company Snapshot
10.10.3. Company Market Share Analysis
10.10.4. Company System Design Portfolio
10.10.5. Recent Developments
10.10.6. SWOT Analysis
List of Table
1. Global Agrivoltaics Market, By System Design, 2020-2033 (USD Billion)
2. Global Dynamic Agrivoltaics, Agrivoltaics Market, By Region, 2020-2033 (USD Billion)
3. Global Fixed Solar Panels, Agrivoltaics Market, By Region, 2020-2033 (USD Billion)
4. Global Agrivoltaics Market, By Crop Type, 2020-2033 (USD Billion)
5. Global Fruits, Agrivoltaics Market, By Region, 2020-2033 (USD Billion)
6. Global Leafy Greens, Agrivoltaics Market, By Region, 2020-2033 (USD Billion)
7. Global Root Crops, Agrivoltaics Market, By Region, 2020-2033 (USD Billion)
8. Global Agrivoltaics Market, By Region, 2020-2033 (USD Billion)
9. North America Agrivoltaics Market, By System Design, 2020-2033 (USD Billion)
10. North America Agrivoltaics Market, By Crop Type, 2020-2033 (USD Billion)
11. U.S. Agrivoltaics Market, By System Design, 2020-2033 (USD Billion)
12. U.S. Agrivoltaics Market, By Crop Type, 2020-2033 (USD Billion)
13. Canada Agrivoltaics Market, By System Design, 2020-2033 (USD Billion)
14. Canada Agrivoltaics Market, By Crop Type, 2020-2033 (USD Billion)
15. Mexico Agrivoltaics Market, By System Design, 2020-2033 (USD Billion)
16. Mexico Agrivoltaics Market, By Crop Type, 2020-2033 (USD Billion)
17. Europe Agrivoltaics Market, By System Design, 2020-2033 (USD Billion)
18. Europe Agrivoltaics Market, By Crop Type, 2020-2033 (USD Billion)
19. Germany Agrivoltaics Market, By System Design, 2020-2033 (USD Billion)
20. Germany Agrivoltaics Market, By Crop Type, 2020-2033 (USD Billion)
21. France Agrivoltaics Market, By System Design, 2020-2033 (USD Billion)
22. France Agrivoltaics Market, By Crop Type, 2020-2033 (USD Billion)
23. U.K. Agrivoltaics Market, By System Design, 2020-2033 (USD Billion)
24. U.K. Agrivoltaics Market, By Crop Type, 2020-2033 (USD Billion)
25. Italy Agrivoltaics Market, By System Design, 2020-2033 (USD Billion)
26. Italy Agrivoltaics Market, By Crop Type, 2020-2033 (USD Billion)
27. Spain Agrivoltaics Market, By System Design, 2020-2033 (USD Billion)
28. Spain Agrivoltaics Market, By Crop Type, 2020-2033 (USD Billion)
29. Asia Pacific Agrivoltaics Market, By System Design, 2020-2033 (USD Billion)
30. Asia Pacific Agrivoltaics Market, By Crop Type, 2020-2033 (USD Billion)
31. Japan Agrivoltaics Market, By System Design, 2020-2033 (USD Billion)
32. Japan Agrivoltaics Market, By Crop Type, 2020-2033 (USD Billion)
33. China Agrivoltaics Market, By System Design, 2020-2033 (USD Billion)
34. China Agrivoltaics Market, By Crop Type, 2020-2033 (USD Billion)
35. India Agrivoltaics Market, By System Design, 2020-2033 (USD Billion)
36. India Agrivoltaics Market, By Crop Type, 2020-2033 (USD Billion)
37. South America Agrivoltaics Market, By System Design, 2020-2033 (USD Billion)
38. South America Agrivoltaics Market, By Crop Type, 2020-2033 (USD Billion)
39. Brazil Agrivoltaics Market, By System Design, 2020-2033 (USD Billion)
40. Brazil Agrivoltaics Market, By Crop Type, 2020-2033 (USD Billion)
41. Middle East and Africa Agrivoltaics Market, By System Design, 2020-2033 (USD Billion)
42. Middle East and Africa Agrivoltaics Market, By Crop Type, 2020-2033 (USD Billion)
43. UAE Agrivoltaics Market, By System Design, 2020-2033 (USD Billion)
44. UAE Agrivoltaics Market, By Crop Type, 2020-2033 (USD Billion)
45. South Africa Agrivoltaics Market, By System Design, 2020-2033 (USD Billion)
46. South Africa Agrivoltaics Market, By Crop Type, 2020-2033 (USD Billion)
List of Figures
1. Global Agrivoltaics Market Segmentation
2. Global Agrivoltaics Market: Research Methodology
3. Market Size Estimation Methodology: Bottom-Up Approach
4. Market Size Estimation Methodology: Top-Down Approach
5. Data Triangulation
6. Porter’s Five Forces Analysis
7. Value Chain Analysis
8. Global Agrivoltaics Market Attractiveness Analysis by System Design
9. Global Agrivoltaics Market Attractiveness Analysis by Crop Type
10. Global Agrivoltaics Market Attractiveness Analysis by Region
11. Global Agrivoltaics Market: Dynamics
12. Global Agrivoltaics Market Share by System Design (2023 & 2033)
13. Global Agrivoltaics Market Share by Crop Type (2023 & 2033)
14. Global Agrivoltaics Market Share by Regions (2023 & 2033)
15. Global Agrivoltaics Market Share by Company (2023)
This study forecasts revenue at global, regional, and country levels from 2020 to 2033. The Brainy Insights has segmented the global agrivoltaics market based on below-mentioned segments:
Global Agrivoltaics Market by System Design:
Global Agrivoltaics Market by Crop Type:
Global Agrivoltaics Market by Region:
Research has its special purpose to undertake marketing efficiently. In this competitive scenario, businesses need information across all industry verticals; the information about customer wants, market demand, competition, industry trends, distribution channels etc. This information needs to be updated regularly because businesses operate in a dynamic environment. Our organization, The Brainy Insights incorporates scientific and systematic research procedures in order to get proper market insights and industry analysis for overall business success. The analysis consists of studying the market from a miniscule level wherein we implement statistical tools which helps us in examining the data with accuracy and precision.
Our research reports feature both; quantitative and qualitative aspects for any market. Qualitative information for any market research process are fundamental because they reveal the customer needs and wants, usage and consumption for any product/service related to a specific industry. This in turn aids the marketers/investors in knowing certain perceptions of the customers. Qualitative research can enlighten about the different product concepts and designs along with unique service offering that in turn, helps define marketing problems and generate opportunities. On the other hand, quantitative research engages with the data collection process through interviews, e-mail interactions, surveys and pilot studies. Quantitative aspects for the market research are useful to validate the hypotheses generated during qualitative research method, explore empirical patterns in the data with the help of statistical tools, and finally make the market estimations.
The Brainy Insights offers comprehensive research and analysis, based on a wide assortment of factual insights gained through interviews with CXOs and global experts and secondary data from reliable sources. Our analysts and industry specialist assume vital roles in building up statistical tools and analysis models, which are used to analyse the data and arrive at accurate insights with exceedingly informative research discoveries. The data provided by our organization have proven precious to a diverse range of companies, facilitating them to address issues such as determining which products/services are the most appealing, whether or not customers use the product in the manner anticipated, the purchasing intentions of the market and many others.
Our research methodology encompasses an idyllic combination of primary and secondary initiatives. Key phases involved in this process are listed below:

The phase involves the gathering and collecting of market data and its related information with the help of different sources & research procedures.

The data procurement stage involves in data gathering and collecting through various data sources.
This stage involves in extensive research. These data sources includes:
Purchased Database: Purchased databases play a crucial role in estimating the market sizes irrespective of the domain. Our purchased database includes:
Primary Research: The Brainy Insights interacts with leading companies and experts of the concerned domain to develop the analyst team’s market understanding and expertise. It improves and substantiates every single data presented in the market reports. Primary research mainly involves in telephonic interviews, E-mail interactions and face-to-face interviews with the raw material providers, manufacturers/producers, distributors, & independent consultants. The interviews that we conduct provides valuable data on market size and industry growth trends prevailing in the market. Our organization also conducts surveys with the various industry experts in order to gain overall insights of the industry/market. For instance, in healthcare industry we conduct surveys with the pharmacists, doctors, surgeons and nurses in order to gain insights and key information of a medical product/device/equipment which the customers are going to usage. Surveys are conducted in the form of questionnaire designed by our own analyst team. Surveys plays an important role in primary research because surveys helps us to identify the key target audiences of the market. Additionally, surveys helps to identify the key target audience engaged with the market. Our survey team conducts the survey by targeting the key audience, thus gaining insights from them. Based on the perspectives of the customers, this information is utilized to formulate market strategies. Moreover, market surveys helps us to understand the current competitive situation of the industry. To be precise, our survey process typically involve with the 360 analysis of the market. This analytical process begins by identifying the prospective customers for a product or service related to the market/industry to obtain data on how a product/service could fit into customers’ lives.

Secondary Research: The secondary data sources includes information published by the on-profit organizations such as World bank, WHO, company fillings, investor presentations, annual reports, national government documents, statistical databases, blogs, articles, white papers and others. From the annual report, we analyse a company’s revenue to understand the key segment and market share of that organization in a particular region. We analyse the company websites and adopt the product mapping technique which is important for deriving the segment revenue. In the product mapping method, we select and categorize the products offered by the companies catering to domain specific market, deduce the product revenue for each of the companies so as to get overall estimation of the market size. We also source data and analyses trends based on information received from supply side and demand side intermediaries in the value chain. The supply side denotes the data gathered from supplier, distributor, wholesaler and the demand side illustrates the data gathered from the end customers for respective market domain.

The supply side for a domain specific market is analysed by:
The demand side for the market is estimated through:
In-house Library: Apart from these third-party sources, we have our in-house library of qualitative and quantitative information. Our in-house database includes market data for various industry and domains. These data are updated on regular basis as per the changing market scenario. Our library includes, historic databases, internal audit reports and archives.
Sometimes there are instances where there is no metadata or raw data available for any domain specific market. For those cases, we use our expertise to forecast and estimate the market size in order to generate comprehensive data sets. Our analyst team adopt a robust research technique in order to produce the estimates:
Data Synthesis: This stage involves the analysis & mapping of all the information obtained from the previous step. It also involves in scrutinizing the data for any discrepancy observed while data gathering related to the market. The data is collected with consideration to the heterogeneity of sources. Robust scientific techniques are in place for synthesizing disparate data sets and provide the essential contextual information that can orient market strategies. The Brainy Insights has extensive experience in data synthesis where the data passes through various stages:


Market Deduction & Formulation: The final stage comprises of assigning data points at appropriate market spaces so as to deduce feasible conclusions. Analyst perspective & subject matter expert based holistic form of market sizing coupled with industry analysis also plays a crucial role in this stage.
This stage involves in finalization of the market size and numbers that we have collected from data integration step. With data interpolation, it is made sure that there is no gap in the market data. Successful trend analysis is done by our analysts using extrapolation techniques, which provide the best possible forecasts for the market.
Data Validation & Market Feedback: Validation is the most important step in the process. Validation & re-validation via an intricately designed process helps us finalize data-points to be used for final calculations.

The Brainy Insights interacts with leading companies and experts of the concerned domain to develop the analyst team’s market understanding and expertise. It improves and substantiates every single data presented in the market reports. The data validation interview and discussion panels are typically composed of the most experienced industry members. The participants include, however, are not limited to:
Moreover, we always validate our data and findings through primary respondents from all the major regions we are working on.


Free Customization
Fortune 500 Clients
Free Yearly Update On Purchase Of Multi/Corporate License
Companies Served Till Date