- +1-315-215-1633
- sales@thebrainyinsights.com

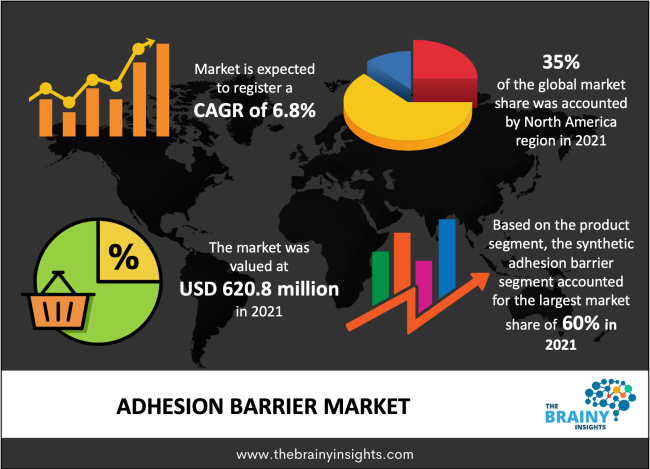
The adhesion barrier market was estimated at around USD 620.8 million in 2021, growing at a CAGR of nearly 6.8% during 2022-2030. The market is projected to reach approximately USD 1,120 million by 2030.
A medical device called an adhesion barrier is used to prevent the adhesion that develops during surgery. The adhesion barrier is utilized to keep internal tissues and the organ apart in order to prevent the development of the scar tissues known as adhesion. Adhesion develops as a result of the peritoneal peritoneum's parietal and visceral injury. Infertility, persistent discomfort, and intestinal blockage are three frequent hazards associated with adhesion formation during surgery.
These adhesion barriers are constructed of expanded polytetrafluoroethylene, sodium hyaluronate, carboxymethylcellulose, and oxidized regenerated cellulose. Gynecological surgery, abdominal surgery, and other operations are some of its key applications. In order to repair the coronary arteries, adhesion barriers are typically utilized in cardiovascular procedures. As opposed to the liquid formulation, the gel and film versions of adhesion barriers are more frequently used.
Adhesion barriers are being used more frequently as surgical procedures multiply. The sterile, clear, and extremely viscous adhesion barriers in gel form serve as a barrier to stop or lessen post-surgical adhesions at the surgical site. One example of a gel formulation that is sold commercially is hyalobarrier gel. The internal tissue surfaces of the organ and the adhesion barrier are often prevented from adhering to one another during and after surgery by the liquid form of the adhesion barrier, which is typically made of high molecular glucose polymers, such as Icodextrin.
Get an overview of this study by requesting a free sample
As a result of the sick population, there is an increasing need for medical supplies. An oxygen generator, life-support system, or monitor are a few examples of respiratory support equipment, which is one of the most often used medical devices in first-line clinical therapy. The COVID-19 outbreak has also resulted in a considerable rise in demand for medical supplies such as masks, gloves, and safety glasses. Healthcare professionals and the general public continue to have an increasing need for medical supplies as a result of an increase in COVID-19 cases around the world. To maintain a sufficient and ongoing supply of personal protective equipment in the market, manufacturers of these items have the opportunity to profit from the rising demand for medical supplies. Due to these factors, COVID 19 is anticipated to have a significant effect on the market for adhesion barriers.
Increase in post-operative adhesion cases to accelerate the market’s growth
The global market for adhesion barriers is anticipated to be significantly impacted by the rise in post-operative adhesion occurrence. Abdominal adhesion is a risk for about 90% of patients who have abdominal surgery, especially laparotomy. Only 10% of people do not form abdominal adhesion barriers. A complicated appendectomy, issues with the small intestine, gastrointestinal malignancy, hysterectomy, and ectopic pregnancy are frequently indications of laparotomy. Every year, more than 9 million abdominal and pelvic surgeries are carried out in the United States. The rate of adhesion during C-sections is around 94%, but it ranges between 65% and 75% after adhesiolysis and gastrointestinal surgery. Inflammatory bowel illness, abdominal tuberculosis, and diverticular diseases are examples of non-surgical adhesions. The most frequent causes of adhesion are endometriosis and pelvic inflammatory disorders.
Increased global use of adhesion barrier products
The use of adhesion barrier agents by surgeons has expanded recently throughout the world. After gynecological postpartum procedures, women develop adhesions, which lead to chronic pain, inflammation, infertility, and other gynecological conditions. The choice of adhesion barrier films by surgeons during surgical procedures is influenced by this. The overall morbidity and treatment costs have increased as a result of issues brought on by post-surgical adhesion. In North America, sticky small intestine obstruction has been linked to over 300,000 hospital admissions, 850,000 days spent there, and a cost of about US$ 1.3 billion.
The rise in lifestyle problems will increase product demand
Increasingly more individuals are living sedentary lifestyles as a result of urbanization and rising disposable incomes worldwide. Due to this, a number of lifestyle problems, including obesity, hypertension, cancer, and others, are on the rise. 9.8% of adults worldwide have diabetes, and 39% of adults are overweight. The World Health Organization (WHO) reports that diabetes is a significant contributor to kidney failure, heart attacks, strokes, lower limb amputations, blindness, and heart attacks. Additionally, hypertension affects 26% of the population and is expected to rise to 29% by 2030. The prevalence of diseases including cancer, stroke, and heart failure among young individuals is rising as a result of these ailments, which is fueling demand for adhesion barriers.
The adhesion barrier market is segmented into the product, and application. Based on product, the market for synthetic adhesion barrier segment is estimated to lead the market during the forecast period. Due to its high bioresorbable and biocompatible qualities, the synthetic adhesion barrier category accounted for the greatest market share. Cost-effectiveness of synthetic adhesion barriers is anticipated to boost category sales. Moreover, the availability of commercial synthetic adhesion barriers is principally responsible for the segment's domination. The segment is further broken down into polyethylene glycol, regenerated cellulose, hyaluronic acid, and others. Due of its ability to draw in and retain a significant amount of moisture, hyaluronic acid dominates this market.
By application, the gynecological surgeries segment is anticipated to dominant the adhesion barrier market during the forecast period. Gynecologic laparoscopy procedures are becoming more common, which is principally responsible for market dominance. The market is expanding as a result of the growing use of gel form and film form in a variety of gynecological treatments, such as endometriosis surgery, ovarian cystectomy, and ectopic pregnancy. Adoption of adhesion barriers is anticipated to benefit from the slow uptake of minimally invasive procedures in poorer nations. Cameras and robot-assisted devices are pricey pieces of equipment needed for minimally invasive operations. Due to price-conscious consumers, it is anticipated that the adoption of these gadgets will be minimal in emerging nations.
North America is anticipated to remain one of the most appealing markets throughout the projection period, and this region accounts for the majority revenue share in the market. This can be attributed to the growth in surgeries performed in the United States, the rise in the number of elderly people, and the development of chronic diseases including cancer and gynecological disorders. It is commonly known that the number of surgeries performed in the area is rising. Technology development, older patients' expectations of better levels of function, and reimbursement schemes that encourage sophisticated fusion surgery are the main drivers of the expansion in the United States. Adhesion barriers are helpful during oncology procedures as well. Additionally, rising public awareness of the need for surgical operations to treat injuries and the complications associated with chronic diseases is fueling market expansion. The growth of the market is projected to be positively impacted by the increasing number of surgeries performed in the North American area for neurological and cardiovascular conditions.
By Product
By Formulation
By Application
By Region/Geography
| Attribute | Description |
|---|---|
| Market Size | Revenue (USD Million) |
| Report Coverage | Revenue estimation and forecast, company profile, competitive landscape, growth factors, and recent trends |
| Regional scope | North America, Europe, Asia Pacific, Middle East & Africa, and Latin America |
| Adhesion barrier Market CAGR | 6.8% |
| Segments Covered |
By Product |
| Base Year | 2021 |
| Forecast | 2022-2030 |
List of Table
1. Global Adhesion Barrier Market, By Product, 2022-2030(USD Million)
2. Global Synthetic Adhesion Barriers Adhesion Barrier Market, By Region, 2022-2030(USD Million)
3. Global Natural Adhesion Barriers Adhesion Barrier Market, By Region, 2022-2030(USD Million)
4. Global Adhesion Barrier Market, By Formulation, 2022-2030(USD Million)
5. Global Film Formulations Adhesion Barrier Market, By Region, 2022-2030(USD Million)
6. Global Gel Formulations Adhesion Barrier Market, By Region, 2022-2030(USD Million)
7. Global Liquid Formulations Adhesion Barrier Market, By Region, 2022-2030(USD Million)
8. Global Adhesion Barrier Market, By Application, 2022-2030(USD Million)
9. Global Gynecological Surgeries Adhesion Barrier Market, By Region, 2022-2030(USD Million)
10. Global Orthopedic Surgeries Adhesion Barrier Market, By Region, 2022-2030(USD Million)
11. Global Cardiovascular Surgeries Adhesion Barrier Market, By Region, 2022-2030(USD Million)
12. Global Neurological Surgeries Adhesion Barrier Market, By Region, 2022-2030(USD Million)
13. Global Others Adhesion Barrier Market, By Region, 2022-2030(USD Million)
14. Global Adhesion Barrier Market, By Region, 2022-2030(USD Million)
15. Global Adhesion Barrier Market, By North America, 2022-2030(USD Million)
16. North America Adhesion Barrier Market, By Product, 2022-2030(USD Million)
17. North America Adhesion Barrier Market, By Formulation, 2022-2030(USD Million)
18. North America Adhesion Barrier Market, By Application, 2022-2030(USD Million)
19. U.S. Adhesion Barrier Market, By Product, 2022-2030(USD Million)
20. U.S. Adhesion Barrier Market, By Formulation, 2022-2030(USD Million)
21. U.S. Adhesion Barrier Market, By Application, 2022-2030(USD Million)
22. Canada Adhesion Barrier Market, By Product, 2022-2030(USD Million)
23. Canada Adhesion Barrier Market, By Formulation, 2022-2030(USD Million)
24. Canada Adhesion Barrier Market, By Application, 2022-2030(USD Million)
25. Mexico Adhesion Barrier Market, By Product, 2022-2030(USD Million)
26. Mexico Adhesion Barrier Market, By Formulation, 2022-2030(USD Million)
27. Mexico Adhesion Barrier Market, By Application, 2022-2030(USD Million)
28. Europe Adhesion Barrier Market, By Product, 2022-2030(USD Million)
29. Europe Adhesion Barrier Market, By Formulation, 2022-2030(USD Million)
30. Europe Adhesion Barrier Market, By Application, 2022-2030(USD Million)
31. Germany Adhesion Barrier Market, By Product, 2022-2030(USD Million)
32. Germany Adhesion Barrier Market, By Formulation, 2022-2030(USD Million)
33. Germany Adhesion Barrier Market, By Application, 2022-2030(USD Million)
34. France Adhesion Barrier Market, By Product, 2022-2030(USD Million)
35. France Adhesion Barrier Market, By Formulation, 2022-2030(USD Million)
36. France Adhesion Barrier Market, By Application, 2022-2030(USD Million)
37. U.K. Adhesion Barrier Market, By Product, 2022-2030(USD Million)
38. U.K. Adhesion Barrier Market, By Formulation, 2022-2030(USD Million)
39. U.K. Adhesion Barrier Market, By Application, 2022-2030(USD Million)
40. Italy Adhesion Barrier Market, By Product, 2022-2030(USD Million)
41. Italy Adhesion Barrier Market, By Formulation, 2022-2030(USD Million)
42. Italy Adhesion Barrier Market, By Application, 2022-2030(USD Million)
43. Spain Adhesion Barrier Market, By Product, 2022-2030(USD Million)
44. Spain Adhesion Barrier Market, By Formulation, 2022-2030(USD Million)
45. Spain Adhesion Barrier Market, By Application, 2022-2030(USD Million)
46. Rest of Europe Adhesion Barrier Market, By Product, 2022-2030(USD Million)
47. Rest of Europe Adhesion Barrier Market, By Formulation, 2022-2030(USD Million)
48. Rest of Europe Adhesion Barrier Market, By Application, 2022-2030(USD Million)
49. Asia Pacific Adhesion Barrier Market, By Product, 2022-2030(USD Million)
50. Asia Pacific Adhesion Barrier Market, By Formulation, 2022-2030(USD Million)
51. Asia Pacific Adhesion Barrier Market, By Application, 2022-2030(USD Million)
52. Japan Adhesion Barrier Market, By Product, 2022-2030(USD Million)
53. Japan Adhesion Barrier Market, By Formulation, 2022-2030(USD Million)
54. Japan Adhesion Barrier Market, By Application, 2022-2030(USD Million)
55. China Adhesion Barrier Market, By Product, 2022-2030(USD Million)
56. China Adhesion Barrier Market, By Formulation, 2022-2030(USD Million)
57. China Adhesion Barrier Market, By Application, 2022-2030(USD Million)
58. India Adhesion Barrier Market, By Product, 2022-2030(USD Million)
59. India Adhesion Barrier Market, By Formulation, 2022-2030(USD Million)
60. India Adhesion Barrier Market, By Application, 2022-2030(USD Million)
61. Australia Adhesion Barrier Market, By Product, 2022-2030(USD Million)
62. Australia Adhesion Barrier Market, By Formulation, 2022-2030(USD Million)
63. Australia Adhesion Barrier Market, By Application, 2022-2030(USD Million)
64. South Korea Adhesion Barrier Market, By Product, 2022-2030(USD Million)
65. South Korea Adhesion Barrier Market, By Formulation, 2022-2030(USD Million)
66. South Korea Adhesion Barrier Market, By Application, 2022-2030(USD Million)
67. Rest of Asia-Pacific Adhesion Barrier Market, By Product, 2022-2030(USD Million)
68. Rest of Asia-Pacific Adhesion Barrier Market, By Formulation, 2022-2030(USD Million)
69. Rest of Asia-Pacific Adhesion Barrier Market, By Application, 2022-2030(USD Million)
70. South America Adhesion Barrier Market, By Product, 2022-2030(USD Million)
71. South America Adhesion Barrier Market, By Formulation, 2022-2030(USD Million)
72. South America Adhesion Barrier Market, By Application, 2022-2030(USD Million)
73. Brazil Adhesion Barrier Market, By Product, 2022-2030(USD Million)
74. Brazil Adhesion Barrier Market, By Formulation, 2022-2030(USD Million)
75. Brazil Adhesion Barrier Market, By Application, 2022-2030(USD Million)
76. Argentina Adhesion Barrier Market, By Product, 2022-2030(USD Million)
77. Argentina Adhesion Barrier Market, By Formulation, 2022-2030(USD Million)
78. Argentina Adhesion Barrier Market, By Application, 2022-2030(USD Million)
79. Rest of South America Adhesion Barrier Market, By Product, 2022-2030(USD Million)
80. Rest of South America Adhesion Barrier Market, By Formulation, 2022-2030(USD Million)
81. Rest of South America Adhesion Barrier Market, By Application, 2022-2030(USD Million)
82. Middle East and Africa Adhesion Barrier Market, By Product, 2022-2030(USD Million)
83. Middle East and Africa Adhesion Barrier Market, By Formulation, 2022-2030(USD Million)
84. Middle East and Africa Adhesion Barrier Market, By Application, 2022-2030(USD Million)
85. UAE Adhesion Barrier Market, By Product, 2022-2030(USD Million)
86. UAE Adhesion Barrier Market, By Formulation, 2022-2030(USD Million)
87. UAE Adhesion Barrier Market, By Application, 2022-2030(USD Million)
88. South Africa Adhesion Barrier Market, By Product, 2022-2030(USD Million)
89. South Africa Adhesion Barrier Market, By Formulation, 2022-2030(USD Million)
90. South Africa Adhesion Barrier Market, By Application, 2022-2030(USD Million)
91. Saudi Arabia Adhesion Barrier Market, By Product, 2022-2030(USD Million)
92. Saudi Arabia Adhesion Barrier Market, By Formulation, 2022-2030(USD Million)
93. Saudi Arabia Adhesion Barrier Market, By Application, 2022-2030(USD Million)
94. Rest of Middle East & Africa Adhesion Barrier Market, By Product, 2022-2030(USD Million)
95. Rest of Middle East & Africa Adhesion Barrier Market, By Formulation, 2022-2030(USD Million)
96. Rest of Middle East & Africa Adhesion Barrier Market, By Application, 2022-2030(USD Million)
List of Figures
1. Global Adhesion Barrier Market Segmentation
2. Adhesion Barrier Market: Research Methodology
3. Market Size Estimation Methodology: Bottom-Up Approach
4. Market Size Estimation Methodology: Top-Down Approach
5. Data Triangulation
6. Porter’s Five Forces Analysis
7. Value Chain Analysis
8. Global Adhesion Barrier Market Attractiveness Analysis By Product
9. Global Adhesion Barrier Market Attractiveness Analysis By Formulation
10. Global Adhesion Barrier Market Attractiveness Analysis By Application
11. Global Adhesion Barrier Market Attractiveness Analysis By Region
12. Global Adhesion Barrier Market: Dynamics
13. Global Adhesion Barrier Market Share By Product(2022 & 2030)
14. Global Adhesion Barrier Market Share By Formulation(2022 & 2030)
15. Global Adhesion Barrier Market Share By Application(2022 & 2030)
16. Global Adhesion Barrier Market Share by Regions (2022 & 2030)
17. Global Adhesion Barrier Market Share by Company (2021)
1. Introduction
1.1. Objectives of the Study
1.2. Market Definition
1.3. Research Scope
2. Research Methodology and Assumptions
3. Executive Summary
4. Premium Insights
4.1. Porter’s Five Forces Analysis
4.2. Value Chain Analysis
4.3. Top Investment Pockets
4.3.1. Market Attractiveness Analysis By Product
4.3.2. Market Attractiveness Analysis By Formulation
4.3.3. Market Attractiveness Analysis By Application
4.4. Industry Trends
5. Market Dynamics
5.1. Market Evaluation
5.2. Drivers
5.2.1. Increase in post-operative adhesion cases to accelerate the market’s growth
5.2.2. Increased global use of adhesion barrier products
5.2.3. The rise in lifestyle problems will increase product demand
5.3. Restrains
5.3.1. Surgeons' reluctance to utilise adhesion barriers would hamper the market
5.4. Opportunities
5.4.1. Emerging markets
6. Global Adhesion Barrier Market Analysis and Forecast, By Product
6.1. Segment Overview
6.2. Synthetic Adhesion Barriers
6.3. Natural Adhesion Barriers
7. Global Adhesion Barrier Market Analysis and Forecast, By Formulation
7.1. Segment Overview
7.2. Film Formulations
7.3. Gel Formulations
7.4. Liquid Formulations
8. Global Adhesion Barrier Market Analysis and Forecast, By Application
8.1. Segment Overview
8.2. Gynecological Surgeries
8.3. Orthopedic Surgeries
8.4. Cardiovascular Surgeries
8.5. Neurological Surgeries
8.6. Others
9. Global Adhesion Barrier Market Analysis and Forecast, By Regional Analysis
9.1. Segment Overview
9.2. North America
9.2.1. U.S.
9.2.2. Canada
9.2.3. Mexico
9.3. Europe
9.3.1. Germany
9.3.2. France
9.3.3. U.K.
9.3.4. Italy
9.3.5. Spain
9.3.6. Rest of Europe
9.4. Asia-Pacific
9.4.1. Japan
9.4.2. China
9.4.3. India
9.4.4. Australia
9.4.5. South Korea
9.4.6. Rest of Asia-Pacific
9.5. South America
9.5.1. Brazil
9.5.2. Argentina
9.5.3. Rest of South America
9.6. Middle East and Africa
9.6.1. UAE
9.6.2. South Africa
9.6.3. Saudi Arabia
9.6.4. Rest of Middle East & Africa
10. Global Adhesion Barrier Market-Competitive Landscape
10.1. Overview
10.2. Market Share of Key Players in the Adhesion Barrier Market
10.2.1. Global Company Market Share
10.2.2. North America Company Market Share
10.2.3. Europe Company Market Share
10.2.4. APAC Company Market Share
10.3. Competitive Situations and Trends
10.3.1. Product Launches and Developments
10.3.2. Partnerships, Collaborations, and Agreements
10.3.3. Mergers & Acquisitions
10.3.4. Expansions
11. Company Profiles
11.1. Baxter International, Inc.
11.1.1. Business Overview
11.1.2. Company Snapshot
11.1.3. Company Market Share Analysis
11.1.4. Company Application Portfolio
11.1.5. Recent Developments
11.1.6. SWOT Analysis
11.2. Becton, Dickinson and Company
11.2.1. Business Overview
11.2.2. Company Snapshot
11.2.3. Company Market Share Analysis
11.2.4. Company Application Portfolio
11.2.5. Recent Developments
11.2.6. SWOT Analysis
11.3. Sanofi
11.3.1. Business Overview
11.3.2. Company Snapshot
11.3.3. Company Market Share Analysis
11.3.4. Company Application Portfolio
11.3.5. Recent Developments
11.3.6. SWOT Analysis
11.4. Innocoll
11.4.1. Business Overview
11.4.2. Company Snapshot
11.4.3. Company Market Share Analysis
11.4.4. Company Application Portfolio
11.4.5. Recent Developments
11.4.6. SWOT Analysis
11.5. Ethicon US, LLC
11.5.1. Business Overview
11.5.2. Company Snapshot
11.5.3. Company Market Share Analysis
11.5.4. Company Application Portfolio
11.5.5. Recent Developments
11.5.6. SWOT Analysis
11.6. Hangzhou Singclean Medical Products Co., Ltd.
11.6.1. Business Overview
11.6.2. Company Snapshot
11.6.3. Company Market Share Analysis
11.6.4. Company Application Portfolio
11.6.5. Recent Developments
11.6.6. SWOT Analysis
11.7. Allosource
11.7.1. Business Overview
11.7.2. Company Snapshot
11.7.3. Company Market Share Analysis
11.7.4. Company Application Portfolio
11.7.5. Recent Developments
11.7.6. SWOT Analysis
11.8. Anika Therapeutics
11.8.1. Business Overview
11.8.2. Company Snapshot
11.8.3. Company Market Share Analysis
11.8.4. Company Application Portfolio
11.8.5. Recent Developments
11.8.6. SWOT Analysis
11.9. PlantTec Medical GmbH
11.9.1. Business Overview
11.9.2. Company Snapshot
11.9.3. Company Market Share Analysis
11.9.4. Company Application Portfolio
11.9.5. Recent Developments
11.9.6. SWOT Analysis
11.10. Integra LifeSciences Corporation
11.10.1. Business Overview
11.10.2. Company Snapshot
11.10.3. Company Market Share Analysis
11.10.4. Company Application Portfolio
11.10.5. Recent Developments
11.10.6. SWOT Analysis
By Product
By Formulation
By Application
By Region/Geography
Research has its special purpose to undertake marketing efficiently. In this competitive scenario, businesses need information across all industry verticals; the information about customer wants, market demand, competition, industry trends, distribution channels etc. This information needs to be updated regularly because businesses operate in a dynamic environment. Our organization, The Brainy Insights incorporates scientific and systematic research procedures in order to get proper market insights and industry analysis for overall business success. The analysis consists of studying the market from a miniscule level wherein we implement statistical tools which helps us in examining the data with accuracy and precision.
Our research reports feature both; quantitative and qualitative aspects for any market. Qualitative information for any market research process are fundamental because they reveal the customer needs and wants, usage and consumption for any product/service related to a specific industry. This in turn aids the marketers/investors in knowing certain perceptions of the customers. Qualitative research can enlighten about the different product concepts and designs along with unique service offering that in turn, helps define marketing problems and generate opportunities. On the other hand, quantitative research engages with the data collection process through interviews, e-mail interactions, surveys and pilot studies. Quantitative aspects for the market research are useful to validate the hypotheses generated during qualitative research method, explore empirical patterns in the data with the help of statistical tools, and finally make the market estimations.
The Brainy Insights offers comprehensive research and analysis, based on a wide assortment of factual insights gained through interviews with CXOs and global experts and secondary data from reliable sources. Our analysts and industry specialist assume vital roles in building up statistical tools and analysis models, which are used to analyse the data and arrive at accurate insights with exceedingly informative research discoveries. The data provided by our organization have proven precious to a diverse range of companies, facilitating them to address issues such as determining which products/services are the most appealing, whether or not customers use the product in the manner anticipated, the purchasing intentions of the market and many others.
Our research methodology encompasses an idyllic combination of primary and secondary initiatives. Key phases involved in this process are listed below:

The phase involves the gathering and collecting of market data and its related information with the help of different sources & research procedures.

The data procurement stage involves in data gathering and collecting through various data sources.
This stage involves in extensive research. These data sources includes:
Purchased Database: Purchased databases play a crucial role in estimating the market sizes irrespective of the domain. Our purchased database includes:
Primary Research: The Brainy Insights interacts with leading companies and experts of the concerned domain to develop the analyst team’s market understanding and expertise. It improves and substantiates every single data presented in the market reports. Primary research mainly involves in telephonic interviews, E-mail interactions and face-to-face interviews with the raw material providers, manufacturers/producers, distributors, & independent consultants. The interviews that we conduct provides valuable data on market size and industry growth trends prevailing in the market. Our organization also conducts surveys with the various industry experts in order to gain overall insights of the industry/market. For instance, in healthcare industry we conduct surveys with the pharmacists, doctors, surgeons and nurses in order to gain insights and key information of a medical product/device/equipment which the customers are going to usage. Surveys are conducted in the form of questionnaire designed by our own analyst team. Surveys plays an important role in primary research because surveys helps us to identify the key target audiences of the market. Additionally, surveys helps to identify the key target audience engaged with the market. Our survey team conducts the survey by targeting the key audience, thus gaining insights from them. Based on the perspectives of the customers, this information is utilized to formulate market strategies. Moreover, market surveys helps us to understand the current competitive situation of the industry. To be precise, our survey process typically involve with the 360 analysis of the market. This analytical process begins by identifying the prospective customers for a product or service related to the market/industry to obtain data on how a product/service could fit into customers’ lives.

Secondary Research: The secondary data sources includes information published by the on-profit organizations such as World bank, WHO, company fillings, investor presentations, annual reports, national government documents, statistical databases, blogs, articles, white papers and others. From the annual report, we analyse a company’s revenue to understand the key segment and market share of that organization in a particular region. We analyse the company websites and adopt the product mapping technique which is important for deriving the segment revenue. In the product mapping method, we select and categorize the products offered by the companies catering to domain specific market, deduce the product revenue for each of the companies so as to get overall estimation of the market size. We also source data and analyses trends based on information received from supply side and demand side intermediaries in the value chain. The supply side denotes the data gathered from supplier, distributor, wholesaler and the demand side illustrates the data gathered from the end customers for respective market domain.

The supply side for a domain specific market is analysed by:
The demand side for the market is estimated through:
In-house Library: Apart from these third-party sources, we have our in-house library of qualitative and quantitative information. Our in-house database includes market data for various industry and domains. These data are updated on regular basis as per the changing market scenario. Our library includes, historic databases, internal audit reports and archives.
Sometimes there are instances where there is no metadata or raw data available for any domain specific market. For those cases, we use our expertise to forecast and estimate the market size in order to generate comprehensive data sets. Our analyst team adopt a robust research technique in order to produce the estimates:
Data Synthesis: This stage involves the analysis & mapping of all the information obtained from the previous step. It also involves in scrutinizing the data for any discrepancy observed while data gathering related to the market. The data is collected with consideration to the heterogeneity of sources. Robust scientific techniques are in place for synthesizing disparate data sets and provide the essential contextual information that can orient market strategies. The Brainy Insights has extensive experience in data synthesis where the data passes through various stages:


Market Deduction & Formulation: The final stage comprises of assigning data points at appropriate market spaces so as to deduce feasible conclusions. Analyst perspective & subject matter expert based holistic form of market sizing coupled with industry analysis also plays a crucial role in this stage.
This stage involves in finalization of the market size and numbers that we have collected from data integration step. With data interpolation, it is made sure that there is no gap in the market data. Successful trend analysis is done by our analysts using extrapolation techniques, which provide the best possible forecasts for the market.
Data Validation & Market Feedback: Validation is the most important step in the process. Validation & re-validation via an intricately designed process helps us finalize data-points to be used for final calculations.

The Brainy Insights interacts with leading companies and experts of the concerned domain to develop the analyst team’s market understanding and expertise. It improves and substantiates every single data presented in the market reports. The data validation interview and discussion panels are typically composed of the most experienced industry members. The participants include, however, are not limited to:
Moreover, we always validate our data and findings through primary respondents from all the major regions we are working on.


Free Customization
Fortune 500 Clients
Free Yearly Update On Purchase Of Multi/Corporate License
Companies Served Till Date