- +1-315-215-1633
- sales@thebrainyinsights.com

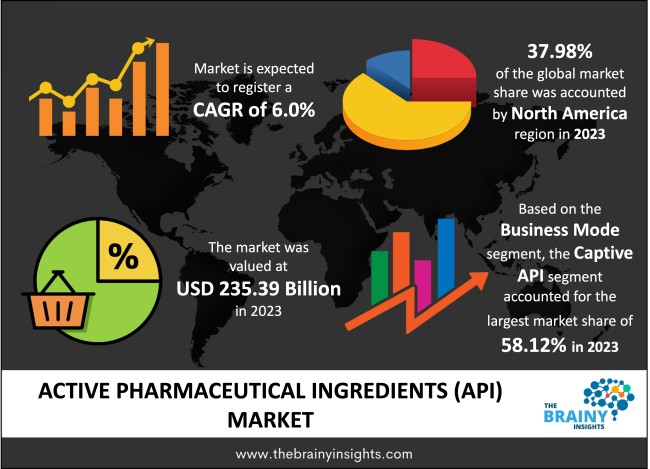
The global active pharmaceutical ingredients (API) market was valued at USD 235.39 billion in 2023 and is anticipated to growing at a CAGR of 6.0% from 2024 to 2033. The global active pharmaceutical ingredients (API) market is expected to reach USD 421.56 billion by 2033. The Asia Pacific region is expected to grow the fastest during the forecast period.
The active pharmaceutical ingredient (API) is the drug's active component. An active pharmaceutical ingredient (API) is a part of a drug that gives the desired results that an actual drug is supposed to provide. Most of the time, a drug will have more than one ingredient. The API is the essential component of a drug. Other parts of a drug are called excipients. Excipients aren't supposed to hurt living things, and they often make up a different amount of the final product. The word "formulation" refers to figuring out the best way to mix the parts used to make the drug and then make it. Some medicines have more than one active pharmaceutical ingredient (API) to treat a broader range of symptoms or do more complicated things. The API manufacturing industry is growing because of changes in geopolitics and because governments have put in place policies that help the industry. COVID-19 has caused problems with the supply chain, and the API industry is changing considerably. Because of the way the world's politics are right now and the desire to rely less on China as a source for API goods, other countries, like India, are being chosen over China as places to send API exports. Many countries' governments have also come up with policies and offered financial incentives to encourage the development of API.
Get an overview of this study by requesting a free sample
Rising in chronic disease- The growing incidence of chronic diseases is anticipated to drive up the need for pharmaceutical treatments, which will propel the market's expansion for active pharmaceutical components in the forecast period. In addition, some of the strategic activities that are being taken to keep the market stable include introducing new drugs and biological products, collaborations, acquisitions, and geographical expansions. In addition, developments in medical technology, an increase in the number of initiatives undertaken by public and private organizations to raise awareness, and an increase in the amount of funding provided by the government are the factors that will contribute to the expansion of the active pharmaceutical ingredient (API) market. The market for active pharmaceutical ingredients (API) will also rise due to rising disposable income levels, an increasing incidence of seizures, and alterations in lifestyle.
Availability of counterfeit drugs- The availability of substandard and counterfeit drugs is expected to hinder the market’s growth over the forecast period. Furthermore, the disruptions in the supply chain owing to the outbreak of the Covid-19 pandemic restrained the market growth.
Growing research and investment- In addition, an increase in research and development activities, as well as an increase in expenditures made by both public and private organizations, will create new chances for the market's growth rate. In addition, the introduction of efficient treatments and ongoing clinical tests will create lucrative opportunities for the active pharmaceutical ingredient (API) market during the forecast period. In the future, the growth rate of the active pharmaceutical ingredient (API) market will be accelerated by a significant amount of unmet demand for existing treatments and medical technology improvements.
Lack of demand- On the other hand, the worldwide market for active pharmaceutical ingredients (API) needs more demand due to the availability of counterfeit and low-quality pharmaceuticals. A disruption in the API supply chain brought on by COVID-19 presents a challenge to healthcare providers and can potentially threaten the active pharmaceutical ingredients (API) business globally. During the forecast period, the market will face additional challenges due to the absence of treatment for this neurological illness and a general lack of knowledge regarding genetic and uncommon disorders.
The regions analyzed for the market include North America, Europe, South America, Asia Pacific, the Middle East, and Africa. North America emerged as the largest market for the global Active pharmaceutical ingredients (API) market, with a 37.98% share of the market revenue in 2023.
North America currently dominates the Active pharmaceutical ingredients (API) market because more people are getting sick, and there are older people in the population. It is expected that the United States government's current political and trade moves to raise import tariffs and taxes will raise manufacturers' operational costs and put more pressure on them to raise prices. The Food and Drug Administration (FDA) has extended the application fees for new drug approvals and the number of random inspections of various contract manufacturing facilities located outside the United States. These changes were made to ensure that the United States market gets high-quality goods.
The Asia Pacific is expected to be the fastest-growing region because economies like China and India, which the rest of the world relies on to make APIs at lower prices, are in the area is a plus. Increasing healthcare expenditure in the region is anticipated to fuel market growth.
North America Region Active Pharmaceutical Ingredients (API) market Share in 2023 - 37.98%
www.thebrainyinsights.com
Check the geographical analysis of this market by requesting a free sample
The business mode segment is divided into monoclonal Captive API and Merchant API. The Captive API segment dominated the market, with a market share of around 58.12% in 2023. It is expected to increase over the next few years because raw materials are readily available, and prominent market players are investing heavily in building high-tech production facilities. Also, recent events and actions by crucial players make it seem like they put a lot of emphasis on manufacturing within their own companies instead of outsourcing. For example, in November 2019, Novartis announced that it would buy CellforCure, a CDMO based in France, to make molecules that CellforCure previously made under its roof. It is expected that these activities, which large companies did, will help the segment's growth.
The application segment is divided into cardiology, pulmonology, oncology, ophthalmology, neurology, orthopedics, and other applications. Over the forecast period, the cardiology segment is expected to grow at the fastest CAGR of 7.1%. Active pharmaceutical ingredients (API) drugs are being increasingly used in the treatment of cardiology diseases as there is an increase in the number of people suffering from this disease. Several groups, such as the World Heart Federation, the World Stroke Organization, and the Stroke Association, are working to bring more attention to heart diseases. Several government programs, like the National Cholesterol Education Program, aim to teach people more about the problems caused by lipids and cholesterol. During the forecast period, the segment is expected to be driven by how common cardiovascular diseases are and how much more people know about them. This factor will increase demand for active pharmaceutical ingredients (APIs) for cardiology drugs.
The synthesis type segment is divided into synthetic and biotech. The synthetic segment dominated the market, with a market share of around 56.11% in 2023. This factor might be ascribed to the increased accessibility of raw materials and the simplification of the procedures required for synthesising these compounds.
| Attribute | Description |
|---|---|
| Market Size | Revenue (USD Billion) |
| Market size value in 2023 | USD 235.39 Billion |
| Market size value in 2033 | USD 421.56 Billion |
| CAGR (2024 to 2033) | 37.98% |
| Historical data | 2020-2022 |
| Base Year | 2023 |
| Forecast | 2024-2033 |
| Regional Segments | North America, Asia Pacific, Europe, Latin America, Middle East and Africa |
| Segments | Business Mode, Synthesis Type, Application |
As per The Brainy Insights, the size of the global active pharmaceutical ingredients (API) market was valued at USD 235.39 billion in 2023 to USD 421.56 billion by 2033.
The global active pharmaceutical ingredients (API) market is growing at a CAGR of 6.0% during the forecast period 2024-2033.
North America emerged as the largest market for Active Pharmaceutical Ingredients (API).
1. Introduction
1.1. Objectives of the Study
1.2. Market Definition
1.3. Research Scope
1.4. Currency
1.5. Key Target Audience
2. Research Methodology and Assumptions
3. Executive Summary
4. Premium Insights
4.1. Porter’s Five Forces Analysis
4.2. Value Chain Analysis
4.3. Top Investment Pockets
4.3.1. Market Attractiveness Analysis By Business Mode
4.3.2. Market Attractiveness Analysis By Synthesis Type
4.3.3. Market Attractiveness Analysis By Application
4.3.4. Market Attractiveness Analysis By Region
4.4. Industry Trends
5. Market Dynamics
5.1. Market Evaluation
5.2. Drivers
5.2.1. Rise in chronic disease
5.3. Restraints
5.3.1. Availability of counterfeit drugs
5.4. Opportunities
5.4.1. Growing research and investment
5.5. Challenges
5.5.1. Lack of demand
1. Global Active Pharmaceutical Ingredients (API) Market Analysis and Forecast, By Business Mode
1.1. Segment Overview
1.2. Captive API
1.3. Merchant API
2. Global Active Pharmaceutical Ingredients (API) Market Analysis and Forecast, By Synthesis Type
2.1. Segment Overview
2.2. Synthetic
2.3. Biotech
3. Global Active Pharmaceutical Ingredients (API) Market Analysis and Forecast, By Application
3.1. Segment Overview
3.2. Cardiology
3.3. Pulmonology
3.4. Oncology
3.5. Ophthalmology
3.6. Neurology
3.7. Orthopaedic
3.8. Others
4. Global Active Pharmaceutical Ingredients (API) Market Analysis and Forecast, By Regional Analysis
4.1. Segment Overview
4.2. North America
4.2.1. U.S.
4.2.2. Canada
4.2.3. Mexico
4.3. Europe
4.3.1. Germany
4.3.2. France
4.3.3. U.K.
4.3.4. Italy
4.3.5. Spain
4.4. Asia-Pacific
4.4.1. Japan
4.4.2. China
4.4.3. India
4.5. South America
4.5.1. Brazil
4.6. Middle East and Africa
4.6.1. UAE
4.6.2. South Africa
5. Global Active Pharmaceutical Ingredients (API) Market-Competitive Landscape
5.1. Overview
5.2. Market Share of Key Players in Global Active Pharmaceutical Ingredients (API) Market
5.2.1. Global Company Market Share
5.2.2. North America Company Market Share
5.2.3. Europe Company Market Share
5.2.4. APAC Company Market Share
5.3. Competitive Situations and Trends
5.3.1. Product Launches and Developments
5.3.2. Partnerships, Collaborations, and Agreements
5.3.3. Mergers & Acquisitions
5.3.4. Expansions
6. Company Profiles
6.1. Novartis AG
6.1.1. Business Overview
6.1.2. Company Snapshot
6.1.3. Company Market Share Analysis
6.1.4. Company Product Portfolio
6.1.5. Recent Developments
6.1.6. SWOT Analysis
6.2. Sanofi
6.2.1. Business Overview
6.2.2. Company Snapshot
6.2.3. Company Market Share Analysis
6.2.4. Company Product Portfolio
6.2.5. Recent Developments
6.2.6. SWOT Analysis
6.3. Pfizer Inc.
6.3.1. Business Overview
6.3.2. Company Snapshot
6.3.3. Company Market Share Analysis
6.3.4. Company Product Portfolio
6.3.5. Recent Developments
6.3.6. SWOT Analysis
6.4. Johnson & Johnson Private Limited
6.4.1. Business Overview
6.4.2. Company Snapshot
6.4.3. Company Market Share Analysis
6.4.4. Company Product Portfolio
6.4.5. Recent Developments
6.4.6. SWOT Analysis
6.5. Abbott
6.5.1. Business Overview
6.5.2. Company Snapshot
6.5.3. Company Market Share Analysis
6.5.4. Company Product Portfolio
6.5.5. Recent Developments
6.5.6. SWOT Analysis
6.6. Teva Pharmaceutical Industries Ltd.
6.6.1. Business Overview
6.6.2. Company Snapshot
6.6.3. Company Market Share Analysis
6.6.4. Company Product Portfolio
6.6.5. Recent Developments
6.6.6. SWOT Analysis
6.7. INLIFE Healthcare
6.7.1. Business Overview
6.7.2. Company Snapshot
6.7.3. Company Market Share Analysis
6.7.4. Company Product Portfolio
6.7.5. Recent Developments
6.7.6. SWOT Analysis
6.8. Bausch Health Companies Inc.
6.8.1. Business Overview
6.8.2. Company Snapshot
6.8.3. Company Market Share Analysis
6.8.4. Company Product Portfolio
6.8.5. Recent Developments
6.8.6. SWOT Analysis
6.9. UCB S.A.
6.9.1. Business Overview
6.9.2. Company Snapshot
6.9.3. Company Market Share Analysis
6.9.4. Company Product Portfolio
6.9.5. Recent Developments
6.9.6. SWOT Analysis
6.10. Sunovion Pharmaceuticals Inc.
6.10.1. Business Overview
6.10.2. Company Snapshot
6.10.3. Company Market Share Analysis
6.10.4. Company Product Portfolio
6.10.5. Recent Developments
6.10.6. SWOT Analysis
6.11. GW Pharmaceuticals plc.
6.11.1. Business Overview
6.11.2. Company Snapshot
6.11.3. Company Market Share Analysis
6.11.4. Company Product Portfolio
6.11.5. Recent Developments
6.11.6. SWOT Analysis
List of Table
1. Global Active Pharmaceutical Ingredients (API) Market, By Business Mode, 2020-2033 (USD Billion)
2. Global Captive API, Active Pharmaceutical Ingredients (API) Market, By Region, 2020-2033 (USD Billion)
3. Global Merchant API, Active Pharmaceutical Ingredients (API) Market, By Region, 2020-2033 (USD Billion)
4. Global Active Pharmaceutical Ingredients (API) Market, By Synthesis Type, 2020-2033 (USD Billion)
5. Global Synthetic, Active Pharmaceutical Ingredients (API) Market, By Region, 2020-2033 (USD Billion)
6. Global Biotech, Active Pharmaceutical Ingredients (API) Market, By Region, 2020-2033 (USD Billion)
7. Global Active Pharmaceutical Ingredients (API) Market, By Application, 2020-2033 (USD Billion)
8. Global Cardiology, Active Pharmaceutical Ingredients (API) Market, By Region, 2020-2033 (USD Billion)
9. Global Pulmonology, Active Pharmaceutical Ingredients (API) Market, By Region, 2020-2033 (USD Billion)
10. Global Oncology, Active Pharmaceutical Ingredients (API) Market, By Region, 2020-2033 (USD Billion)
11. Global Ophthalmology, Active Pharmaceutical Ingredients (API) Market, By Region, 2020-2033 (USD Billion)
12. Global Neurology, Active Pharmaceutical Ingredients (API) Market, By Region, 2020-2033 (USD Billion)
13. Global Orthopaedic, Active Pharmaceutical Ingredients (API) Market, By Region, 2020-2033 (USD Billion)
14. Global Others, Active Pharmaceutical Ingredients (API) Market, By Region, 2020-2033 (USD Billion)
15. North America Active Pharmaceutical Ingredients (API) Market, By Business Mode, 2020-2033 (USD Billion)
16. North America Active Pharmaceutical Ingredients (API) Market, By Synthesis Type, 2020-2033 (USD Billion)
17. North America Active Pharmaceutical Ingredients (API) Market, By Application, 2020-2033 (USD Billion)
18. U.S. Active Pharmaceutical Ingredients (API) Market, By Business Mode, 2020-2033 (USD Billion)
19. U.S. Active Pharmaceutical Ingredients (API) Market, By Synthesis Type, 2020-2033 (USD Billion)
20. U.S. Active Pharmaceutical Ingredients (API) Market, By Application, 2020-2033 (USD Billion)
21. Canada Active Pharmaceutical Ingredients (API) Market, By Business Mode, 2020-2033 (USD Billion)
22. Canada Active Pharmaceutical Ingredients (API) Market, By Synthesis Type, 2020-2033 (USD Billion)
23. Canada Active Pharmaceutical Ingredients (API) Market, By Application, 2020-2033 (USD Billion)
24. Mexico Active Pharmaceutical Ingredients (API) Market, By Business Mode, 2020-2033 (USD Billion)
25. Mexico Active Pharmaceutical Ingredients (API) Market, By Synthesis Type, 2020-2033 (USD Billion)
26. Mexico Active Pharmaceutical Ingredients (API) Market, By Application, 2020-2033 (USD Billion)
27. Europe Active Pharmaceutical Ingredients (API) Market, By Business Mode, 2020-2033 (USD Billion)
28. Europe Active Pharmaceutical Ingredients (API) Market, By Synthesis Type, 2020-2033 (USD Billion)
29. Europe Active Pharmaceutical Ingredients (API) Market, By Application, 2020-2033 (USD Billion)
30. Germany Active Pharmaceutical Ingredients (API) Market, By Business Mode, 2020-2033 (USD Billion)
31. Germany Active Pharmaceutical Ingredients (API) Market, By Synthesis Type, 2020-2033 (USD Billion)
32. Germany Active Pharmaceutical Ingredients (API) Market, By Application, 2020-2033 (USD Billion)
33. France Active Pharmaceutical Ingredients (API) Market, By Business Mode, 2020-2033 (USD Billion)
34. France Active Pharmaceutical Ingredients (API) Market, By Synthesis Type, 2020-2033 (USD Billion)
35. France Active Pharmaceutical Ingredients (API) Market, By Application, 2020-2033 (USD Billion)
36. U.K. Active Pharmaceutical Ingredients (API) Market, By Business Mode, 2020-2033 (USD Billion)
37. U.K. Active Pharmaceutical Ingredients (API) Market, By Synthesis Type, 2020-2033 (USD Billion)
38. U.K. Active Pharmaceutical Ingredients (API) Market, By Application, 2020-2033 (USD Billion)
39. Italy Active Pharmaceutical Ingredients (API) Market, By Business Mode, 2020-2033 (USD Billion)
40. Italy Active Pharmaceutical Ingredients (API) Market, By Synthesis Type, 2020-2033 (USD Billion)
41. Italy Active Pharmaceutical Ingredients (API) Market, By Application, 2020-2033 (USD Billion)
42. Spain Active Pharmaceutical Ingredients (API) Market, By Business Mode, 2020-2033 (USD Billion)
43. Spain Active Pharmaceutical Ingredients (API) Market, By Synthesis Type, 2020-2033 (USD Billion)
44. Spain Active Pharmaceutical Ingredients (API) Market, By Application, 2020-2033 (USD Billion)
45. Asia Pacific Active Pharmaceutical Ingredients (API) Market, By Business Mode, 2020-2033 (USD Billion)
46. Asia Pacific Active Pharmaceutical Ingredients (API) Market, By Synthesis Type, 2020-2033 (USD Billion)
47. Asia Pacific Active Pharmaceutical Ingredients (API) Market, By Application, 2020-2033 (USD Billion)
48. Japan Active Pharmaceutical Ingredients (API) Market, By Business Mode, 2020-2033 (USD Billion)
49. Japan Active Pharmaceutical Ingredients (API) Market, By Synthesis Type, 2020-2033 (USD Billion)
50. Japan Active Pharmaceutical Ingredients (API) Market, By Application, 2020-2033 (USD Billion)
51. China Active Pharmaceutical Ingredients (API) Market, By Business Mode, 2020-2033 (USD Billion)
52. China Active Pharmaceutical Ingredients (API) Market, By Synthesis Type, 2020-2033 (USD Billion)
53. China Active Pharmaceutical Ingredients (API) Market, By Application, 2020-2033 (USD Billion)
54. India Active Pharmaceutical Ingredients (API) Market, By Business Mode, 2020-2033 (USD Billion)
55. India Active Pharmaceutical Ingredients (API) Market, By Synthesis Type, 2020-2033 (USD Billion)
56. India Active Pharmaceutical Ingredients (API) Market, By Application, 2020-2033 (USD Billion)
57. South America Active Pharmaceutical Ingredients (API) Market, By Business Mode, 2020-2033 (USD Billion)
58. South America Active Pharmaceutical Ingredients (API) Market, By Synthesis Type, 2020-2033 (USD Billion)
59. South America Active Pharmaceutical Ingredients (API) Market, By Application, 2020-2033 (USD Billion)
60. Brazil Active Pharmaceutical Ingredients (API) Market, By Business Mode, 2020-2033 (USD Billion)
61. Brazil Active Pharmaceutical Ingredients (API) Market, By Synthesis Type, 2020-2033 (USD Billion)
62. Brazil Active Pharmaceutical Ingredients (API) Market, By Application, 2020-2033 (USD Billion)
63. Middle East and Africa Active Pharmaceutical Ingredients (API) Market, By Business Mode, 2020-2033 (USD Billion)
64. Middle East and Africa Active Pharmaceutical Ingredients (API) Market, By Synthesis Type, 2020-2033 (USD Billion)
65. Middle East and Africa Active Pharmaceutical Ingredients (API) Market, By Application, 2020-2033 (USD Billion)
66. UAE Active Pharmaceutical Ingredients (API) Market, By Business Mode, 2020-2033 (USD Billion)
67. UAE Active Pharmaceutical Ingredients (API) Market, By Synthesis Type, 2020-2033 (USD Billion)
68. UAE Active Pharmaceutical Ingredients (API) Market, By Application, 2020-2033 (USD Billion)
69. South Africa Active Pharmaceutical Ingredients (API) Market, By Business Mode, 2020-2033 (USD Billion)
70. South Africa Active Pharmaceutical Ingredients (API) Market, By Synthesis Type, 2020-2033 (USD Billion)
71. South Africa Active Pharmaceutical Ingredients (API) Market, By Application, 2020-2033 (USD Billion)
List of Figures
1. Global Active Pharmaceutical Ingredients (API) Market Segmentation
2. Global Active Pharmaceutical Ingredients (API) Market: Research Methodology
3. Market Size Estimation Methodology: Bottom-Up Approach
4. Market Size Estimation Methodology: Top-Down Approach
5. Data Triangulation
6. Porter’s Five Forces Analysis
7. Value Chain Analysis
8. Global Active Pharmaceutical Ingredients (API) Market Attractiveness Analysis By Business Mode
9. Global Active Pharmaceutical Ingredients (API) Market Attractiveness Analysis By Synthesis Type
10. Global Active Pharmaceutical Ingredients (API) Market Attractiveness Analysis By Application
11. Global Active Pharmaceutical Ingredients (API) Market Attractiveness Analysis By Region
12. Global Active Pharmaceutical Ingredients (API) Market: Dynamics
13. Global Active Pharmaceutical Ingredients (API) Market Share By Business Mode (2023 & 2033)
14. Global Active Pharmaceutical Ingredients (API) Market Share By Synthesis Type (2023 & 2033)
15. Global Active Pharmaceutical Ingredients (API) Market Share By Application (2023 & 2033)
16. Global Active Pharmaceutical Ingredients (API) Market Share By Regions (2023 & 2033)
17. Global Active Pharmaceutical Ingredients (API) Market Share By Company (2023)
This study forecasts global, regional, and country revenue from 2020 to 2033. The Brainy Insights has categorized the global active pharmaceutical ingredients (API) market based on the below-mentioned segments:
Global Active Pharmaceutical Ingredients (API) Market by Business Mode:
Global Active Pharmaceutical Ingredients (API) Market by Synthesis Type:
Global Active Pharmaceutical Ingredients (API) Market by Application:
Global Active Pharmaceutical Ingredients (API) Market by Region:
Research has its special purpose to undertake marketing efficiently. In this competitive scenario, businesses need information across all industry verticals; the information about customer wants, market demand, competition, industry trends, distribution channels etc. This information needs to be updated regularly because businesses operate in a dynamic environment. Our organization, The Brainy Insights incorporates scientific and systematic research procedures in order to get proper market insights and industry analysis for overall business success. The analysis consists of studying the market from a miniscule level wherein we implement statistical tools which helps us in examining the data with accuracy and precision.
Our research reports feature both; quantitative and qualitative aspects for any market. Qualitative information for any market research process are fundamental because they reveal the customer needs and wants, usage and consumption for any product/service related to a specific industry. This in turn aids the marketers/investors in knowing certain perceptions of the customers. Qualitative research can enlighten about the different product concepts and designs along with unique service offering that in turn, helps define marketing problems and generate opportunities. On the other hand, quantitative research engages with the data collection process through interviews, e-mail interactions, surveys and pilot studies. Quantitative aspects for the market research are useful to validate the hypotheses generated during qualitative research method, explore empirical patterns in the data with the help of statistical tools, and finally make the market estimations.
The Brainy Insights offers comprehensive research and analysis, based on a wide assortment of factual insights gained through interviews with CXOs and global experts and secondary data from reliable sources. Our analysts and industry specialist assume vital roles in building up statistical tools and analysis models, which are used to analyse the data and arrive at accurate insights with exceedingly informative research discoveries. The data provided by our organization have proven precious to a diverse range of companies, facilitating them to address issues such as determining which products/services are the most appealing, whether or not customers use the product in the manner anticipated, the purchasing intentions of the market and many others.
Our research methodology encompasses an idyllic combination of primary and secondary initiatives. Key phases involved in this process are listed below:

The phase involves the gathering and collecting of market data and its related information with the help of different sources & research procedures.

The data procurement stage involves in data gathering and collecting through various data sources.
This stage involves in extensive research. These data sources includes:
Purchased Database: Purchased databases play a crucial role in estimating the market sizes irrespective of the domain. Our purchased database includes:
Primary Research: The Brainy Insights interacts with leading companies and experts of the concerned domain to develop the analyst team’s market understanding and expertise. It improves and substantiates every single data presented in the market reports. Primary research mainly involves in telephonic interviews, E-mail interactions and face-to-face interviews with the raw material providers, manufacturers/producers, distributors, & independent consultants. The interviews that we conduct provides valuable data on market size and industry growth trends prevailing in the market. Our organization also conducts surveys with the various industry experts in order to gain overall insights of the industry/market. For instance, in healthcare industry we conduct surveys with the pharmacists, doctors, surgeons and nurses in order to gain insights and key information of a medical product/device/equipment which the customers are going to usage. Surveys are conducted in the form of questionnaire designed by our own analyst team. Surveys plays an important role in primary research because surveys helps us to identify the key target audiences of the market. Additionally, surveys helps to identify the key target audience engaged with the market. Our survey team conducts the survey by targeting the key audience, thus gaining insights from them. Based on the perspectives of the customers, this information is utilized to formulate market strategies. Moreover, market surveys helps us to understand the current competitive situation of the industry. To be precise, our survey process typically involve with the 360 analysis of the market. This analytical process begins by identifying the prospective customers for a product or service related to the market/industry to obtain data on how a product/service could fit into customers’ lives.

Secondary Research: The secondary data sources includes information published by the on-profit organizations such as World bank, WHO, company fillings, investor presentations, annual reports, national government documents, statistical databases, blogs, articles, white papers and others. From the annual report, we analyse a company’s revenue to understand the key segment and market share of that organization in a particular region. We analyse the company websites and adopt the product mapping technique which is important for deriving the segment revenue. In the product mapping method, we select and categorize the products offered by the companies catering to domain specific market, deduce the product revenue for each of the companies so as to get overall estimation of the market size. We also source data and analyses trends based on information received from supply side and demand side intermediaries in the value chain. The supply side denotes the data gathered from supplier, distributor, wholesaler and the demand side illustrates the data gathered from the end customers for respective market domain.

The supply side for a domain specific market is analysed by:
The demand side for the market is estimated through:
In-house Library: Apart from these third-party sources, we have our in-house library of qualitative and quantitative information. Our in-house database includes market data for various industry and domains. These data are updated on regular basis as per the changing market scenario. Our library includes, historic databases, internal audit reports and archives.
Sometimes there are instances where there is no metadata or raw data available for any domain specific market. For those cases, we use our expertise to forecast and estimate the market size in order to generate comprehensive data sets. Our analyst team adopt a robust research technique in order to produce the estimates:
Data Synthesis: This stage involves the analysis & mapping of all the information obtained from the previous step. It also involves in scrutinizing the data for any discrepancy observed while data gathering related to the market. The data is collected with consideration to the heterogeneity of sources. Robust scientific techniques are in place for synthesizing disparate data sets and provide the essential contextual information that can orient market strategies. The Brainy Insights has extensive experience in data synthesis where the data passes through various stages:


Market Deduction & Formulation: The final stage comprises of assigning data points at appropriate market spaces so as to deduce feasible conclusions. Analyst perspective & subject matter expert based holistic form of market sizing coupled with industry analysis also plays a crucial role in this stage.
This stage involves in finalization of the market size and numbers that we have collected from data integration step. With data interpolation, it is made sure that there is no gap in the market data. Successful trend analysis is done by our analysts using extrapolation techniques, which provide the best possible forecasts for the market.
Data Validation & Market Feedback: Validation is the most important step in the process. Validation & re-validation via an intricately designed process helps us finalize data-points to be used for final calculations.

The Brainy Insights interacts with leading companies and experts of the concerned domain to develop the analyst team’s market understanding and expertise. It improves and substantiates every single data presented in the market reports. The data validation interview and discussion panels are typically composed of the most experienced industry members. The participants include, however, are not limited to:
Moreover, we always validate our data and findings through primary respondents from all the major regions we are working on.


Free Customization
Fortune 500 Clients
Free Yearly Update On Purchase Of Multi/Corporate License
Companies Served Till Date