- +1-315-215-1633
- sales@thebrainyinsights.com

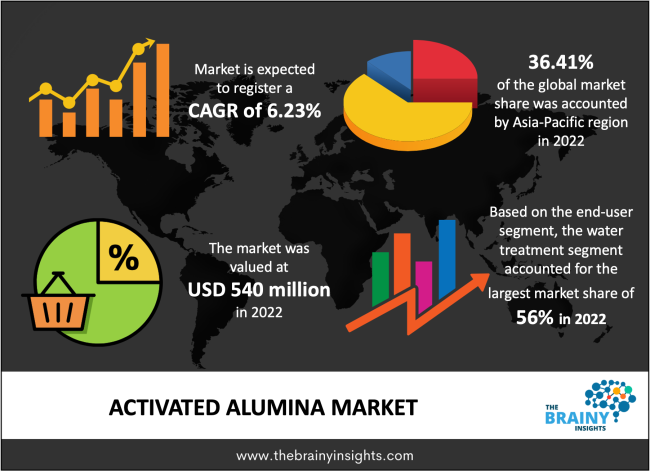
The global activated alumina market is expected to grow from USD 540 million in 2022 to USD 875.73 million by 2030, at a CAGR of 6.23% during the forecast period 2022-2030. The increasing oil & exploration activities will propel the market's growth in the forecast period.
The earth is bestowed with several minerals extracted to be used by humankind for their needs. The minerals occur naturally in the rocks of landforms. The rocks which have a significant amount of one mineral that can be extracted in a commercially viable method are called ore. Alumina is a natural or synthetic aluminium oxide or oxide of aluminium. Activated alumina is a form of aluminium oxide that is reduced to small porous spheres/circles at a microscopic level that have the ability to adsorb liquids and gases without changing their shape. They are highly porous and adsorbent. Activated alumina adsorbs gases and liquids, meaning it binds itself with the gas and liquid particles, respectively and cannot be separated without considerable heat being provided to it. For instance, the adsorption property of activated alumina is used to transport gases without any leakage whatsoever. Other examples of activated alumina are its use in cleaning contaminated water bodies by removing toxic waste from them. The toxic substances bind to activated alumina and do not leak back into the environment, thereby, aiding in eliminating contamination. It is lightweight with a larger surface area allowing it to adsorb more particles without getting heavy. It is also used as a catalyst, given its stable nature. The stable nature allows it to retain its original chemistry. It is extensively used in the industrial sector to produce hydrogen peroxide, gasoline and natural gas. It is used to reduce humidity effectively from the air, or wherever required. The multiple applications of activated alumina make it a highly regarded and demanded substance in the global market. Rapid urbanization will continue to drive the demand for activated alumina in the future, thereby propelling the market's growth.
Get an overview of this study by requesting a free sample
May 2022 - Atlanta, Georgia-based PureAir Filtration, LLC - A novel activated alumina and carbon chemical-adsorbent media called Sulphasorb 2, which this company introduced, lowers the risk of carbon-bed fires in paper mills and other crucial areas. This improved chemisorbent material was created in response to fire safety issues in paper mills that contain corrosive gases. Over the years, serious explosions and fires have occurred at paper mills due to improper upkeep of air purifying systems and a failure to adhere to risk-reduction protocols. According to the company, Sulphasorb 2 significantly lowers the fire risk by employing a proprietary caustic blend that combines activated alumina and carbon.
The increasing demand for water treatment – The need for potable water has increased due to the expanding global population. Increasing urbanization and industrialization are also contributing to the global demand for water. Water is also used in manufacturing, building, commercial and residential sectors. The world's freshwater resources are currently insufficient to meet rising water demand. These resources have already been overused, which has caused depletion and a global water shortage. The insufficiency of freshwater resources or water bodies fit for human consumption stems from water contamination by anthropogenic activities. For instance, the extensive use of fertilizers, herbicides and insecticides to protect and increase the yield of crops has led to groundwater contamination as these chemicals seep into the ground during rains. Also, the chemicals are washed away with soil particles by rainwater running off to meet the streams and other water bodies, contaminating them. Since freshwater resources are limited, decontaminating them in the face of scarcity is the ideal choice to meet human needs. Therefore, the global activated alumina market will rise due to increasing water decontamination demands.
Volatile prices of aluminium hydroxide – aluminium hydroxide is used to produce aluminium oxide. However, the volatility in prices of aluminium hydroxide can hamper the market's growth. The volatility can result from changing geopolitical situations, trade wars, supply chain bottlenecks or other production barriers. For instance, the pandemic induced cross-border closures, restrictions, and lockdowns resulting in a sudden halt to economic activity. The resulting supply chain bottlenecks negatively impacted all industries. Similarly, the energy crisis due to the Russia-Ukraine war has also limited market growth.
Rising demand for fuel – The Russia-Ukraine war has resulted in a global energy crisis. The flurry of activities by the western governments to explore new oil & gas exploration sites to stabilize the market is a positive development for the market. For example, the historical deal between Lebanon and Israel brokered by the US defining the mining rights of the coast of their borders will increase oil & gas exploration activities. Rapid urbanization will also increase fuel demand and offer prospective opportunities to the globally activated alumina market.
Stringent government regulations – Activated alumina must be used in a specific amount to avoid its negative effects. High or prolonged exposure to activated alumina can irritate the respiratory tract and eyes. This may lead to coughing and breathing difficulties. It impacts the health of individuals and results in the degradation of their quality of life. Therefore, the activated alumina market is regulated with strict guidelines and preventive and safety measures to protect the workers and the general public. The stringent government regulations can challenge the growth of the market.
The regions analyzed for the market include North America, Europe, South America, Asia Pacific, the Middle East, and Africa. The Asia Pacific region emerged as the largest market for the global activated alumina market, with a 36.41% market revenue share in 2022. The increased populations of the region have led to an equal rise in demand for water. The water demand is driven by the households as well as commercial units of the region. Rapid urbanization and industrialization are also contributing to increasing water demands. However, the limited water supply, with a major portion contaminated by several factors, makes it difficult for the region to match the increasing demand. Therefore, the demand for water decontamination or purification is increasing in the region, boding well for the activated alumina market. For example, the Swachh Bharat Mission of the union government of India specifically defines the country's aim to provide clean water to citizens. It lists water decontamination as one of the measures to be followed to achieve water sanitation to reduce diseases and enhance the health of the citizens. Such government initiatives are a positive development for the activated alumina market. Furthermore, the energy crisis due to the Russia-Ukraine war has encouraged the regional governments to fasten their pace of exploring oil & gas fields to source fuel domestically and save public money. The increase in oil & gas exploration activities will also propel the market's growth.
Asia Pacific Region Activated Alumina Market Share in 2022 - 36.41%
www.thebrainyinsights.com
Check the geographical analysis of this market by requesting a free sample
The application segment is divided into desiccants, adsorbents, catalysts and others. The adsorbent segment dominated the market with a revenue share of around 42% in 2022. The highly porous nature of activated alumina with a high surface area allows it to effectively adsorb gas and liquid particles. It is a stable compound which does not change its chemical nature, meaning it does not react with the particles or elements it adsorbs. Therefore, its numerous properties activated alumina as an adsorbent is used in several industries or applications. The most significant use of activated alumina as an adsorbent is water decontamination. It is highly effective in removing fluoride, lead, arsenic and other toxic chemicals from contaminated water. It is used to eliminate toxic chemicals from large water bodies as well. It is a cost-effective decontamination method. It is also used to purify the air, and given the increasing air pollution, the market for activated alumina adsorbent is bound to increase. It is also used to reduce moisture. Activated alumina as an adsorbent is also used to transport gases, effectively eliminating the chance of leakage.
The end-user segment is divided into oil & gas, chemical, textile, water treatment, pharmaceutical, and others. The water treatment segment dominated the market with a market share of around 56% in 2022. The overexploitation and contamination of freshwater bodies globally have led to water scarcity. The limited water supply is reduced further, given the extensive contamination of water bodies by anthropogenic activities. The increasing water demand has led to the rising need for water treatment. The growing urbanization has increased municipal authorities' demand for water treatment to offer clean water to citizens. Stringent government regulations mandating industrial units to treat used water before dispelling them into the water bodies have also increased the demand for water treatment. Activated alumina is a highly effective substance in removing toxins or contaminants like fluorides from water. They are a cost-effective approach towards water treatment, thereby explaining the dominance of the segment in the market.
| Attribute | Description |
|---|---|
| Market Size | Revenue (USD Million) |
| Market size value in 2022 | USD 540 Million |
| Market size value in 2030 | USD 875.73 Million |
| CAGR (2022 to 2030) | 6.23% |
| Historical data | 2019-2020 |
| Base Year | 2021 |
| Forecast | 2022-2030 |
| Segments | The research segment is based on application and end user. |
| Regional Segments | The regions examined for the market are Europe, Asia Pacific, North America, South America, and Middle East & Africa. |
As per The Brainy Insights, the size of the activated alumina market was valued at USD 540 million in 2022 to USD 875.73 million by 2030.
Global activated alumina market is growing at a CAGR of 6.23% during the forecast period 2022-2030.
The market's growth will be influenced by the increasing demand for water treatment.
Volatile prices of aluminium hydroxide could hamper the market growth.
1. Introduction
1.1. Objectives of the Study
1.2. Market Definition
1.3. Research Scope
1.4. Currency
1.5. Key Target Audience
2. Research Methodology and Assumptions
3. Executive Summary
4. Premium Insights
4.1. Porter’s Five Forces Analysis
4.2. Value Chain Analysis
4.3. Top Investment Pockets
4.3.1. Market Attractiveness Analysis By Application
4.3.2. Market Attractiveness Analysis By End User
4.3.3. Market Attractiveness Analysis By Region
4.4. Industry Trends
5. Market Dynamics
5.1. Market Evaluation
5.2. Drivers
5.2.1. The increasing demand for water treatment
5.3. Restraints
5.3.1. Volatile prices of aluminium hydroxide
5.4. Opportunities
5.4.1. Rising demand for fuel
5.5. Challenges
5.5.1. Stringent government regulations
6. Global Activated Alumina Market Analysis and Forecast, By Application
6.1. Segment Overview
6.2. Desiccants
6.3. Adsorbents
6.4. Catalysts
6.5. Others
7. Global Activated Alumina Market Analysis and Forecast, By End User
7.1. Segment Overview
7.2. Oil & Gas
7.3. Chemical
7.4. Textile
7.5. Water Treatment
7.6. Pharmaceutical
7.7. Others
8. Global Activated Alumina Market Analysis and Forecast, By Regional Analysis
8.1. Segment Overview
8.2. North America
8.2.1. U.S.
8.2.2. Canada
8.2.3. Mexico
8.3. Europe
8.3.1. Germany
8.3.2. France
8.3.3. U.K.
8.3.4. Italy
8.3.5. Spain
8.4. Asia-Pacific
8.4.1. Japan
8.4.2. China
8.4.3. India
8.5. South America
8.5.1. Brazil
8.6. Middle East and Africa
8.6.1. UAE
8.6.2. South Africa
9. Global Activated Alumina Market-Competitive Landscape
9.1. Overview
9.2. Market Share of Key Players in the Activated Alumina Market
9.2.1. Global Company Market Share
9.2.2. North America Company Market Share
9.2.3. Europe Company Market Share
9.2.4. APAC Company Market Share
9.3. Competitive Situations and Trends
9.3.1. Product Launches and Developments
9.3.2. Partnerships, Collaborations, and Agreements
9.3.3. Mergers & Acquisitions
9.3.4. Expansions
10. Company Profiles
10.1. Axens SA
10.1.1. Business Overview
10.1.2. Company Snapshot
10.1.3. Company Market Share Analysis
10.1.4. Company Product Portfolio
10.1.5. Recent Developments
10.1.6. SWOT Analysis
10.2. BASF SE
10.2.1. Business Overview
10.2.2. Company Snapshot
10.2.3. Company Market Share Analysis
10.2.4. Company Product Portfolio
10.2.5. Recent Developments
10.2.6. SWOT Analysis
10.3. Camfil
10.3.1. Business Overview
10.3.2. Company Snapshot
10.3.3. Company Market Share Analysis
10.3.4. Company Product Portfolio
10.3.5. Recent Developments
10.3.6. SWOT Analysis
10.4. CHALCO Shandong Advanced Materials Co. Ltd.
10.4.1. Business Overview
10.4.2. Company Snapshot
10.4.3. Company Market Share Analysis
10.4.4. Company Product Portfolio
10.4.5. Recent Developments
10.4.6. SWOT Analysis
10.5. DYNAMIC Adsorbents Inc.
10.5.1. Business Overview
10.5.2. Company Snapshot
10.5.3. Company Market Share Analysis
10.5.4. Company Product Portfolio
10.5.5. Recent Developments
10.5.6. SWOT Analysis
10.6. Honeywell International Inc.
10.6.1. Business Overview
10.6.2. Company Snapshot
10.6.3. Company Market Share Analysis
10.6.4. Company Product Portfolio
10.6.5. Recent Developments
10.6.6. SWOT Analysis
10.7. Huber Engineered Materials
10.7.1. Business Overview
10.7.2. Company Snapshot
10.7.3. Company Market Share Analysis
10.7.4. Company Product Portfolio
10.7.5. Recent Developments
10.7.6. SWOT Analysis
10.8. Porocel Industries LLC
10.8.1. Business Overview
10.8.2. Company Snapshot
10.8.3. Company Market Share Analysis
10.8.4. Company Product Portfolio
10.8.5. Recent Developments
10.8.6. SWOT Analysis
10.9. Sorbead India
10.9.1. Business Overview
10.9.2. Company Snapshot
10.9.3. Company Market Share Analysis
10.9.4. Company Product Portfolio
10.9.5. Recent Developments
10.9.6. SWOT Analysis
10.10. Sumitomo Chemicals Co. Ltd.
10.10.1. Business Overview
10.10.2. Company Snapshot
10.10.3. Company Market Share Analysis
10.10.4. Company Component Portfolio
10.10.5. Recent Developments
10.10.6. SWOT Analysis
List of Table
1. Global Activated Alumina Market, By Application, 2019-2030 (USD Million)
2. Global Desiccants Activated Alumina Market, By Region, 2019-2030 (USD Million)
3. Global Adsorbents Activated Alumina Market, By Region, 2019-2030 (USD Million)
4. Global Catalysts Activated Alumina Market, By Region, 2019-2030 (USD Million)
5. Global Others Activated Alumina Market, By Region, 2019-2030 (USD Million)
6. Global Activated Alumina Market, By End User, 2019-2030 (USD Million)
7. Global Oil & Gas Activated Alumina Market, By Region, 2019-2030 (USD Million)
8. Global Chemical Activated Alumina Market, By Region, 2019-2030 (USD Million)
9. Global Textile Activated Alumina Market, By Region, 2019-2030 (USD Million)
10. Global Water Treatment Activated Alumina Market, By Region, 2019-2030 (USD Million)
11. Global Pharmaceutical Activated Alumina Market, By Region, 2019-2030 (USD Million)
12. Global Others Activated Alumina Market, By Region, 2019-2030 (USD Million)
13. Global Activated Alumina Market, By Region, 2019-2030 (USD Million)
14. North America Activated Alumina Market, By Application, 2019-2030 (USD Million)
15. North America Activated Alumina Market, By End User, 2019-2030 (USD Million)
16. U.S. Activated Alumina Market, By Application, 2019-2030 (USD Million)
17. U.S. Activated Alumina Market, By End User, 2019-2030 (USD Million)
18. Canada Activated Alumina Market, By Application, 2019-2030 (USD Million)
19. Canada Activated Alumina Market, By End User, 2019-2030 (USD Million)
20. Mexico Activated Alumina Market, By Application, 2019-2030 (USD Million)
21. Mexico Activated Alumina Market, By End User, 2019-2030 (USD Million)
22. Europe Activated Alumina Market, By Application, 2019-2030 (USD Million)
23. Europe Activated Alumina Market, By End User, 2019-2030 (USD Million)
24. Germany Activated Alumina Market, By Application, 2019-2030 (USD Million)
25. Germany Activated Alumina Market, By End User, 2019-2030 (USD Million)
26. France Activated Alumina Market, By Application, 2019-2030 (USD Million)
27. France Activated Alumina Market, By End User, 2019-2030 (USD Million)
28. U.K. Activated Alumina Market, By Application, 2019-2030 (USD Million)
29. U.K. Activated Alumina Market, By End User, 2019-2030 (USD Million)
30. Italy Activated Alumina Market, By Application, 2019-2030 (USD Million)
31. Italy Activated Alumina Market, By End User, 2019-2030 (USD Million)
32. Spain Activated Alumina Market, By Application, 2019-2030 (USD Million)
33. Spain Activated Alumina Market, By End User, 2019-2030 (USD Million)
34. Asia Pacific Activated Alumina Market, By Application, 2019-2030 (USD Million)
35. Asia Pacific Activated Alumina Market, By End User, 2019-2030 (USD Million)
36. Japan Activated Alumina Market, By Application, 2019-2030 (USD Million)
37. Japan Activated Alumina Market, By End User, 2019-2030 (USD Million)
38. China Activated Alumina Market, By Application, 2019-2030 (USD Million)
39. China Activated Alumina Market, By End User, 2019-2030 (USD Million)
40. India Activated Alumina Market, By Application, 2019-2030 (USD Million)
41. India Activated Alumina Market, By End User, 2019-2030 (USD Million)
42. South America Activated Alumina Market, By Application, 2019-2030 (USD Million)
43. South America Activated Alumina Market, By End User, 2019-2030 (USD Million)
44. Brazil Activated Alumina Market, By Application, 2019-2030 (USD Million)
45. Brazil Activated Alumina Market, By End User, 2019-2030 (USD Million)
46. Middle East and Africa Activated Alumina Market, By Application, 2019-2030 (USD Million)
47. Middle East and Africa Activated Alumina Market, By End User, 2019-2030 (USD Million)
48. UAE Activated Alumina Market, By Application, 2019-2030 (USD Million)
49. UAE Activated Alumina Market, By End User, 2019-2030 (USD Million)
50. South Africa Activated Alumina Market, By Application, 2019-2030 (USD Million)
51. South Africa Activated Alumina Market, By End User, 2019-2030 (USD Million)
List of Figures
1. Global Activated Alumina Market Segmentation
2. Activated Alumina Market: Research Methodology
3. Market Size Estimation Methodology: Bottom-Up Approach
4. Market Size Estimation Methodology: Top-Down Approach
5. Data Triangulation
6. Porter’s Five Forces Analysis
7. Value Chain Analysis
8. Global Activated Alumina Market Attractiveness Analysis By Application
9. Global Activated Alumina Market Attractiveness Analysis By End User
10. Global Activated Alumina Market Attractiveness Analysis By Region
11. Global Activated Alumina Market: Dynamics
12. Global Activated Alumina Market Share by Application (2022 & 2030)
13. Global Activated Alumina Market Share by End User (2022 & 2030)
14. Global Activated Alumina Market Share by Regions (2022 & 2030)
15. Global Activated Alumina Market Share by Company (2021)
This study forecasts revenue at global, regional, and country levels from 2019 to 2030. The Brainy Insights has segmented the activated alumina market based on below mentioned segments:
Activated Alumina Market by Application:
Activated Alumina Market by End User:
Activated Alumina Market by Region:
Research has its special purpose to undertake marketing efficiently. In this competitive scenario, businesses need information across all industry verticals; the information about customer wants, market demand, competition, industry trends, distribution channels etc. This information needs to be updated regularly because businesses operate in a dynamic environment. Our organization, The Brainy Insights incorporates scientific and systematic research procedures in order to get proper market insights and industry analysis for overall business success. The analysis consists of studying the market from a miniscule level wherein we implement statistical tools which helps us in examining the data with accuracy and precision.
Our research reports feature both; quantitative and qualitative aspects for any market. Qualitative information for any market research process are fundamental because they reveal the customer needs and wants, usage and consumption for any product/service related to a specific industry. This in turn aids the marketers/investors in knowing certain perceptions of the customers. Qualitative research can enlighten about the different product concepts and designs along with unique service offering that in turn, helps define marketing problems and generate opportunities. On the other hand, quantitative research engages with the data collection process through interviews, e-mail interactions, surveys and pilot studies. Quantitative aspects for the market research are useful to validate the hypotheses generated during qualitative research method, explore empirical patterns in the data with the help of statistical tools, and finally make the market estimations.
The Brainy Insights offers comprehensive research and analysis, based on a wide assortment of factual insights gained through interviews with CXOs and global experts and secondary data from reliable sources. Our analysts and industry specialist assume vital roles in building up statistical tools and analysis models, which are used to analyse the data and arrive at accurate insights with exceedingly informative research discoveries. The data provided by our organization have proven precious to a diverse range of companies, facilitating them to address issues such as determining which products/services are the most appealing, whether or not customers use the product in the manner anticipated, the purchasing intentions of the market and many others.
Our research methodology encompasses an idyllic combination of primary and secondary initiatives. Key phases involved in this process are listed below:

The phase involves the gathering and collecting of market data and its related information with the help of different sources & research procedures.

The data procurement stage involves in data gathering and collecting through various data sources.
This stage involves in extensive research. These data sources includes:
Purchased Database: Purchased databases play a crucial role in estimating the market sizes irrespective of the domain. Our purchased database includes:
Primary Research: The Brainy Insights interacts with leading companies and experts of the concerned domain to develop the analyst team’s market understanding and expertise. It improves and substantiates every single data presented in the market reports. Primary research mainly involves in telephonic interviews, E-mail interactions and face-to-face interviews with the raw material providers, manufacturers/producers, distributors, & independent consultants. The interviews that we conduct provides valuable data on market size and industry growth trends prevailing in the market. Our organization also conducts surveys with the various industry experts in order to gain overall insights of the industry/market. For instance, in healthcare industry we conduct surveys with the pharmacists, doctors, surgeons and nurses in order to gain insights and key information of a medical product/device/equipment which the customers are going to usage. Surveys are conducted in the form of questionnaire designed by our own analyst team. Surveys plays an important role in primary research because surveys helps us to identify the key target audiences of the market. Additionally, surveys helps to identify the key target audience engaged with the market. Our survey team conducts the survey by targeting the key audience, thus gaining insights from them. Based on the perspectives of the customers, this information is utilized to formulate market strategies. Moreover, market surveys helps us to understand the current competitive situation of the industry. To be precise, our survey process typically involve with the 360 analysis of the market. This analytical process begins by identifying the prospective customers for a product or service related to the market/industry to obtain data on how a product/service could fit into customers’ lives.

Secondary Research: The secondary data sources includes information published by the on-profit organizations such as World bank, WHO, company fillings, investor presentations, annual reports, national government documents, statistical databases, blogs, articles, white papers and others. From the annual report, we analyse a company’s revenue to understand the key segment and market share of that organization in a particular region. We analyse the company websites and adopt the product mapping technique which is important for deriving the segment revenue. In the product mapping method, we select and categorize the products offered by the companies catering to domain specific market, deduce the product revenue for each of the companies so as to get overall estimation of the market size. We also source data and analyses trends based on information received from supply side and demand side intermediaries in the value chain. The supply side denotes the data gathered from supplier, distributor, wholesaler and the demand side illustrates the data gathered from the end customers for respective market domain.

The supply side for a domain specific market is analysed by:
The demand side for the market is estimated through:
In-house Library: Apart from these third-party sources, we have our in-house library of qualitative and quantitative information. Our in-house database includes market data for various industry and domains. These data are updated on regular basis as per the changing market scenario. Our library includes, historic databases, internal audit reports and archives.
Sometimes there are instances where there is no metadata or raw data available for any domain specific market. For those cases, we use our expertise to forecast and estimate the market size in order to generate comprehensive data sets. Our analyst team adopt a robust research technique in order to produce the estimates:
Data Synthesis: This stage involves the analysis & mapping of all the information obtained from the previous step. It also involves in scrutinizing the data for any discrepancy observed while data gathering related to the market. The data is collected with consideration to the heterogeneity of sources. Robust scientific techniques are in place for synthesizing disparate data sets and provide the essential contextual information that can orient market strategies. The Brainy Insights has extensive experience in data synthesis where the data passes through various stages:


Market Deduction & Formulation: The final stage comprises of assigning data points at appropriate market spaces so as to deduce feasible conclusions. Analyst perspective & subject matter expert based holistic form of market sizing coupled with industry analysis also plays a crucial role in this stage.
This stage involves in finalization of the market size and numbers that we have collected from data integration step. With data interpolation, it is made sure that there is no gap in the market data. Successful trend analysis is done by our analysts using extrapolation techniques, which provide the best possible forecasts for the market.
Data Validation & Market Feedback: Validation is the most important step in the process. Validation & re-validation via an intricately designed process helps us finalize data-points to be used for final calculations.

The Brainy Insights interacts with leading companies and experts of the concerned domain to develop the analyst team’s market understanding and expertise. It improves and substantiates every single data presented in the market reports. The data validation interview and discussion panels are typically composed of the most experienced industry members. The participants include, however, are not limited to:
Moreover, we always validate our data and findings through primary respondents from all the major regions we are working on.


Free Customization
Fortune 500 Clients
Free Yearly Update On Purchase Of Multi/Corporate License
Companies Served Till Date