- +1-315-215-1633
- sales@thebrainyinsights.com

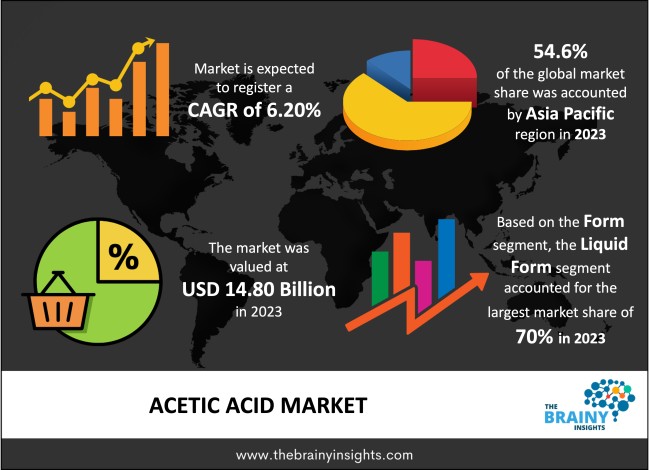
Global acetic acid market is anticipated to reach USD 27 billion by 2033, at a CAGR of 6.20% from 2024 to 2033. Global acetic acid market is witnessing a considerable growth owing to increasing demand for acetic acid from various end-user industries. Acetic Acid is a sour odor and pungent liquid. Acetic Acid is used in the manufacture of many types of chemicals, in the food industry, in the textile industry, and in other industries.
Acetic acid with the chemical formula (CH3COOH), also known as ethanoic acid, is a colourless organic compound. It is a significant commodity chemical derived mostly from natural gas. The diluted form of acetic acid called as vinegar, which is the most common chemical substance available in the market. Acetic acid is used in various industry verticals, such as the agricultural (herbicide to control weeds), canning (flavouring for pickles), chemical (acidifier and neutralizer), textile and dye (nylon production, dye catalyst), food (preservative for livestock grains and hay), cosmetics (bleaching agent), and manufacturing industries (production of lacquers).
Acetic acid is used in the processing of metal acetates, vinyl acetate, cellulose acetate, and volatile organic esters (such as butyl and ethyl acetates), as well as widely used as solvents for paints, resins, and lacquers. Biologically, acetic acid is an essential metabolic intermediate, and it occurs naturally in plant juices in body fluids. Acetic acid is also used as a solvent in polyester fiber production and in the manufacturing of synthetic fibers and resins. As acetic acid kills microbes and fungus, it is commonly used for general disinfecting and combating mildew and found in several conventional cleaning products, such as mold and mildew cleaners, floor cleaners, window cleaners, surface cleaners, cleaning and dusting sprays, and roof cleaners, in the form of vinegar or as an ingredient by itself. Acetic acid has various uses in the healthcare and pharmaceutical including antiseptic against streptococci, enterococci, pseudomonas, staphylococci and others. It is also used in for the treatment of infections and cervical cancer screening. Further, it has wide usage as an agent to lyse red blood cells before white blood cells are examined. Apart from these, these acids popularly used in the making of perfumes, manufacturing of dyes and inks, and rubber and plastic.
Get an overview of this study by requesting a free sample
Rapid expansion of the textile industry is one of the key factors driving the growth acetic acid market. Globally, the textile industry is witnessing the high growth, owing to an increased standard of living, rising income levels in the developing countries, and changing fashion trends and customer preferences. Textile industry uses a variety of chemicals that are made using the acetic acid. In addition to this, the Asia Pacific region is boosting the growth of the market, owing to the high textile industry in China and India.
Acetic acid in the vinegar finds its use most commonly in commercial pickling operations, and in condiments like mustard, mayonnaise, and ketchup in the food industry. Apart from this, it is also used for seasoning various food items like pasta and salads. Additionally, vinegar can react with alkaline ingredients like baking soda, and when that happens, it produces a gas which helps to make baked goods become puffier.
Acetic acid is highly corrosive in the environment, particularly for the skin and eyes and at high concentration, it is harmful to the animals and plants. Acetic acid can also harmful for the human body and can damage internal organs if ingested or in the case of vapour inhalation. Thus, highly corrosive and harmful nature is anticipated to restrain the market growth.
The acetic acid market is witnessing the significant growth in the emerging countries. This is mainly due to emerging countries are observing rapid growth in the economy characterized by large scale expansion of chemicals, textile, and coatings manufacturing facilities. Thus, the increase in these industries in the emerging countries offers enormous growth prospect for the acetic acid market.
One of the significant problems in the acetic acid, the market is fluctuating raw material prices used in the production of the acid. Owing to this, many companies engaged in the production of acetic acid, are seeking an alternative option for profit margins, which in turn, they are unable to formulate their expansion plans for the acetic acid business segment. Thus, unpredictability in expansion plans are likely to restrain the growth of the acetic acid market over the forecast period.
The global acetic acid market has been classified based on form, manufacturing process, application, end-user industry, and regions.
The regions analysed for the market include North America, Europe, South America, Asia Pacific, and the Middle East and Africa. The Asia Pacific region emerged as the largest market for the acetic acid market, with a 54.6% share of the market revenue in 2023.
Asia Pacific Acetic Acid Market Share in 2023 - 54.6%
www.thebrainyinsights.com
Check the geographical analysis of this market by requesting a free sample
The key players are now concentrating on implementing strategies such as adopting new technology, product innovations, mergers & acquisitions, joint venture, alliances and partnerships to improve their market position in the global acetic acid industry.
In August 2018, BP and Eastman Chemical Company announced that both companies had signed an agreement, in which BP will take over sales and marketing of U.S. acetic acid made by Eastman Chemical.
In October 2019, BP signed a memorandum of understanding (MoU) with China’s Zhejiang Petroleum and Chemical Corporation (ZPCC) to establish a joint venture. Under the joint venture, the companies are planning to open an acetic acid plant in Zhoushan, China, with a production capacity of one million tonnes per annum (Mtpa).
As per The Brainy Insights, the size of the acetic acid market was valued at USD 14.80 billion in 2023 and is anticipated to reach USD 27 billion by 2033.
Global acetic acid market is growing at a CAGR of 6.20% during the forecast period 2024-2033.
The Asia Pacific region emerged as the largest market for the acetic acid.
Rapid expansion of textile industry across the globe is the key driving factor for the acetic acid market.
Highly corrosive nature of acetic acid could hamper the market growth.
The acetic acid market is witnessing the significant growth in the emerging countries.
Key players are Mitsubishi Chemical Corporation, Sinopec, Wacker Chemie, GNFC Limited, Saudi International Petrochemicals, DuPont, Eastman Chemical Company
1. Introduction
1.1. Objectives of the Study
1.2. Market Definition
1.3. Research Scope
1.4. Currency
1.5. Key Target Audience
2. Research Methodology and Assumptions
3. Executive Summary
4. Premium Insights
4.1. Porter’s Five Forces Analysis
4.2. Value Chain Analysis
4.3. Top Investment Pockets
4.3.1. Market Attractiveness Analysis By Form
4.3.2. Market Attractiveness Analysis By Manufacturing Process
4.3.3. Market Attractiveness Analysis By Application
4.3.4. Market Attractiveness Analysis By End User Industry
4.3.5. Market Attractiveness Analysis By Region
4.4. Industry Trends
5. Market Dynamics
5.1. Market Evaluation
5.2. Drivers
5.2.1. Rapid expansion of textile industry across the globe
5.2.2. Increasing demand in the food industry
5.3. Restrains
5.3.1. Highly corrosive nature of acetic acid could hamper the market growth
5.4. Opportunities
5.4.1. Opportunity to tap the emerging countries
5.5. Challenges
5.5.1. Fluctuating raw materials prices
6. Global Acetic Acid Market Analysis and Forecast, By Form
6.1. Segment Overview
6.2. Solid
6.3. Liquid
7. Global Acetic Acid Market Analysis and Forecast, By Manufacturing Process
7.1. Segment Overview
7.2. Synthetic Route
7.3. Biological Route
8. Global Acetic Acid Market Analysis and Forecast, By Application
8.1. Segment Overview
8.2. Vinyl Acetate Monomer
8.3. Purified Terephthalic Acid
8.4. Acetate Esters
8.5. Acetic Anhydride
8.6. Others
9. Global Acetic Acid Market Analysis and Forecast, By End User Industry
9.1. Segment Overview
9.2. Plastics And Polymers
9.3. Food And Beverage
9.4. Inks
9.5. Paints and Coatings
9.6. Chemicals
9.7. Others
10. Global Acetic Acid Market Analysis and Forecast, By Regional Analysis
10.1. Segment Overview
10.2. North America
10.2.1. U.S.
10.2.2. Canada
10.2.3. Mexico
10.3. Europe
10.3.1. Germany
10.3.2. France
10.3.3. U.K.
10.3.4. Italy
10.3.5. Spain
10.4. Asia-Pacific
10.4.1. Japan
10.4.2. China
10.4.3. India
10.5. South America
10.5.1. Brazil
10.6. Middle East and Africa
10.6.1. UAE
10.6.2. South Africa
11. Global Acetic Acid Market-Competitive Landscape
11.1. Overview
11.2. Market Share of Key Players in the Acetic Acid Market
11.2.1. Global Company Market Share
11.2.2. North America Company Market Share
11.2.3. Europe Company Market Share
11.2.4. APAC Company Market Share
11.3. Competitive Situations and Trends
11.3.1. Product Launches and Developments
11.3.2. Partnerships, Collaborations, and Agreements
11.3.3. Mergers & Acquisitions
11.3.4. Expansions
12. Company Profiles
12.1. Mitsubishi Chemical Corporation
12.1.1. Business Overview
12.1.2. Company Snapshot
12.1.3. Company Market Share Analysis
12.1.4. Company Product Portfolio
12.1.5. Recent Developments
12.1.6. SWOT Analysis
12.2. Sinopec
12.2.1. Business Overview
12.2.2. Company Snapshot
12.2.3. Company Market Share Analysis
12.2.4. Company Product Portfolio
12.2.5. Recent Developments
12.2.6. SWOT Analysis
12.3. Wacker Chemie
12.3.1. Business Overview
12.3.2. Company Snapshot
12.3.3. Company Market Share Analysis
12.3.4. Company Product Portfolio
12.3.5. Recent Developments
12.3.6. SWOT Analysis
12.4. GNFC Limited
12.4.1. Business Overview
12.4.2. Company Snapshot
12.4.3. Company Market Share Analysis
12.4.4. Company Product Portfolio
12.4.5. Recent Developments
12.4.6. SWOT Analysis
12.5. Saudi International Petrochemicals
12.5.1. Business Overview
12.5.2. Company Snapshot
12.5.3. Company Market Share Analysis
12.5.4. Company Product Portfolio
12.5.5. Recent Developments
12.5.6. SWOT Analysis
12.6. DuPont
12.6.1. Business Overview
12.6.2. Company Snapshot
12.6.3. Company Market Share Analysis
12.6.4. Company Product Portfolio
12.6.5. Recent Developments
12.6.6. SWOT Analysis
12.7. Eastman Chemical Company
12.7.1. Business Overview
12.7.2. Company Snapshot
12.7.3. Company Market Share Analysis
12.7.4. Company Product Portfolio
12.7.5. Recent Developments
12.7.6. SWOT Analysis
12.8. Daicel Corporation
12.8.1. Business Overview
12.8.2. Company Snapshot
12.8.3. Company Market Share Analysis
12.8.4. Company Product Portfolio
12.8.5. Recent Developments
12.8.6. SWOT Analysis
12.9. Jiangsu Sopo (Group)
12.9.1. Business Overview
12.9.2. Company Snapshot
12.9.3. Company Market Share Analysis
12.9.4. Company Product Portfolio
12.9.5. Recent Developments
12.9.6. SWOT Analysis
12.10. LyondellBasell
12.10.1. Business Overview
12.10.2. Company Snapshot
12.10.3. Company Market Share Analysis
12.10.4. Company Product Portfolio
12.10.5. Recent Developments
12.10.6. SWOT Analysis
List of Table
1. Global Acetic Acid Market, By Form, 2020–2033 (USD Billion) (Kilotons)
2. Global Solid Market, By Region, 2020–2033 (USD Billion) (Kilotons)
3. Global Liquid Market, By Region, 2020–2033 (USD Billion) (Kilotons)
4. Global Acetic Acid Market, By Manufacturing Process, 2020–2033 (USD Billion) (Kilotons)
5. Global Synthetic Route Acetic Acid Market, By Region, 2020–2033 (USD Billion) (Kilotons)
6. Global Biological Route Acetic Acid Market, By Region, 2020–2033 (USD Billion) (Kilotons)
7. Global Acetic Acid Market, By Application, 2020–2033 (USD Billion) (Kilotons)
8. Global Vinyl Acetate Monomer Acetic Acid Market, By Region, 2020–2033 (USD Billion) (Kilotons)
9. Global Purified Terephthalic Acid Acetic Acid Market, By Region, 2020–2033 (USD Billion) (Kilotons)
10. Global Acetate Esters Acetic Acid Market, By Region, 2020–2033 (USD Billion) (Kilotons)
11. Global Acetic Anhydride Acetic Acid Market, By Region, 2020–2033 (USD Billion) (Kilotons)
12. Global Others Acetic Acid Market, By Region, 2020–2033 (USD Billion) (Kilotons)
13. Global Acetic Acid Market, By End User Industry, 2020–2033 (USD Billion) (Kilotons)
14. Global Vinyl Acetate Monomer Acetic Acid Market, By Region, 2020–2033 (USD Billion) (Kilotons)
15. Global Plastics And Polymers Acetic Acid Market, By Region, 2020–2033 (USD Billion) (Kilotons)
16. Global Food And Beverage Acetic Acid Market, By Region, 2020–2033 (USD Billion) (Kilotons)
17. Global Inks Acetic Acid Market, By Region, 2020–2033 (USD Billion) (Kilotons)
18. Global Paints and Coatings Acetic Acid Market, By Region, 2020–2033 (USD Billion) (Kilotons)
19. Global Chemicals Acetic Acid Market, By Region, 2020–2033 (USD Billion) (Kilotons)
20. Global Others Acetic Acid Market, By Region, 2020–2033 (USD Billion) (Kilotons)
21. Global Synthetic Route Acetic Acid Market, By Region, 2020–2033 (USD Billion) (Kilotons)
22. Global Acetic Acid Market, By Region, 2020–2033 (USD Billion) (Kilotons)
23. Global Acetic Acid Market, By North America, 2020–2033 (USD Billion) (Kilotons)
24. North America Acetic Acid Market, By Form, 2020–2033 (USD Billion) (Kilotons)
25. North America Acetic Acid Market, By Manufacturing Process, 2020–2033 (USD Billion) (Kilotons)
26. North America Acetic Acid Market, By Application, 2020–2033 (USD Billion) (Kilotons)
27. North America Acetic Acid Market, By End User Industry, 2020–2033 (USD Billion) (Kilotons)
28. U.S. Acetic Acid Market, By Form, 2020–2033 (USD Billion) (Kilotons)
29. U.S. Acetic Acid Market, By Manufacturing Process, 2020–2033 (USD Billion) (Kilotons)
30. U.S. Acetic Acid Market, By Application, 2020–2033 (USD Billion) (Kilotons)
31. U.S. Acetic Acid Market, By End User Industry, 2020–2033 (USD Billion) (Kilotons)
32. Canada Acetic Acid Market, By Form, 2020–2033 (USD Billion) (Kilotons)
33. Canada Acetic Acid Market, By Manufacturing Process, 2020–2033 (USD Billion) (Kilotons)
34. Canada Acetic Acid Market, By Application, 2020–2033 (USD Billion) (Kilotons)
35. Canada Acetic Acid Market, By End User Industry, 2020–2033 (USD Billion) (Kilotons)
36. Mexico Acetic Acid Market, By Form, 2020–2033 (USD Billion) (Kilotons)
37. Mexico Acetic Acid Market, By Manufacturing Process, 2020–2033 (USD Billion) (Kilotons)
38. Mexico Acetic Acid Market, By Application, 2020–2033 (USD Billion) (Kilotons)
39. Mexico Acetic Acid Market, By End User Industry, 2020–2033 (USD Billion) (Kilotons)
40. Europe Acetic Acid Market, By Form, 2020–2033 (USD Billion) (Kilotons)
41. Europe Acetic Acid Market, By Manufacturing Process, 2020–2033 (USD Billion) (Kilotons)
42. Europe Acetic Acid Market, By Application, 2020–2033 (USD Billion) (Kilotons)
43. Europe Acetic Acid Market, By End User Industry, 2020–2033 (USD Billion) (Kilotons)
44. Germany Acetic Acid Market, By Form, 2020–2033 (USD Billion) (Kilotons)
45. Germany Acetic Acid Market, By Manufacturing Process, 2020–2033 (USD Billion) (Kilotons)
46. Germany Acetic Acid Market, By Application, 2020–2033 (USD Billion) (Kilotons)
47. Germany Acetic Acid Market, By End User Industry, 2020–2033 (USD Billion) (Kilotons)
48. France Acetic Acid Market, By Form, 2020–2033 (USD Billion) (Kilotons)
49. France Acetic Acid Market, By Manufacturing Process, 2020–2033 (USD Billion) (Kilotons)
50. France Acetic Acid Market, By Application, 2020–2033 (USD Billion) (Kilotons)
51. France Acetic Acid Market, By End User Industry, 2020–2033 (USD Billion) (Kilotons)
52. U.K. Acetic Acid Market, By Form, 2020–2033 (USD Billion) (Kilotons)
53. U.K. Acetic Acid Market, By Manufacturing Process, 2020–2033 (USD Billion) (Kilotons)
54. U.K. Acetic Acid Market, By Application, 2020–2033 (USD Billion) (Kilotons)
55. U.K. Acetic Acid Market, By End User Industry, 2020–2033 (USD Billion) (Kilotons)
56. Italy Acetic Acid Market, By Form, 2020–2033 (USD Billion) (Kilotons)
57. Italy Acetic Acid Market, By Manufacturing Process, 2020–2033 (USD Billion) (Kilotons)
58. Italy Acetic Acid Market, By Application, 2020–2033 (USD Billion) (Kilotons)
59. Italy Acetic Acid Market, By End User Industry, 2020–2033 (USD Billion) (Kilotons)
60. Spain Acetic Acid Market, By Form, 2020–2033 (USD Billion) (Kilotons)
61. Spain Acetic Acid Market, By Manufacturing Process, 2020–2033 (USD Billion) (Kilotons)
62. Spain Acetic Acid Market, By Application, 2020–2033 (USD Billion) (Kilotons)
63. Spain Acetic Acid Market, By End User Industry, 2020–2033 (USD Billion) (Kilotons)
64. Asia Pacific Acetic Acid Market, By Form, 2020–2033 (USD Billion) (Kilotons)
65. Asia Pacific Acetic Acid Market, By Manufacturing Process, 2020–2033 (USD Billion) (Kilotons)
66. Asia Pacific Acetic Acid Market, By Application, 2020–2033 (USD Billion) (Kilotons)
67. Asia Pacific Acetic Acid Market, By End User Industry, 2020–2033 (USD Billion) (Kilotons)
68. Japan Acetic Acid Market, By Form, 2020–2033 (USD Billion) (Kilotons)
69. Japan Acetic Acid Market, By Manufacturing Process, 2020–2033 (USD Billion) (Kilotons)
70. Japan Acetic Acid Market, By Application, 2020–2033 (USD Billion) (Kilotons)
71. Japan Acetic Acid Market, By End User Industry, 2020–2033 (USD Billion) (Kilotons)
72. China Acetic Acid Market, By Form, 2020–2033 (USD Billion) (Kilotons)
73. China Acetic Acid Market, By Manufacturing Process, 2020–2033 (USD Billion) (Kilotons)
74. China Acetic Acid Market, By Application, 2020–2033 (USD Billion) (Kilotons)
75. China Acetic Acid Market, By End User Industry, 2020–2033 (USD Billion) (Kilotons)
76. India Acetic Acid Market, By Form, 2020–2033 (USD Billion) (Kilotons)
77. India Acetic Acid Market, By Manufacturing Process, 2020–2033 (USD Billion) (Kilotons)
78. India Acetic Acid Market, By Application, 2020–2033 (USD Billion) (Kilotons)
79. India Acetic Acid Market, By End User Industry, 2020–2033 (USD Billion) (Kilotons)
80. South America Acetic Acid Market, By Form, 2020–2033 (USD Billion) (Kilotons)
81. South America Acetic Acid Market, By Manufacturing Process, 2020–2033 (USD Billion) (Kilotons)
82. South America Acetic Acid Market, By Application, 2020–2033 (USD Billion) (Kilotons)
83. South America Acetic Acid Market, By End User Industry, 2020–2033 (USD Billion) (Kilotons)
84. Brazil Acetic Acid Market, By Form, 2020–2033 (USD Billion) (Kilotons)
85. Brazil Acetic Acid Market, By Manufacturing Process, 2020–2033 (USD Billion) (Kilotons)
86. Brazil Acetic Acid Market, By Application, 2020–2033 (USD Billion) (Kilotons)
87. Brazil Acetic Acid Market, By End User Industry, 2020–2033 (USD Billion) (Kilotons)
88. Middle East and Africa Acetic Acid Market, By Form, 2020–2033 (USD Billion) (Kilotons)
89. Middle East and Africa Acetic Acid Market, By Manufacturing Process, 2020–2033 (USD Billion) (Kilotons)
90. Middle East and Africa Acetic Acid Market, By Application, 2020–2033 (USD Billion) (Kilotons)
91. Middle East and Africa Acetic Acid Market, By End User Industry, 2020–2033 (USD Billion) (Kilotons)
92. UAE Acetic Acid Market, By Form, 2020–2033 (USD Billion) (Kilotons)
93. UAE Acetic Acid Market, By Manufacturing Process, 2020–2033 (USD Billion) (Kilotons)
94. UAE Acetic Acid Market, By Application, 2020–2033 (USD Billion) (Kilotons)
95. UAE Acetic Acid Market, By End User Industry, 2020–2033 (USD Billion) (Kilotons)
96. South Africa Acetic Acid Market, By Form, 2020–2033 (USD Billion) (Kilotons)
97. South Africa Acetic Acid Market, By Manufacturing Process, 2020–2033 (USD Billion) (Kilotons)
98. South Africa Acetic Acid Market, By Application, 2020–2033 (USD Billion) (Kilotons)
99. South Africa Acetic Acid Market, By End User Industry, 2020–2033 (USD Billion) (Kilotons)
List of Figures
1. Global Acetic Acid Market Segmentation
2. Acetic Acid Market: Research Methodology
3. Market Size Estimation Methodology: Bottom-Up Approach
4. Market Size Estimation Methodology: Top-Down Approach
5. Data Triangulation
6. Porter’s Five Forces Analysis
7. Value Chain Analysis
8. Global Acetic Acid Market Attractiveness Analysis By Form
9. Global Acetic Acid Market Attractiveness Analysis By Manufacturing Process
10. Global Acetic Acid Market Attractiveness Analysis By Application
11. Global Acetic Acid Market Attractiveness Analysis By End User Industry
12. Global Acetic Acid Market Attractiveness Analysis By Region
13. Global Acetic Acid Market: Dynamics
14. Global Acetic Acid Market Share By Form (2023 & 2033)
15. Global Acetic Acid Market Share By Manufacturing Process (2023 & 2033)
16. Global Acetic Acid Market Share By Application (2023 & 2033)
17. Global Acetic Acid Market Share By End User Industry (2023 & 2033)
18. Global Acetic Acid Market Share by Regions (2023 & 2033)
19. Global Acetic Acid Market Share by Company (2023)
This study forecasts revenue at global, regional, and country levels from 2020 to 2033. The Brainy Insights has segmented the global acetic acid market on the basis of below mentioned segments:
Global Acetic Acid Market by Form:
Global Acetic Acid Market by Manufacturing Process:
Global Acetic Acid Market by Application:
Global Acetic Acid Market by End User Industry:
Global Acetic Acid Market by Region:
Research has its special purpose to undertake marketing efficiently. In this competitive scenario, businesses need information across all industry verticals; the information about customer wants, market demand, competition, industry trends, distribution channels etc. This information needs to be updated regularly because businesses operate in a dynamic environment. Our organization, The Brainy Insights incorporates scientific and systematic research procedures in order to get proper market insights and industry analysis for overall business success. The analysis consists of studying the market from a miniscule level wherein we implement statistical tools which helps us in examining the data with accuracy and precision.
Our research reports feature both; quantitative and qualitative aspects for any market. Qualitative information for any market research process are fundamental because they reveal the customer needs and wants, usage and consumption for any product/service related to a specific industry. This in turn aids the marketers/investors in knowing certain perceptions of the customers. Qualitative research can enlighten about the different product concepts and designs along with unique service offering that in turn, helps define marketing problems and generate opportunities. On the other hand, quantitative research engages with the data collection process through interviews, e-mail interactions, surveys and pilot studies. Quantitative aspects for the market research are useful to validate the hypotheses generated during qualitative research method, explore empirical patterns in the data with the help of statistical tools, and finally make the market estimations.
The Brainy Insights offers comprehensive research and analysis, based on a wide assortment of factual insights gained through interviews with CXOs and global experts and secondary data from reliable sources. Our analysts and industry specialist assume vital roles in building up statistical tools and analysis models, which are used to analyse the data and arrive at accurate insights with exceedingly informative research discoveries. The data provided by our organization have proven precious to a diverse range of companies, facilitating them to address issues such as determining which products/services are the most appealing, whether or not customers use the product in the manner anticipated, the purchasing intentions of the market and many others.
Our research methodology encompasses an idyllic combination of primary and secondary initiatives. Key phases involved in this process are listed below:

The phase involves the gathering and collecting of market data and its related information with the help of different sources & research procedures.

The data procurement stage involves in data gathering and collecting through various data sources.
This stage involves in extensive research. These data sources includes:
Purchased Database: Purchased databases play a crucial role in estimating the market sizes irrespective of the domain. Our purchased database includes:
Primary Research: The Brainy Insights interacts with leading companies and experts of the concerned domain to develop the analyst team’s market understanding and expertise. It improves and substantiates every single data presented in the market reports. Primary research mainly involves in telephonic interviews, E-mail interactions and face-to-face interviews with the raw material providers, manufacturers/producers, distributors, & independent consultants. The interviews that we conduct provides valuable data on market size and industry growth trends prevailing in the market. Our organization also conducts surveys with the various industry experts in order to gain overall insights of the industry/market. For instance, in healthcare industry we conduct surveys with the pharmacists, doctors, surgeons and nurses in order to gain insights and key information of a medical product/device/equipment which the customers are going to usage. Surveys are conducted in the form of questionnaire designed by our own analyst team. Surveys plays an important role in primary research because surveys helps us to identify the key target audiences of the market. Additionally, surveys helps to identify the key target audience engaged with the market. Our survey team conducts the survey by targeting the key audience, thus gaining insights from them. Based on the perspectives of the customers, this information is utilized to formulate market strategies. Moreover, market surveys helps us to understand the current competitive situation of the industry. To be precise, our survey process typically involve with the 360 analysis of the market. This analytical process begins by identifying the prospective customers for a product or service related to the market/industry to obtain data on how a product/service could fit into customers’ lives.

Secondary Research: The secondary data sources includes information published by the on-profit organizations such as World bank, WHO, company fillings, investor presentations, annual reports, national government documents, statistical databases, blogs, articles, white papers and others. From the annual report, we analyse a company’s revenue to understand the key segment and market share of that organization in a particular region. We analyse the company websites and adopt the product mapping technique which is important for deriving the segment revenue. In the product mapping method, we select and categorize the products offered by the companies catering to domain specific market, deduce the product revenue for each of the companies so as to get overall estimation of the market size. We also source data and analyses trends based on information received from supply side and demand side intermediaries in the value chain. The supply side denotes the data gathered from supplier, distributor, wholesaler and the demand side illustrates the data gathered from the end customers for respective market domain.

The supply side for a domain specific market is analysed by:
The demand side for the market is estimated through:
In-house Library: Apart from these third-party sources, we have our in-house library of qualitative and quantitative information. Our in-house database includes market data for various industry and domains. These data are updated on regular basis as per the changing market scenario. Our library includes, historic databases, internal audit reports and archives.
Sometimes there are instances where there is no metadata or raw data available for any domain specific market. For those cases, we use our expertise to forecast and estimate the market size in order to generate comprehensive data sets. Our analyst team adopt a robust research technique in order to produce the estimates:
Data Synthesis: This stage involves the analysis & mapping of all the information obtained from the previous step. It also involves in scrutinizing the data for any discrepancy observed while data gathering related to the market. The data is collected with consideration to the heterogeneity of sources. Robust scientific techniques are in place for synthesizing disparate data sets and provide the essential contextual information that can orient market strategies. The Brainy Insights has extensive experience in data synthesis where the data passes through various stages:


Market Deduction & Formulation: The final stage comprises of assigning data points at appropriate market spaces so as to deduce feasible conclusions. Analyst perspective & subject matter expert based holistic form of market sizing coupled with industry analysis also plays a crucial role in this stage.
This stage involves in finalization of the market size and numbers that we have collected from data integration step. With data interpolation, it is made sure that there is no gap in the market data. Successful trend analysis is done by our analysts using extrapolation techniques, which provide the best possible forecasts for the market.
Data Validation & Market Feedback: Validation is the most important step in the process. Validation & re-validation via an intricately designed process helps us finalize data-points to be used for final calculations.

The Brainy Insights interacts with leading companies and experts of the concerned domain to develop the analyst team’s market understanding and expertise. It improves and substantiates every single data presented in the market reports. The data validation interview and discussion panels are typically composed of the most experienced industry members. The participants include, however, are not limited to:
Moreover, we always validate our data and findings through primary respondents from all the major regions we are working on.


Free Customization
Fortune 500 Clients
Free Yearly Update On Purchase Of Multi/Corporate License
Companies Served Till Date