- +1-315-215-1633
- sales@thebrainyinsights.com

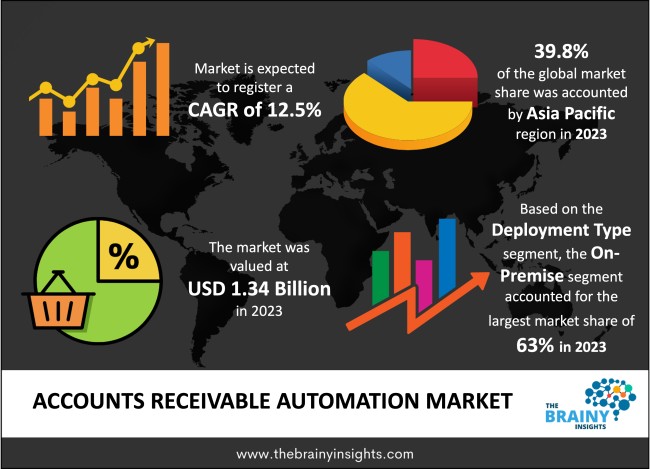
The global Accounts Receivable Automation market is expected to reach USD 3.8 Billion by 2033, at a CAGR of 12.5% from 2024 to 2033. Accounts receivable automation market growth would be driven by the growing volume of financial transactions in an organization and the need for an effective cash management system over the forecast period. Also, automation reduces operational costs as it can easily perform tasks that require several people. So, it reduces the need for extensive manpower. Automation guarantees precise invoicing which leads to faster dispute resolution & customer satisfaction.
Accounts receivable automation is a process of automating accounts receivable which can help save time, prevents errors, and reduce cost. The manual process of entering data in the sheet is being automated and streamlining the whole system electronically with the help of software that reduces repetitive and time-consuming tasks. In this automation the complete process of accounts receivable from invoicing to credit management and reconciliation, every step is optimized which results in improved cash flow by bringing money for the organization. Usually, the process of accounts receivable is too complex and takes up a lot of time. It has too many different financial systems, multiple steps to be done manually, and very little standardization which often has interruptions resulting in issues demanding quick resolution. So, the best way to all these problems is to automate the end-to-end process of accounts receivable using softwares that can solve the challenges quickly, with guaranteed results, and accurately. A machine doing things also reduces the chances of errors which is usually done by humans. It reduces errors such as overpayments, duplicate payments, and fraudulent payments, and makes it easier to capture early payment discounts. It enables a business to optimize cash flow, reduce costs, and mitigate financial risks. Automation offers a high level of security which confirms security and reduces the risk of fraud and unauthorized access. Also, the rise in remote work generates an opportunity for accounts receivable automation by which employees can have remote access.
Get an overview of this study by requesting a free sample
Accounts receivable automation helps in sending the invoices to the customers and clients on time reducing the time duration for sending invoices and receiving payments. The AR automation creates e-invoices that are accessible to the consumers who can directly pay the payments by clicking on the link. This reduces the time taken in payments and saves the time taken in auditing accounts. It also helps to speed up invoicing and manage the base transaction of the customers. The faster invoicing is boosting the growth of the market.
The adoption of new technologies in creating software for automating the accounts receivable is leading to higher prices of the software. To increase efficiency several changes are continuously being made in the software which also incurs costs and acts as a restraint to the growth of the market.
Many people these days are preferring software for doing manual work as it reduces the chances of human error and saves a lot of time. The higher demand among businesses for automation of accounts receivable is a great opportunity for the growth of the market. The rising demand for accounts receivable software from all sectors and businesses is a great opportunity for the market.
Many businesses who have been doing the accounts receivable work manually are reluctant to shift to the automation part as they have trust issues on the software and have a fear of data loss. The lack of trust in technologies is becoming a hurdle for the growth of the market.
The global accounts receivable automation market has been segmented based on deployment type, industry vertical, and regions.
The regions analyzed for the market include North America, Europe, South America, Asia Pacific, and the Middle East and Africa. Asia Pacific region emerged as the largest market for the global Accounts Receivable Automation market with a 39.8% share of the market revenue in 2023.
Asia Pacific region Accounts Receivable Automation Market Share in 2023 - 39.8%
www.thebrainyinsights.com
Check the geographical analysis of this market by requesting a free sample
The key players are now concentrating on implementing strategies such as adopting new technology, product innovations, mergers & acquisitions, joint venture, alliances, and partnerships to improve their market position in the global accounts receivable automation industry.
In April 2019, Oracle NetSuite the software developed by Oracle got enhanced by adding new capabilities in project management, commerce, analytics, financials, HR, global trade, marketing, and supply chain. The new accounting features added helps companies streamline their complete process of financial management.
As per The Brainy Insights, the size of the accounts receivable automation market was valued at USD 1.34 billion in 2023 to USD 4.34 billion by 2033.
The global accounts receivable automation market is growing at a CAGR of 12.5% during the forecast period 2024-2033.
Asia Pacific region emerged as the largest market for accounts receivable automation.
The market's growth will be influenced by faster invoicing and payments provided by the accounts receivable automation.
The higher cost of automation software could hamper the market growth.
Higher demand among several industries will provide huge opportunities to the market.
Key players are Sage, Oracle, Bottomline technologies, High Radius, Financial Force, Rimilia, Emagia, Zoho, Comarch, and Yay Pay.
1. Introduction
1.1. Objectives of the Study
1.2. Market Definition
1.3. Research Scope
1.4. Currency
1.5. Key Target Audience
2. Research Methodology and Assumptions
3. Executive Summary
4. Premium Insights
4.1. Porter’s Five Forces Analysis
4.2. Value Chain Analysis
4.3. Top Investment Pockets
4.3.1. Market Attractiveness Analysis By Deployment Type
4.3.2. Market Attractiveness Analysis By Industry Verticals
4.3.3. Market Attractiveness Analysis By Region
4.4. Industry Trends
5. Market Dynamics
5.1. Market Evaluation
5.2. Drivers
5.2.1. Faster invoicing and payments
5.3. Restraints
5.3.1. Higher cost of automation software
5.4. Opportunities
5.4.1. Higher demand
5.5. Challenges
5.5.1. Lack of trust
6. Global Accounts Receivable Automation Market Analysis and Forecast, By Deployment Type
6.1. Segment Overview
6.2. On-Premise
6.3. Cloud
7. Global Accounts Receivable Automation Market Analysis and Forecast, By Industry Verticals
7.1. Segment Overview
7.2. BFSI
7.3. Retail & Consumer goods
7.4. Healthcare
7.5. IT & Telecom
7.6. Manufacturing
7.7. Energy & Utilities
7.8. Others
8. Global Accounts Receivable Automation Market Analysis and Forecast, By Regional Analysis
8.1. Segment Overview
8.2. North America
8.2.1. U.S.
8.2.2. Canada
8.2.3. Mexico
8.3. Europe
8.3.1. Germany
8.3.2. France
8.3.3. U.K.
8.3.4. Italy
8.3.5. Spain
8.4. Asia-Pacific
8.4.1. Japan
8.4.2. China
8.4.3. India
8.5. South America
8.5.1. Brazil
8.6. Middle East and Africa
8.6.1. UAE
8.6.2. South Africa
9. Global Accounts Receivable Automation Market-Competitive Landscape
9.1. Overview
9.2. Market Share of Key Players in the Accounts Receivable Automation Market
9.2.1. Global Company Market Share
9.2.2. North America Company Market Share
9.2.3. Europe Company Market Share
9.2.4. APAC Company Market Share
9.3. Competitive Situations and Trends
9.3.1. Product Launches and Developments
9.3.2. Partnerships, Collaborations, and Agreements
9.3.3. Mergers & Acquisitions
9.3.4. Expansions
10. Company Profiles
10.1. Sage
10.1.1. Business Overview
10.1.2. Company Snapshot
10.1.3. Company Market Share Analysis
10.1.4. Company Component Portfolio
10.1.5. Recent Developments
10.1.6. SWOT Analysis
10.2. Oracle
10.2.1. Business Overview
10.2.2. Company Snapshot
10.2.3. Company Market Share Analysis
10.2.4. Company Component Portfolio
10.2.5. Recent Developments
10.2.6. SWOT Analysis
10.3. Bottomline technologies
10.3.1. Business Overview
10.3.2. Company Snapshot
10.3.3. Company Market Share Analysis
10.3.4. Company Component Portfolio
10.3.5. Recent Developments
10.3.6. SWOT Analysis
10.4. High Radius
10.4.1. Business Overview
10.4.2. Company Snapshot
10.4.3. Company Market Share Analysis
10.4.4. Company Component Portfolio
10.4.5. Recent Developments
10.4.6. SWOT Analysis
10.5. Financial Force
10.5.1. Business Overview
10.5.2. Company Snapshot
10.5.3. Company Market Share Analysis
10.5.4. Company Component Portfolio
10.5.5. Recent Developments
10.5.6. SWOT Analysis
10.6. Rimilia
10.6.1. Business Overview
10.6.2. Company Snapshot
10.6.3. Company Market Share Analysis
10.6.4. Company Component Portfolio
10.6.5. Recent Developments
10.6.6. SWOT Analysis
10.7. Emagia
10.7.1. Business Overview
10.7.2. Company Snapshot
10.7.3. Company Market Share Analysis
10.7.4. Company Component Portfolio
10.7.5. Recent Developments
10.7.6. SWOT Analysis
10.8. Zoho
10.8.1. Business Overview
10.8.2. Company Snapshot
10.8.3. Company Market Share Analysis
10.8.4. Company Component Portfolio
10.8.5. Recent Developments
10.8.6. SWOT Analysis
10.9. Comarch
10.9.1. Business Overview
10.9.2. Company Snapshot
10.9.3. Company Market Share Analysis
10.9.4. Company Component Portfolio
10.9.5. Recent Developments
10.9.6. SWOT Analysis
10.10. Yay Pay
10.10.1. Business Overview
10.10.2. Company Snapshot
10.10.3. Company Market Share Analysis
10.10.4. Company Component Portfolio
10.10.5. Recent Developments
10.10.6. SWOT Analysis
List of Table
1. Global Accounts Receivable Automation Market, By Deployment Type, 2020-2033 (USD Billion)
2. Global On-Premise Accounts Receivable Automation Market, By Region, 2020-2033 (USD Billion)
3. Global Cloud Accounts Receivable Automation Market, By Region, 2020-2033 (USD Billion)
4. Global Accounts Receivable Automation Market, By Industry Verticals, 2020-2033 (USD Billion)
5. Global BFSI Accounts Receivable Automation Market, By Region, 2020-2033 (USD Billion)
6. Global Retail & Consumer goods Accounts Receivable Automation Market, By Region, 2020-2033 (USD Billion)
7. Global Healthcare Accounts Receivable Automation Market, By Region, 2020-2033 (USD Billion)
8. Global IT & Telecom Accounts Receivable Automation Market, By Region, 2020-2033 (USD Billion)
9. Global Commercial & Industrial Accounts Receivable Automation Market, By Region, 2020-2033 (USD Billion)
10. Global Manufacturing Accounts Receivable Automation Market, By Region, 2020-2033 (USD Billion) Others
11. Global Energy & Utilities Farms Accounts Receivable Automation Market, By Region, 2020-2033 (USD Billion)
12. Global Others Accounts Receivable Automation Market, By Region, 2020-2033 (USD Billion)
13. Global Accounts Receivable Automation Market, By Region, 2020-2033 (USD Billion)
14. North America Accounts Receivable Automation Market, By Deployment Type, 2020-2033 (USD Billion)
15. North America Accounts Receivable Automation Market, By Industry Verticals, 2020-2033 (USD Billion)
16. U.S. Accounts Receivable Automation Market, By Deployment Type, 2020-2033 (USD Billion)
17. U.S. Accounts Receivable Automation Market, By Industry Verticals, 2020-2033 (USD Billion)
18. Canada Accounts Receivable Automation Market, By Deployment Type, 2020-2033 (USD Billion)
19. Canada Accounts Receivable Automation Market, By Industry Verticals, 2020-2033 (USD Billion)
20. Mexico Accounts Receivable Automation Market, By Deployment Type, 2020-2033 (USD Billion)
21. Mexico Accounts Receivable Automation Market, By Industry Verticals, 2020-2033 (USD Billion)
22. Europe Accounts Receivable Automation Market, By Deployment Type, 2020-2033 (USD Billion)
23. Europe Accounts Receivable Automation Market, By Industry Verticals, 2020-2033 (USD Billion)
24. Germany Accounts Receivable Automation Market, By Deployment Type, 2020-2033 (USD Billion)
25. Germany Accounts Receivable Automation Market, By Industry Verticals, 2020-2033 (USD Billion)
26. France Accounts Receivable Automation Market, By Deployment Type, 2020-2033 (USD Billion)
27. France Accounts Receivable Automation Market, By Industry Verticals, 2020-2033 (USD Billion)
28. U.K. Accounts Receivable Automation Market, By Deployment Type, 2020-2033 (USD Billion)
29. U.K. Accounts Receivable Automation Market, By Industry Verticals, 2020-2033 (USD Billion)
30. Italy Accounts Receivable Automation Market, By Deployment Type, 2020-2033 (USD Billion)
31. Italy Accounts Receivable Automation Market, By Industry Verticals, 2020-2033 (USD Billion)
32. Spain Accounts Receivable Automation Market, By Deployment Type, 2020-2033 (USD Billion)
33. Spain Accounts Receivable Automation Market, By Industry Verticals, 2020-2033 (USD Billion)
34. Asia Pacific Accounts Receivable Automation Market, By Deployment Type, 2020-2033 (USD Billion)
35. Asia Pacific Accounts Receivable Automation Market, By Industry Verticals, 2020-2033 (USD Billion)
36. Japan Accounts Receivable Automation Market, By Deployment Type, 2020-2033 (USD Billion)
37. Japan Accounts Receivable Automation Market, By Industry Verticals, 2020-2033 (USD Billion)
38. China Accounts Receivable Automation Market, By Deployment Type, 2020-2033 (USD Billion)
39. China Accounts Receivable Automation Market, By Industry Verticals, 2020-2033 (USD Billion)
40. India Accounts Receivable Automation Market, By Deployment Type, 2020-2033 (USD Billion)
41. India Accounts Receivable Automation Market, By Industry Verticals, 2020-2033 (USD Billion)
42. South America Accounts Receivable Automation Market, By Deployment Type, 2020-2033 (USD Billion)
43. South America Accounts Receivable Automation Market, By Industry Verticals, 2020-2033 (USD Billion)
44. Brazil Accounts Receivable Automation Market, By Deployment Type, 2020-2033 (USD Billion)
45. Brazil Accounts Receivable Automation Market, By Industry Verticals, 2020-2033 (USD Billion)
46. Middle East and Africa Accounts Receivable Automation Market, By Deployment Type, 2020-2033 (USD Billion)
47. Middle East and Africa Accounts Receivable Automation Market, By Industry Verticals, 2020-2033 (USD Billion)
48. UAE Accounts Receivable Automation Market, By Deployment Type, 2020-2033 (USD Billion)
49. UAE Accounts Receivable Automation Market, By Industry Verticals, 2020-2033 (USD Billion)
50. South Africa Accounts Receivable Automation Market, By Deployment Type, 2020-2033 (USD Billion)
51. South Africa Accounts Receivable Automation Market, By Industry Verticals, 2020-2033 (USD Billion)
List of Figures
1. Global Accounts Receivable Automation Market Segmentation
2. Accounts Receivable Automation Market: Research Methodology
3. Market Size Estimation Methodology: Bottom-Up Approach
4. Market Size Estimation Methodology: Top-Down Approach
5. Data Triangulation
6. Porter’s Five Forces Analysis
7. Value Chain Analysis
8. Global Accounts Receivable Automation Market Attractiveness Analysis By Deployment Type
9. Global Accounts Receivable Automation Market Attractiveness Analysis By Industry Verticals
10. Global Accounts Receivable Automation Market Attractiveness Analysis By Region
11. Global Accounts Receivable Automation Market: Dynamics
12. Global Accounts Receivable Automation Market Share by Deployment Type (2023 & 2033)
13. Global Accounts Receivable Automation Market Share by Industry Verticals (2023 & 2033)
14. Global Accounts Receivable Automation Market Share by Regions (2023 & 2033)
15. Global Accounts Receivable Automation Market Share by Company (2023)
This study forecasts revenue at global, regional, and country levels from 2022 to 2030. The Brainy Insights has segmented the global accounts receivable automation market based on the below-mentioned segments:
Global Accounts Receivable Automation Market by Deployment Type:
Global Accounts Receivable Automation Market by Industry Vertical:
Global Accounts Receivable Automation Market by Region:
Research has its special purpose to undertake marketing efficiently. In this competitive scenario, businesses need information across all industry verticals; the information about customer wants, market demand, competition, industry trends, distribution channels etc. This information needs to be updated regularly because businesses operate in a dynamic environment. Our organization, The Brainy Insights incorporates scientific and systematic research procedures in order to get proper market insights and industry analysis for overall business success. The analysis consists of studying the market from a miniscule level wherein we implement statistical tools which helps us in examining the data with accuracy and precision.
Our research reports feature both; quantitative and qualitative aspects for any market. Qualitative information for any market research process are fundamental because they reveal the customer needs and wants, usage and consumption for any product/service related to a specific industry. This in turn aids the marketers/investors in knowing certain perceptions of the customers. Qualitative research can enlighten about the different product concepts and designs along with unique service offering that in turn, helps define marketing problems and generate opportunities. On the other hand, quantitative research engages with the data collection process through interviews, e-mail interactions, surveys and pilot studies. Quantitative aspects for the market research are useful to validate the hypotheses generated during qualitative research method, explore empirical patterns in the data with the help of statistical tools, and finally make the market estimations.
The Brainy Insights offers comprehensive research and analysis, based on a wide assortment of factual insights gained through interviews with CXOs and global experts and secondary data from reliable sources. Our analysts and industry specialist assume vital roles in building up statistical tools and analysis models, which are used to analyse the data and arrive at accurate insights with exceedingly informative research discoveries. The data provided by our organization have proven precious to a diverse range of companies, facilitating them to address issues such as determining which products/services are the most appealing, whether or not customers use the product in the manner anticipated, the purchasing intentions of the market and many others.
Our research methodology encompasses an idyllic combination of primary and secondary initiatives. Key phases involved in this process are listed below:

The phase involves the gathering and collecting of market data and its related information with the help of different sources & research procedures.

The data procurement stage involves in data gathering and collecting through various data sources.
This stage involves in extensive research. These data sources includes:
Purchased Database: Purchased databases play a crucial role in estimating the market sizes irrespective of the domain. Our purchased database includes:
Primary Research: The Brainy Insights interacts with leading companies and experts of the concerned domain to develop the analyst team’s market understanding and expertise. It improves and substantiates every single data presented in the market reports. Primary research mainly involves in telephonic interviews, E-mail interactions and face-to-face interviews with the raw material providers, manufacturers/producers, distributors, & independent consultants. The interviews that we conduct provides valuable data on market size and industry growth trends prevailing in the market. Our organization also conducts surveys with the various industry experts in order to gain overall insights of the industry/market. For instance, in healthcare industry we conduct surveys with the pharmacists, doctors, surgeons and nurses in order to gain insights and key information of a medical product/device/equipment which the customers are going to usage. Surveys are conducted in the form of questionnaire designed by our own analyst team. Surveys plays an important role in primary research because surveys helps us to identify the key target audiences of the market. Additionally, surveys helps to identify the key target audience engaged with the market. Our survey team conducts the survey by targeting the key audience, thus gaining insights from them. Based on the perspectives of the customers, this information is utilized to formulate market strategies. Moreover, market surveys helps us to understand the current competitive situation of the industry. To be precise, our survey process typically involve with the 360 analysis of the market. This analytical process begins by identifying the prospective customers for a product or service related to the market/industry to obtain data on how a product/service could fit into customers’ lives.

Secondary Research: The secondary data sources includes information published by the on-profit organizations such as World bank, WHO, company fillings, investor presentations, annual reports, national government documents, statistical databases, blogs, articles, white papers and others. From the annual report, we analyse a company’s revenue to understand the key segment and market share of that organization in a particular region. We analyse the company websites and adopt the product mapping technique which is important for deriving the segment revenue. In the product mapping method, we select and categorize the products offered by the companies catering to domain specific market, deduce the product revenue for each of the companies so as to get overall estimation of the market size. We also source data and analyses trends based on information received from supply side and demand side intermediaries in the value chain. The supply side denotes the data gathered from supplier, distributor, wholesaler and the demand side illustrates the data gathered from the end customers for respective market domain.

The supply side for a domain specific market is analysed by:
The demand side for the market is estimated through:
In-house Library: Apart from these third-party sources, we have our in-house library of qualitative and quantitative information. Our in-house database includes market data for various industry and domains. These data are updated on regular basis as per the changing market scenario. Our library includes, historic databases, internal audit reports and archives.
Sometimes there are instances where there is no metadata or raw data available for any domain specific market. For those cases, we use our expertise to forecast and estimate the market size in order to generate comprehensive data sets. Our analyst team adopt a robust research technique in order to produce the estimates:
Data Synthesis: This stage involves the analysis & mapping of all the information obtained from the previous step. It also involves in scrutinizing the data for any discrepancy observed while data gathering related to the market. The data is collected with consideration to the heterogeneity of sources. Robust scientific techniques are in place for synthesizing disparate data sets and provide the essential contextual information that can orient market strategies. The Brainy Insights has extensive experience in data synthesis where the data passes through various stages:


Market Deduction & Formulation: The final stage comprises of assigning data points at appropriate market spaces so as to deduce feasible conclusions. Analyst perspective & subject matter expert based holistic form of market sizing coupled with industry analysis also plays a crucial role in this stage.
This stage involves in finalization of the market size and numbers that we have collected from data integration step. With data interpolation, it is made sure that there is no gap in the market data. Successful trend analysis is done by our analysts using extrapolation techniques, which provide the best possible forecasts for the market.
Data Validation & Market Feedback: Validation is the most important step in the process. Validation & re-validation via an intricately designed process helps us finalize data-points to be used for final calculations.

The Brainy Insights interacts with leading companies and experts of the concerned domain to develop the analyst team’s market understanding and expertise. It improves and substantiates every single data presented in the market reports. The data validation interview and discussion panels are typically composed of the most experienced industry members. The participants include, however, are not limited to:
Moreover, we always validate our data and findings through primary respondents from all the major regions we are working on.


Free Customization
Fortune 500 Clients
Free Yearly Update On Purchase Of Multi/Corporate License
Companies Served Till Date