- +1-315-215-1633
- sales@thebrainyinsights.com

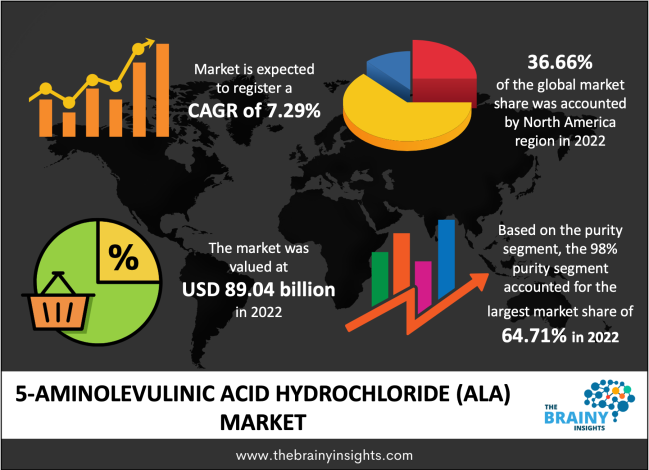
The global 5-Aminolevulinic Acid Hydrochloride (ALA) market was valued at USD 89.04 million in 2022, increasing at a CAGR of 7.29% from 2022 to 2030 and is anticipated to reach USD 159.58 million by 2030. Asia-Pacific is expected to grow the fastest during the forecast period. The 5-Aminolevulinic Acid Hydrochloride (ALA) industry was negatively affected by the COVID-19 epidemic. The impact of Covid-19 has led to the cancellation of many elective surgeries, affecting the surgery market across the world. The cancellation of elective surgeries is happening so that the patient chance of exposure to COVID-19 in the hospital can be reduced.
5-Aminolevulinic acid, also known as 5-ALA, is a non-proteinogenic amino acid broadly found in microbe, animal, and plant cells. It is a typical precursor of tetrapyrrole compounds like porphyrin, heme, vitamin B12 and chlorophyll. As tetrapyrrole compounds have a crucial role in handling cell metabolism and development, the 5-ALA demand is increasing in agriculture, livestock and medicine. 5-ALA has also shown its broad application in photodynamic diagnosis and treatment for many skin conditions and cancers. In the agriculture sector, the exogenous supplement with 5-ALA would efficiently upsurge the intracellular chlorophyll or heme levels in poultry, crop and livestock. Hence, 5-ALA is broadly used as the plant growth regulator to increase yield and avoid harmful effects due to several abiotic stresses. 5-ALA is also used as the feed additive to improve ATP production and immune response, which could lead to improved performance growth of white shrimp, chicken, pig etc. Hence, 5-ALA is considered a good biostimulant for feed nutrients for livestock breeding and crop production. 5-ALA has its application in photodynamic detection and cancer surgeries. It is used as the photosensitizer's precursor and as the add-on agent for photodynamic therapy. In comparison to the larger photosensitizer molecules, it is predicted by computer simulations that they can able to penetrate the tumour cell membranes. These factors are fuelling the growth of 5-Aminolevulinic acid.
Get an overview of this study by requesting a free sample
For example, in April 2018, NX Development (NXDC) a private life science company became a wholly-owned subsidiary of Photonamic Gmbh & Co. KG (PHN) which was earlier the licensor of Gleolan also known as aminolevulinic acid HCL (ALA) to NXDC for eight years. NXDC is working as the subsidiary of PHN which comes under SBI ALApharma group of life science organization, that focuses on the commercialization of 5-ALA for healthcare. 5-ALA has become the global product in neurosurgery after US approval for PHN along with SBI ALApharma. The merger with NXDC also expand the international network into the US.
For example, in August 2019, Photonamic Gmbh & Co. KG. announced the acquisition of the Oncology business of MolecuLight Inc. Photonamic Gmbh & Co. KG is a subsidiary of SBI Holdings Inc. This acquisition expanded the R&D activities in further tumour entities other than Glioblastoma surgery, for which the organization has already developed a 5-ALA-based product that is marketed in more than 40 nations globally. It eventually helps in the expansion of the market.
Surge in the skin diseases cases: Skin disease has become the key cause of disability all across the world. Based on one of the studies, skin diseases have continued to be the 4th leading cause of non-fatal disease burden worldwide. Skin diseases are causing substantial non-fatal disability worldwide, especially in regions with poor resources. Chronic and acute skin diseases like psoriasis, acne, eczema, rosacea, squamous cell carcinoma, dermatitis, and pruritus are key global health concerns, and it accounts for a large portion of the healthcare-associated financial burden. One study suggests that it affects between 30% to 70% of individuals worldwide, with higher rates in at-risk subpopulations. Some of the most common skin conditions are moles, chickenpox, acne, rashes, hives, eczema, skin cancer, seborrheic dermatitis, rosacea, psoriasis, impetigo, vitiligo, and warts. All these factors are eventually driving the 5- Aminolevulinic Acid Market.
Serious Side Effects: Some serious side effects related to 5- Aminolevulinic Acid are affecting its markets, such as liver damage and many nerve problems. There is a chance of hyperthermia also. In many cases, death has also resulted. Also, there is high drug cost due to high investment in R&D. All these factors are acting as the restraint for the market.
The surge in geriatric population: Based on the Population Reference Bureau report, the geriatric population is growing at a very fast pace all across the world. By the end of 2050, the population of people aged 65 or above would be 16% of the world population. In America, 31 million of the population were aged 65 years and above in 1990; by 2020, it was estimated to reach 54 million people. Based on this report, by 2050, one in every five Americans would be age 65 years or above. The surge in the geriatric population would have the chance to increase skin and cancer cases as the aged population is more prone to such diseases. This eventually would propel the 5- Aminolevulinic Acid Market.
Economic slowdown: The economic slowdown would lead to a decrease in investment in R&D, which would act as a challenge to market growth. Economic slowdown led to a decrease in GDP growth, which led to a disparity between production and earnings; thus, the market would go down, and this would also affect the 5- Aminolevulinic Acid Market.
The regions analyzed for the market include Europe, South America, Asia Pacific, North America, the Middle East, and Africa. North America emerged as the largest market for the global 5-Aminolevulinic Acid Hydrochloride (ALA) market, with a 36.66% share of the market revenue in 2022. North America dominates the 5-Aminolevulinic Acid Hydrochloride (ALA) market because this region has better healthcare infrastructure and more investment to enhance the R&D infrastructure. Also, there is a surge in cancer incidences, and its treatment is propelling the market in the region. The Asia Pacific is expected to grow the fastest during the forecast period due to increased per capita expenditure. Emerging economies like China and India are the two most populous countries in the world, and there is also an increase in cancer incidence. These are driving the market to expand its share in this region.
North America Region 5-Aminolevulinic Acid Hydrochloride (ALA) Market Share in 2022 - 36.66%
www.thebrainyinsights.com
Check the geographical analysis of this market by requesting a free sample
The purity segment is divided into purity 98%, purity 95% and others. The purity 98% segment dominated, with a market share of around 64.71% in 2022. This growth is attributed to its high demand in the R&D sector. The surge in the prevalence of chronic diseases like cancer is the factor driving the market. Chronic disease increases the growing demand for pharmaceutical drugs, where the high-purity ALA segment is majorly used.
The application segment is divided into skin cancer, systemic cancers, growth regulator in plants and others. In 2022, the skin cancer segment dominated the market with the largest market share of 42.30% and market revenue of USD 37.67 million. This growth is attributed to the sedentary and unhealthy lifestyle. Moreover, increasing habit of fast food consumption and unhealthy eating habits have led to a growing number of people suffering from chronic diseases like cancer.
The end user segment is divided into agriculture, pharmaceutical, chemicals and others. In 2022, the pharmaceutical segment dominated the market with the largest market share of 44.02% and market revenue of 39.20 million. It has its application in cancer diagnosis. Photosensitive drugs are used for photodynamic detection with the light source of the required wavelength for cancer detection using the drug's fluorescence. 5-ALA or its derivatives are used for visualizing bladder cancer by fluorescence imaging. In cancer treatment, Aminolevulinic acid is broadly analysed for photodynamic therapy (PDT) in several types of cancer. More research is happening on the ALA in human health care, such as skincare and medicine.
The distribution channel segment is divided into online sales and offline sales. In 2022, the offline sales segment dominated the market, accounting for around 69.34% of global revenue. This growth is attributed to a preference for the offline market. ALA is anticipated to effectively prevent lifestyle-related diseases due to abnormal metabolic and endocrine systems. ALA is also used in the aesthetic medical field.
| Attribute | Description |
|---|---|
| Market Size | Revenue (USD Million) |
| Market size value in 2022 | USD 89.04 Million |
| Market size value in 2030 | USD 159.58 Million |
| CAGR (2022 to 2030) | 7.29% |
| Historical data | 2019-2020 |
| Base Year | 2021 |
| Forecast | 2022-2030 |
| Segments | Key Segments are purity, application, end user, distribution channel, and regions |
| Regional Segments | The key regions are South America, North America, Europe, Asia Pacific, and Middle East & Africa. |
As per The Brainy Insights, the size of the 5-aminolevulinic acid hydrochloride (ALA) market was valued at USD 89.04 million in 2022 to USD 159.58 million by 2030.
The global 5-aminolevulinic acid hydrochloride (ALA) market is growing at a CAGR of 7.29% during the forecast period 2022-2030.
The North American region emerged as the largest market for 5-aminolevulinic acid hydrochloride (ALA).
Surge in the skin diseases cases will influence the market's growth.
1. Introduction
1.1. Objectives of the Study
1.2. Market Definition
1.3. Research Scope
1.4. Currency
1.5. Key Target Audience
2. Research Methodology and Assumptions
3. Executive Summary
4. Premium Insights
4.1. Porter’s Five Forces Analysis
4.2. Value Chain Analysis
4.3. Top Investment Pockets
4.3.1. Market Attractiveness Analysis by Purity
4.3.2. Market Attractiveness Analysis by Application
4.3.3. Market Attractiveness Analysis by End User
4.3.4. Market Attractiveness Analysis by Distribution Channel
4.3.5. Market Attractiveness Analysis by Region
4.4. Industry Trends
5. Market Dynamics
5.1. Market Evaluation
5.2. Drivers
5.2.1. Surge in the skin diseases cases
5.3. Restraints
5.3.1. Serious side effects
5.4. Opportunities
5.4.1. The surge in geriatric population
5.5. Challenges
5.5.1. Economic slowdown
6. Global 5-Aminolevulinic Acid Hydrochloride (ALA) Market Analysis and Forecast, By Purity
6.1. Segment Overview
6.2. Purity 98%
6.3. Purity 95%
6.4. Others
7. Global 5-Aminolevulinic Acid Hydrochloride (ALA) Market Analysis and Forecast, By Application
7.1. Segment Overview
7.2. Skin Cancer
7.3. Systemic Cancers
7.4. Growth Regulator in Plants
7.5. Others
8. Global 5-Aminolevulinic Acid Hydrochloride (ALA) Market Analysis and Forecast, By End User
8.1. Segment Overview
8.2. Agriculture
8.3. Pharmaceutical
8.4. Chemicals
8.5. Others
9. Global 5-Aminolevulinic Acid Hydrochloride (ALA) Market Analysis and Forecast, By Distribution Channel
9.1. Segment Overview
9.2. Online Sales
9.3. Offline Sales
10. Global 5-Aminolevulinic Acid Hydrochloride (ALA) Market Analysis and Forecast, By Regional Analysis
10.1. Segment Overview
10.2. North America
10.2.1. U.S.
10.2.2. Canada
10.2.3. Mexico
10.3. Europe
10.3.1. Germany
10.3.2. France
10.3.3. U.K.
10.3.4. Italy
10.3.5. Spain
10.4. Asia-Pacific
10.4.1. Japan
10.4.2. China
10.4.3. India
10.5. South America
10.5.1. Brazil
10.6. Middle East and Africa
10.6.1. UAE
10.6.2. South Africa
11. Global 5-Aminolevulinic Acid Hydrochloride (ALA) Market-Competitive Landscape
11.1. Overview
11.2. Market Share of Key Players in the 5-Aminolevulinic Acid Hydrochloride (ALA) Market
11.2.1. Global Company Market Share
11.2.2. North America Company Market Share
11.2.3. Europe Company Market Share
11.2.4. APAC Company Market Share
11.3. Competitive Situations and Trends
11.3.1. Product Launches and Developments
11.3.2. Partnerships, Collaborations, and Agreements
11.3.3. Mergers & Acquisitions
11.3.4. Expansions
12. Company Profiles
12.1. NMT Biotech Co., Ltd.
12.1.1. Business Overview
12.1.2. Company Snapshot
12.1.3. Company Market Share Analysis
12.1.4. Company Product Portfolio
12.1.5. Recent Developments
12.1.6. SWOT Analysis
12.2. SBI Pharmaceuticals Co., Ltd. (Subsidiary of SBI Group)
12.2.1. Business Overview
12.2.2. Company Snapshot
12.2.3. Company Market Share Analysis
12.2.4. Company Product Portfolio
12.2.5. Recent Developments
12.2.6. SWOT Analysis
12.3. Shanghai Fudan-Zhangjiang Bio-Pharmaceutical Co., Ltd.
12.3.1. Business Overview
12.3.2. Company Snapshot
12.3.3. Company Market Share Analysis
12.3.4. Company Product Portfolio
12.3.5. Recent Developments
12.3.6. SWOT Analysis
12.4. Medac GmbH
12.4.1. Business Overview
12.4.2. Company Snapshot
12.4.3. Company Market Share Analysis
12.4.4. Company Product Portfolio
12.4.5. Recent Developments
12.4.6. SWOT Analysis
12.5. Neopharma
12.5.1. Business Overview
12.5.2. Company Snapshot
12.5.3. Company Market Share Analysis
12.5.4. Company Product Portfolio
12.5.5. Recent Developments
12.5.6. SWOT Analysis
12.6. Midas Pharma Gmbh
12.6.1. Business Overview
12.6.2. Company Snapshot
12.6.3. Company Market Share Analysis
12.6.4. Company Product Portfolio
12.6.5. Recent Developments
12.6.6. SWOT Analysis
12.7. XI’AN Natural Field Bio-Technique Co., Ltd.
12.7.1. Business Overview
12.7.2. Company Snapshot
12.7.3. Company Market Share Analysis
12.7.4. Company Product Portfolio
12.7.5. Recent Developments
12.7.6. SWOT Analysis
12.8. Toronto Research Chemicals (Subsidiary Of LGC)
12.8.1. Business Overview
12.8.2. Company Snapshot
12.8.3. Company Market Share Analysis
12.8.4. Company Product Portfolio
12.8.5. Recent Developments
12.8.6. SWOT Analysis
12.9. Cayman Chemical
12.9.1. Business Overview
12.9.2. Company Snapshot
12.9.3. Company Market Share Analysis
12.9.4. Company Product Portfolio
12.9.5. Recent Developments
12.9.6. SWOT Analysis
12.10. Biosynth Carbosynth
12.10.1. Business Overview
12.10.2. Company Snapshot
12.10.3. Company Market Share Analysis
12.10.4. Company Product Portfolio
12.10.5. Recent Developments
12.10.6. SWOT Analysis
12.11. Gold Biotechnology, Inc.
12.11.1. Business Overview
12.11.2. Company Snapshot
12.11.3. Company Market Share Analysis
12.11.4. Company Product Portfolio
12.11.5. Recent Developments
12.11.6. SWOT Analysis
12.12. Tokyo Chemical Industry (TCI Chemicals)
12.12.1. Business Overview
12.12.2. Company Snapshot
12.12.3. Company Market Share Analysis
12.12.4. Company Product Portfolio
12.12.5. Recent Developments
12.12.6. SWOT Analysis
12.13. Sun Pharmaceutical Industries Limited
12.13.1. Business Overview
12.13.2. Company Snapshot
12.13.3. Company Market Share Analysis
12.13.4. Company Product Portfolio
12.13.5. Recent Developments
12.13.6. SWOT Analysis
12.14. Suzhou Yian Biotech Co. Ltd.
12.14.1. Business Overview
12.14.2. Company Snapshot
12.14.3. Company Market Share Analysis
12.14.4. Company Product Portfolio
12.14.5. Recent Developments
12.14.6. SWOT Analysis
List of Table
1. Global 5-Aminolevulinic Acid Hydrochloride (ALA) Market, By Purity, 2019-2030 (USD Billion)
2. Global Purity 98% 5-Aminolevulinic Acid Hydrochloride (ALA) Market, By Region, 2019-2030 (USD Billion)
3. Global Purity 95% 5-Aminolevulinic Acid Hydrochloride (ALA) Market, By Region, 2019-2030 (USD Billion)
4. Global Others 5-Aminolevulinic Acid Hydrochloride (ALA) Market, By Region, 2019-2030 (USD Billion)
5. Global 5-Aminolevulinic Acid Hydrochloride (ALA) Market, By Application, 2019-2030 (USD Billion)
6. Global Skin Cancer 5-Aminolevulinic Acid Hydrochloride (ALA) Market, By Region, 2019-2030 (USD Billion)
7. Global Systemic Cancers 5-Aminolevulinic Acid Hydrochloride (ALA) Market, By Region, 2019-2030 (USD Billion)
8. Global Growth Regulator in Plants 5-Aminolevulinic Acid Hydrochloride (ALA) Market, By Region, 2019-2030 (USD Billion)
9. Global Others 5-Aminolevulinic Acid Hydrochloride (ALA) Market, By Region, 2019-2030 (USD Billion)
10. Global 5-Aminolevulinic Acid Hydrochloride (ALA) Market, By End User, 2019-2030 (USD Billion)
11. Global Agriculture 5-Aminolevulinic Acid Hydrochloride (ALA) Market, By Region, 2019-2030 (USD Billion)
12. Global Pharmaceutical 5-Aminolevulinic Acid Hydrochloride (ALA) Market, By Region, 2019-2030 (USD Billion)
13. Global Chemicals 5-Aminolevulinic Acid Hydrochloride (ALA) Market, By Region, 2019-2030 (USD Billion)
14. Global Others 5-Aminolevulinic Acid Hydrochloride (ALA) Market, By Region, 2019-2030 (USD Billion)
15. Global 5-Aminolevulinic Acid Hydrochloride (ALA) Market, By Distribution Channel, 2019-2030 (USD Billion)
16. Global Online Sales 5-Aminolevulinic Acid Hydrochloride (ALA) Market, By Region, 2019-2030 (USD Billion)
17. Global Offline Sales 5-Aminolevulinic Acid Hydrochloride (ALA) Market, By Region, 2019-2030 (USD Billion)
18. Global 5-Aminolevulinic Acid Hydrochloride (ALA) Market, By Region, 2019-2030 (USD Billion)
19. North America 5-Aminolevulinic Acid Hydrochloride (ALA) Market, By Purity, 2019-2030 (USD Billion)
20. North America 5-Aminolevulinic Acid Hydrochloride (ALA) Market, By Application, 2019-2030 (USD Billion)
21. North America 5-Aminolevulinic Acid Hydrochloride (ALA) Market, By End User, 2019-2030 (USD Billion)
22. North America 5-Aminolevulinic Acid Hydrochloride (ALA) Market, By Distribution Channel, 2019-2030 (USD Billion)
23. U.S. 5-Aminolevulinic Acid Hydrochloride (ALA) Market, By Purity, 2019-2030 (USD Billion)
24. U.S. 5-Aminolevulinic Acid Hydrochloride (ALA) Market, By Application, 2019-2030 (USD Billion)
25. U.S. 5-Aminolevulinic Acid Hydrochloride (ALA) Market, By End User, 2019-2030 (USD Billion)
26. U.S. 5-Aminolevulinic Acid Hydrochloride (ALA) Market, By Distribution Channel, 2019-2030 (USD Billion)
27. Canada 5-Aminolevulinic Acid Hydrochloride (ALA) Market, By Purity, 2019-2030 (USD Billion)
28. Canada 5-Aminolevulinic Acid Hydrochloride (ALA) Market, By Application, 2019-2030 (USD Billion)
29. Canada 5-Aminolevulinic Acid Hydrochloride (ALA) Market, By End User, 2019-2030 (USD Billion)
30. Canada 5-Aminolevulinic Acid Hydrochloride (ALA) Market, By Distribution Channel, 2019-2030 (USD Billion)
31. Mexico 5-Aminolevulinic Acid Hydrochloride (ALA) Market, By Purity, 2019-2030 (USD Billion)
32. Mexico 5-Aminolevulinic Acid Hydrochloride (ALA) Market, By Application, 2019-2030 (USD Billion)
33. Mexico 5-Aminolevulinic Acid Hydrochloride (ALA) Market, By End User, 2019-2030 (USD Billion)
34. Mexico 5-Aminolevulinic Acid Hydrochloride (ALA) Market, By Distribution Channel, 2019-2030 (USD Billion)
35. Europe 5-Aminolevulinic Acid Hydrochloride (ALA) Market, By Purity, 2019-2030 (USD Billion)
36. Europe 5-Aminolevulinic Acid Hydrochloride (ALA) Market, By Application, 2019-2030 (USD Billion)
37. Europe 5-Aminolevulinic Acid Hydrochloride (ALA) Market, By End User, 2019-2030 (USD Billion)
38. Europe 5-Aminolevulinic Acid Hydrochloride (ALA) Market, By Distribution Channel, 2019-2030 (USD Billion)
39. Germany 5-Aminolevulinic Acid Hydrochloride (ALA) Market, By Purity, 2019-2030 (USD Billion)
40. Germany 5-Aminolevulinic Acid Hydrochloride (ALA) Market, By Application, 2019-2030 (USD Billion)
41. Germany 5-Aminolevulinic Acid Hydrochloride (ALA) Market, By End User, 2019-2030 (USD Billion)
42. Germany 5-Aminolevulinic Acid Hydrochloride (ALA) Market, By Distribution Channel, 2019-2030 (USD Billion)
43. France 5-Aminolevulinic Acid Hydrochloride (ALA) Market, By Purity, 2019-2030 (USD Billion)
44. France 5-Aminolevulinic Acid Hydrochloride (ALA) Market, By Application, 2019-2030 (USD Billion)
45. France 5-Aminolevulinic Acid Hydrochloride (ALA) Market, By End User, 2019-2030 (USD Billion)
46. France 5-Aminolevulinic Acid Hydrochloride (ALA) Market, By Distribution Channel, 2019-2030 (USD Billion)
47. U.K. 5-Aminolevulinic Acid Hydrochloride (ALA) Market, By Purity, 2019-2030 (USD Billion)
48. U.K. 5-Aminolevulinic Acid Hydrochloride (ALA) Market, By Application, 2019-2030 (USD Billion)
49. U.K. 5-Aminolevulinic Acid Hydrochloride (ALA) Market, By End User, 2019-2030 (USD Billion)
50. U.K. 5-Aminolevulinic Acid Hydrochloride (ALA) Market, By Distribution Channel, 2019-2030 (USD Billion)
51. Italy 5-Aminolevulinic Acid Hydrochloride (ALA) Market, By Purity, 2019-2030 (USD Billion)
52. Italy 5-Aminolevulinic Acid Hydrochloride (ALA) Market, By Application, 2019-2030 (USD Billion)
53. Italy 5-Aminolevulinic Acid Hydrochloride (ALA) Market, By End User, 2019-2030 (USD Billion)
54. Italy 5-Aminolevulinic Acid Hydrochloride (ALA) Market, By Distribution Channel, 2019-2030 (USD Billion)
55. Spain 5-Aminolevulinic Acid Hydrochloride (ALA) Market, By Purity, 2019-2030 (USD Billion)
56. Spain 5-Aminolevulinic Acid Hydrochloride (ALA) Market, By Application, 2019-2030 (USD Billion)
57. Spain 5-Aminolevulinic Acid Hydrochloride (ALA) Market, By End User, 2019-2030 (USD Billion)
58. Spain 5-Aminolevulinic Acid Hydrochloride (ALA) Market, By Distribution Channel, 2019-2030 (USD Billion)
59. Asia Pacific 5-Aminolevulinic Acid Hydrochloride (ALA) Market, By Purity, 2019-2030 (USD Billion)
60. Asia Pacific 5-Aminolevulinic Acid Hydrochloride (ALA) Market, By Application, 2019-2030 (USD Billion)
61. Asia Pacific 5-Aminolevulinic Acid Hydrochloride (ALA) Market, By End User, 2019-2030 (USD Billion)
62. Asia Pacific 5-Aminolevulinic Acid Hydrochloride (ALA) Market, By Distribution Channel, 2019-2030 (USD Billion)
63. Japan 5-Aminolevulinic Acid Hydrochloride (ALA) Market, By Purity, 2019-2030 (USD Billion)
64. Japan 5-Aminolevulinic Acid Hydrochloride (ALA) Market, By Application, 2019-2030 (USD Billion)
65. Japan 5-Aminolevulinic Acid Hydrochloride (ALA) Market, By End User, 2019-2030 (USD Billion)
66. Japan 5-Aminolevulinic Acid Hydrochloride (ALA) Market, By Distribution Channel, 2019-2030 (USD Billion)
67. China 5-Aminolevulinic Acid Hydrochloride (ALA) Market, By Purity, 2019-2030 (USD Billion)
68. China 5-Aminolevulinic Acid Hydrochloride (ALA) Market, By Application, 2019-2030 (USD Billion)
69. China 5-Aminolevulinic Acid Hydrochloride (ALA) Market, By End User, 2019-2030 (USD Billion)
70. China 5-Aminolevulinic Acid Hydrochloride (ALA) Market, By Distribution Channel, 2019-2030 (USD Billion)
71. India 5-Aminolevulinic Acid Hydrochloride (ALA) Market, By Purity, 2019-2030 (USD Billion)
72. India 5-Aminolevulinic Acid Hydrochloride (ALA) Market, By Application, 2019-2030 (USD Billion)
73. India 5-Aminolevulinic Acid Hydrochloride (ALA) Market, By End User, 2019-2030 (USD Billion)
74. India 5-Aminolevulinic Acid Hydrochloride (ALA) Market, By Distribution Channel, 2019-2030 (USD Billion)
75. South America 5-Aminolevulinic Acid Hydrochloride (ALA) Market, By Purity, 2019-2030 (USD Billion)
76. South America 5-Aminolevulinic Acid Hydrochloride (ALA) Market, By Application, 2019-2030 (USD Billion)
77. South America 5-Aminolevulinic Acid Hydrochloride (ALA) Market, By End User, 2019-2030 (USD Billion)
78. South America 5-Aminolevulinic Acid Hydrochloride (ALA) Market, By Distribution Channel, 2019-2030 (USD Billion)
79. Brazil 5-Aminolevulinic Acid Hydrochloride (ALA) Market, By Purity, 2019-2030 (USD Billion)
80. Brazil 5-Aminolevulinic Acid Hydrochloride (ALA) Market, By Application, 2019-2030 (USD Billion)
81. Brazil 5-Aminolevulinic Acid Hydrochloride (ALA) Market, By End User, 2019-2030 (USD Billion)
82. Brazil 5-Aminolevulinic Acid Hydrochloride (ALA) Market, By Distribution Channel, 2019-2030 (USD Billion)
83. Middle East and Africa 5-Aminolevulinic Acid Hydrochloride (ALA) Market, By Purity, 2019-2030 (USD Billion)
84. Middle East and Africa 5-Aminolevulinic Acid Hydrochloride (ALA) Market, By Application, 2019-2030 (USD Billion)
85. Middle East and Africa 5-Aminolevulinic Acid Hydrochloride (ALA) Market, By End User, 2019-2030 (USD Billion)
86. Middle East and Africa 5-Aminolevulinic Acid Hydrochloride (ALA) Market, By Distribution Channel, 2019-2030 (USD Billion)
87. UAE 5-Aminolevulinic Acid Hydrochloride (ALA) Market, By Purity, 2019-2030 (USD Billion)
88. UAE 5-Aminolevulinic Acid Hydrochloride (ALA) Market, By Application, 2019-2030 (USD Billion)
89. UAE 5-Aminolevulinic Acid Hydrochloride (ALA) Market, By End User, 2019-2030 (USD Billion)
90. UAE 5-Aminolevulinic Acid Hydrochloride (ALA) Market, By Distribution Channel, 2019-2030 (USD Billion)
91. South Africa 5-Aminolevulinic Acid Hydrochloride (ALA) Market, By Purity, 2019-2030 (USD Billion)
92. South Africa 5-Aminolevulinic Acid Hydrochloride (ALA) Market, By Application, 2019-2030 (USD Billion)
93. South Africa 5-Aminolevulinic Acid Hydrochloride (ALA) Market, By End User, 2019-2030 (USD Billion)
94. South Africa 5-Aminolevulinic Acid Hydrochloride (ALA) Market, By Distribution Channel, 2019-2030 (USD Billion)
List of Figures
1. Global 5-Aminolevulinic Acid Hydrochloride (ALA) Market Segmentation
2. 5-Aminolevulinic Acid Hydrochloride (ALA) Market: Research Methodology
3. Market Size Estimation Methodology: Bottom-Up Approach
4. Market Size Estimation Methodology: Top-Down Approach
5. Data Triangulation
6. Porter’s Five Forces Analysis
7. Value Chain Analysis
8. Global 5-Aminolevulinic Acid Hydrochloride (ALA) Market Attractiveness Analysis by Purity
9. Global 5-Aminolevulinic Acid Hydrochloride (ALA) Market Attractiveness Analysis by Application
10. Global 5-Aminolevulinic Acid Hydrochloride (ALA) Market Attractiveness Analysis by End User
11. Global 5-Aminolevulinic Acid Hydrochloride (ALA) Market Attractiveness Analysis by Distribution Channel
12. Global 5-Aminolevulinic Acid Hydrochloride (ALA) Market Attractiveness Analysis by Region
13. Global 5-Aminolevulinic Acid Hydrochloride (ALA) Market: Dynamics
14. Global 5-Aminolevulinic Acid Hydrochloride (ALA) Market Share by Purity (2022 & 2030)
15. Global 5-Aminolevulinic Acid Hydrochloride (ALA) Market Share by Application (2022 & 2030)
16. Global 5-Aminolevulinic Acid Hydrochloride (ALA) Market Share by End User (2022 & 2030)
17. Global 5-Aminolevulinic Acid Hydrochloride (ALA) Market Share by Distribution Channel (2022 & 2030)
18. Global 5-Aminolevulinic Acid Hydrochloride (ALA) Market Share by Regions (2022 & 2030)
19. Global 5-Aminolevulinic Acid Hydrochloride (ALA) Market Share by Company (2021)
This study forecasts revenue at global, regional, and country levels from 2019 to 2030. The Brainy Insights has segmented the global 5-aminolevulinic acid hydrochloride (ALA) market based on below-mentioned segments:
Global 5-Aminolevulinic Acid Hydrochloride (ALA) Market by Purity:
Global 5-Aminolevulinic Acid Hydrochloride (ALA) Market by Application:
Global 5-Aminolevulinic Acid Hydrochloride (ALA) Market by End User:
Global 5-Aminolevulinic Acid Hydrochloride (ALA) Market by Distribution Channel:
Global 5-Aminolevulinic Acid Hydrochloride (ALA) Market by Region:
Research has its special purpose to undertake marketing efficiently. In this competitive scenario, businesses need information across all industry verticals; the information about customer wants, market demand, competition, industry trends, distribution channels etc. This information needs to be updated regularly because businesses operate in a dynamic environment. Our organization, The Brainy Insights incorporates scientific and systematic research procedures in order to get proper market insights and industry analysis for overall business success. The analysis consists of studying the market from a miniscule level wherein we implement statistical tools which helps us in examining the data with accuracy and precision.
Our research reports feature both; quantitative and qualitative aspects for any market. Qualitative information for any market research process are fundamental because they reveal the customer needs and wants, usage and consumption for any product/service related to a specific industry. This in turn aids the marketers/investors in knowing certain perceptions of the customers. Qualitative research can enlighten about the different product concepts and designs along with unique service offering that in turn, helps define marketing problems and generate opportunities. On the other hand, quantitative research engages with the data collection process through interviews, e-mail interactions, surveys and pilot studies. Quantitative aspects for the market research are useful to validate the hypotheses generated during qualitative research method, explore empirical patterns in the data with the help of statistical tools, and finally make the market estimations.
The Brainy Insights offers comprehensive research and analysis, based on a wide assortment of factual insights gained through interviews with CXOs and global experts and secondary data from reliable sources. Our analysts and industry specialist assume vital roles in building up statistical tools and analysis models, which are used to analyse the data and arrive at accurate insights with exceedingly informative research discoveries. The data provided by our organization have proven precious to a diverse range of companies, facilitating them to address issues such as determining which products/services are the most appealing, whether or not customers use the product in the manner anticipated, the purchasing intentions of the market and many others.
Our research methodology encompasses an idyllic combination of primary and secondary initiatives. Key phases involved in this process are listed below:

The phase involves the gathering and collecting of market data and its related information with the help of different sources & research procedures.

The data procurement stage involves in data gathering and collecting through various data sources.
This stage involves in extensive research. These data sources includes:
Purchased Database: Purchased databases play a crucial role in estimating the market sizes irrespective of the domain. Our purchased database includes:
Primary Research: The Brainy Insights interacts with leading companies and experts of the concerned domain to develop the analyst team’s market understanding and expertise. It improves and substantiates every single data presented in the market reports. Primary research mainly involves in telephonic interviews, E-mail interactions and face-to-face interviews with the raw material providers, manufacturers/producers, distributors, & independent consultants. The interviews that we conduct provides valuable data on market size and industry growth trends prevailing in the market. Our organization also conducts surveys with the various industry experts in order to gain overall insights of the industry/market. For instance, in healthcare industry we conduct surveys with the pharmacists, doctors, surgeons and nurses in order to gain insights and key information of a medical product/device/equipment which the customers are going to usage. Surveys are conducted in the form of questionnaire designed by our own analyst team. Surveys plays an important role in primary research because surveys helps us to identify the key target audiences of the market. Additionally, surveys helps to identify the key target audience engaged with the market. Our survey team conducts the survey by targeting the key audience, thus gaining insights from them. Based on the perspectives of the customers, this information is utilized to formulate market strategies. Moreover, market surveys helps us to understand the current competitive situation of the industry. To be precise, our survey process typically involve with the 360 analysis of the market. This analytical process begins by identifying the prospective customers for a product or service related to the market/industry to obtain data on how a product/service could fit into customers’ lives.

Secondary Research: The secondary data sources includes information published by the on-profit organizations such as World bank, WHO, company fillings, investor presentations, annual reports, national government documents, statistical databases, blogs, articles, white papers and others. From the annual report, we analyse a company’s revenue to understand the key segment and market share of that organization in a particular region. We analyse the company websites and adopt the product mapping technique which is important for deriving the segment revenue. In the product mapping method, we select and categorize the products offered by the companies catering to domain specific market, deduce the product revenue for each of the companies so as to get overall estimation of the market size. We also source data and analyses trends based on information received from supply side and demand side intermediaries in the value chain. The supply side denotes the data gathered from supplier, distributor, wholesaler and the demand side illustrates the data gathered from the end customers for respective market domain.

The supply side for a domain specific market is analysed by:
The demand side for the market is estimated through:
In-house Library: Apart from these third-party sources, we have our in-house library of qualitative and quantitative information. Our in-house database includes market data for various industry and domains. These data are updated on regular basis as per the changing market scenario. Our library includes, historic databases, internal audit reports and archives.
Sometimes there are instances where there is no metadata or raw data available for any domain specific market. For those cases, we use our expertise to forecast and estimate the market size in order to generate comprehensive data sets. Our analyst team adopt a robust research technique in order to produce the estimates:
Data Synthesis: This stage involves the analysis & mapping of all the information obtained from the previous step. It also involves in scrutinizing the data for any discrepancy observed while data gathering related to the market. The data is collected with consideration to the heterogeneity of sources. Robust scientific techniques are in place for synthesizing disparate data sets and provide the essential contextual information that can orient market strategies. The Brainy Insights has extensive experience in data synthesis where the data passes through various stages:


Market Deduction & Formulation: The final stage comprises of assigning data points at appropriate market spaces so as to deduce feasible conclusions. Analyst perspective & subject matter expert based holistic form of market sizing coupled with industry analysis also plays a crucial role in this stage.
This stage involves in finalization of the market size and numbers that we have collected from data integration step. With data interpolation, it is made sure that there is no gap in the market data. Successful trend analysis is done by our analysts using extrapolation techniques, which provide the best possible forecasts for the market.
Data Validation & Market Feedback: Validation is the most important step in the process. Validation & re-validation via an intricately designed process helps us finalize data-points to be used for final calculations.

The Brainy Insights interacts with leading companies and experts of the concerned domain to develop the analyst team’s market understanding and expertise. It improves and substantiates every single data presented in the market reports. The data validation interview and discussion panels are typically composed of the most experienced industry members. The participants include, however, are not limited to:
Moreover, we always validate our data and findings through primary respondents from all the major regions we are working on.


Free Customization
Fortune 500 Clients
Free Yearly Update On Purchase Of Multi/Corporate License
Companies Served Till Date