- +1-315-215-1633
- sales@thebrainyinsights.com

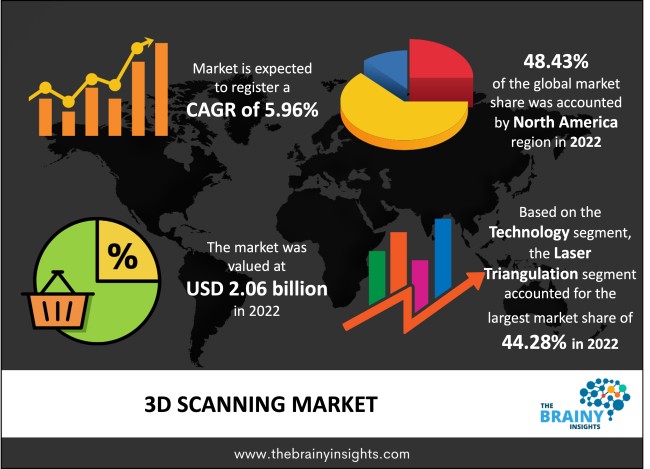
The global 3D scanning market was valued at USD 2.06 billion in 2022, growing at a CAGR of 5.96% from 2023 to 2032. The market is expected to reach USD 3.68 billion by 2032. An expanding customer base, technological advancements, and rising R&D spending propel the market growth over the forecast period.
3D scanning is the process of investigating a real-world object or environment to accumulate three-dimensional data on its shape & possibly its appearance (e.g. colour). The collected data can then be utilized to construct digital 3D models. Technicians, mechanics, architects, engineers, and hobbyists typically utilize 3D scanning. 3D scanning allows existing product improvements & provides mechanics and technicians with a new way of seeing how objects work. 3D scanners for customer use are low-cost, easy-to-operate machines that provide a basic capture, scan, and export of 3D images. The 3D laser scanner is well-fitted for measuring and inspecting curved surfaces & complex geometries requiring enormous data volumes with the correct description. 3D scanning technology can be utilized across various stages of manufacturing as it aids in saving material, money, and time. Several 3D technologies are utilized to manufacture 3D scanning devices, each with costs, limitations, and advantages.
Get an overview of this study by requesting a free sample
The increasing technological advancements in the medical sector: The growing technological progress in the medical sector is one of the driving factors of the market growth. Further, the growing use of artificial intelligence (AI) and machine learning (ML) algorithms and the development of handheld & portable 3D scanners are helping to boost market growth. Additionally, the rising adoption of cloud-based scanning software, coupled with the increasing infrastructural developments & automation in manufacturing, is helping to boost the market growth. Apart from this, the growing demand for energy-efficient machinery & processes, together with the IoT-enabled sensor's integrated computing capabilities where there is a requirement for 3D scanning, is expected to propel the market growth.
The high initial investment costs: The high initial investment costs are hindering market growth. Further, several cost-effective alternatives, like EDMs, manual measurements, and satellite systems, are available for architecture & construction, and geospatial industries. The small-scale end-users usually opt for these alternatives to maintain a desirable profit margin. While 3D scanners can perform fast & accurate 3D scanning, cost-effective alternatives hamper market growth.
Technological advancements and innovations: The increasing demand for 3D scanning technology in different industries, such as aerospace, automotive, healthcare, and construction, drives market growth. Moreover, 3D scanning technology allows the creation of highly detailed and precise 3D models of objects, which can be used for prototyping, design, and quality control purposes, helping to boost market growth. Additionally, the increasing preference for sustainable products and rapid industrialization coupled with government initiatives to boost domestic manufacturing are helping to propel market growth over the forthcoming period.
The regions analyzed for the market include North America, Europe, South America, Asia Pacific, the Middle East, and Africa. North America emerged as the largest global 3D Scanning market, with a 48.43% market revenue share in 2022. The increasing R&D spending, the high adoption of the technology in the automotive sector and environmental scanning & modelling operations are expected to propel market growth in this region. Moreover, the presence of end-user industries such as defence, aerospace, healthcare, and entertainment is anticipated to drive market growth in this region. Apart from this, a rise in investment by prime players & government agencies to develop next-generation 3D scanning solution are also expected to drive market growth. The Asia-Pacific region will account for the largest market share with revenue growth. This growth is attributed to the rising number of model and equipment variants in the vehicle design & development processes. Moreover, the adoption of 3D printing solution across construction, healthcare, and other sectors are also propelling market growth in this region. Further, the increasing adoption of 3D printing technology is also helping to boost market growth.
North America Region 3D Scanning Market Share in 2022 - 48.43%
www.thebrainyinsights.com
Check the geographical analysis of this market by requesting a free sample
The technology segment is divided into pattern fringe triangulation, laser triangulation, and others. The laser triangulation segment dominated the market, with a share of around 44.28% in 2022. This growth is attributed to the availability of conventional substitutes for 3D laser scanners.
The scanner type segment is divided into laser scanner, optical scanners, and others. The laser scanner segment dominated, with a market share of around 43.23% in 2022. This growth is attributed to the mining industry's large-scale deployment of 3D laser scanners.
The range segment is divided into long range, medium range, and short range. The short range segment dominated, with a market share of around 45.21% in 2022. This growth is attributed to the rising awareness about various application areas such as product design, material inspection, and modelling.
The application segment is divided into quality control, reverse engineering, and others. The quality control segment dominated, with a market share of around 43.12% in 2022. This growth is attributed to the increasing awareness about advanced medical treatment and the requirement to capture large volumes of 3D data for analysis.
The end-user segment is divided into architecture and construction, aerospace and defence, healthcare, automotive, and others. The automotive segment dominated, with a market share of around 29.16% in 2022. This growth is attributed to the widespread use of 3D scanning applications in different automotive applications, such as the early stages of designing, manufacturing, and executing individual parts & final products in motor vehicles.
| Attribute | Description |
|---|---|
| Market Size | Revenue (USD Billion) |
| Market size value in 2022 | USD 2.06 Billion |
| Market size value in 2032 | USD 3.68 Billion |
| CAGR (2023 to 2032) | 5.96% |
| Historical data | 2019-2021 |
| Base Year | 2022 |
| Forecast | 2023-2032 |
| Region | The regions analyzed for the market are Asia Pacific, Europe, South America, North America, and Middle East & Africa. Furthermore, the regions are further analyzed at the country level. |
| Segments | Technology, Scanner Type, Range Application, End User |
As per The Brainy Insights, the size of the 3D scanning market was valued at 2.06 Billion in 2022 to USD 3.68 Billion by 2032.
The global 3D scanning market is growing at a CAGR of 5.96% during the forecast period 2023-2032.
North America region emerged as the largest market for 3D scanning.
1. Introduction
1.1. Objectives of the Study
1.2. Market Definition
1.3. Research Scope
1.4. Currency
1.5. Key Target Audience
2. Research Methodology and Assumptions
3. Executive Summary
4. Premium Insights
4.1. Porter’s Five Forces Analysis
4.2. Value Chain Analysis
4.3. Top Investment Pockets
4.3.1. Market Attractiveness Analysis By Technology
4.3.2. Market Attractiveness Analysis By Scanner Type
4.3.3. Market Attractiveness Analysis By Range
4.3.4. Market Attractiveness Analysis By Application
4.3.5. Market Attractiveness Analysis By End User
4.3.6. Market Attractiveness Analysis By Region
4.4. Industry Trends
5. Market Dynamics
5.1. Market Evaluation
5.2. Drivers
5.2.1. The increasing technological advancements in the medical sector
5.2.2. The surge in adoption of 3D scanning in the automotive industry
5.3. Restraints
5.3.1. The high initial investment costs
5.3.2. The lack of skilled labour
5.4. Opportunities
5.4.1. Technological advancements and innovations
5.4.2. The increasing investment in the R&D sector
1. Global 3D Scanning Market Analysis and Forecast, By Technology
1.1. Segment Overview
1.2. Pattern Fringe Triangulation
1.3. Laser Triangulation
1.4. Others
2. Global 3D Scanning Market Analysis and Forecast, By Scanner Type
2.1. Segment Overview
2.2. Laser Scanner
2.3. Optical Scanners
2.4. Others
3. Global 3D Scanning Market Analysis and Forecast, By Range
3.1. Segment Overview
3.2. Long Range
3.3. Medium Range
3.4. Short Range
4. Global 3D Scanning Market Analysis and Forecast, By Application
4.1. Segment Overview
4.2. Quality Control
4.3. Reverse Engineering
4.4. Others
5. Global 3D Scanning Market Analysis and Forecast, By End User
5.5. Segment Overview
5.6. Architecture and Construction
5.7. Aerospace and Defence
5.8. Healthcare
5.9. Automotive
5.10. Others
6. Global 3D Scanning Market Analysis and Forecast, By Regional Analysis
6.1. Segment Overview
6.2. North America
6.2.1. U.S.
6.2.2. Canada
6.2.3. Mexico
6.3. Europe
6.3.1. Germany
6.3.2. France
6.3.3. U.K.
6.3.4. Italy
6.3.5. Spain
6.4. Asia-Pacific
6.4.1. Japan
6.4.2. China
6.4.3. India
6.5. South America
6.5.1. Brazil
6.6. Middle East and Africa
6.6.1. UAE
6.6.2. South Africa
7. Global 3D Scanning Market-Competitive Landscape
7.1. Overview
7.2. Market Share of Key Players in Global 3D Scanning Market
7.2.1. Global Company Market Share
7.2.2. North America Company Market Share
7.2.3. Europe Company Market Share
7.2.4. APAC Company Market Share
7.3. Competitive Situations and Trends
7.3.1. Product Launches and Developments
7.3.2. Partnerships, Collaborations, and Agreements
7.3.3. Mergers & Acquisitions
7.3.4. Expansions
8. Company Profiles
8.1. Trimble, Inc.
8.1.1. Business Overview
8.1.2. Company Snapshot
8.1.3. Company Market Share Analysis
8.1.4. Company Product Portfolio
8.1.5. Recent Developments
8.1.6. SWOT Analysis
8.2. CyberOptics Corporation
8.2.1. Business Overview
8.2.2. Company Snapshot
8.2.3. Company Market Share Analysis
8.2.4. Company Product Portfolio
8.2.5. Recent Developments
8.2.6. SWOT Analysis
8.3. NeoMetrix Technologies, Inc.
8.3.1. Business Overview
8.3.2. Company Snapshot
8.3.3. Company Market Share Analysis
8.3.4. Company Product Portfolio
8.3.5. Recent Developments
8.3.6. SWOT Analysis
8.4. Faro Technologies, Inc.
8.4.1. Business Overview
8.4.2. Company Snapshot
8.4.3. Company Market Share Analysis
8.4.4. Company Product Portfolio
8.4.5. Recent Developments
8.4.6. SWOT Analysis
8.5. Exact Metrology
8.5.1. Business Overview
8.5.2. Company Snapshot
8.5.3. Company Market Share Analysis
8.5.4. Company Product Portfolio
8.5.5. Recent Developments
8.5.6. SWOT Analysis
8.6. 3D Systems, Inc.
8.6.1. Business Overview
8.6.2. Company Snapshot
8.6.3. Company Market Share Analysis
8.6.4. Company Product Portfolio
8.6.5. Recent Developments
8.6.6. SWOT Analysis
8.7. Quality Vision International
8.7.1. Business Overview
8.7.2. Company Snapshot
8.7.3. Company Market Share Analysis
8.7.4. Company Product Portfolio
8.7.5. Recent Developments
8.7.6. SWOT Analysis
8.8. GOM GmbH
8.8.1. Business Overview
8.8.2. Company Snapshot
8.8.3. Company Market Share Analysis
8.8.4. Company Product Portfolio
8.8.5. Recent Developments
8.8.6. SWOT Analysis
8.9. Maptek Pty Ltd.
8.9.1. Business Overview
8.9.2. Company Snapshot
8.9.3. Company Market Share Analysis
8.9.4. Company Product Portfolio
8.9.5. Recent Developments
8.9.6. SWOT Analysis
8.10. Autodesk, Inc.
8.10.1. Business Overview
8.10.2. Company Snapshot
8.10.3. Company Market Share Analysis
8.10.4. Company Product Portfolio
8.10.5. Recent Developments
8.10.6. SWOT Analysis
8.11. Hexagon AB
8.11.1. Business Overview
8.11.2. Company Snapshot
8.11.3. Company Market Share Analysis
8.11.4. Company Product Portfolio
8.11.5. Recent Developments
8.11.6. SWOT Analysis
8.12. Topcon Corporation
8.12.1. Business Overview
8.12.2. Company Snapshot
8.12.3. Company Market Share Analysis
8.12.4. Company Product Portfolio
8.12.5. Recent Developments
8.12.6. SWOT Analysis
List of Table
1. Global 3D Scanning Market, By Technology, 2019-2032 (USD Billion)
2. Global Pattern Fringe Triangulation, 3D Scanning Market, By Region, 2019-2032 (USD Billion)
3. Global Laser Triangulation, 3D Scanning Market, By Region, 2019-2032 (USD Billion)
4. Global Others, 3D Scanning Market, By Region, 2019-2032 (USD Billion)
5. Global 3D Scanning Market, By Scanner Type, 2019-2032 (USD Billion)
6. Global Laser Scanner, 3D Scanning Market, By Region, 2019-2032 (USD Billion)
7. Global Optical Scanners, 3D Scanning Market, By Region, 2019-2032 (USD Billion)
8. Global Others, 3D Scanning Market, By Region, 2019-2032 (USD Billion)
9. Global 3D Scanning Market, By Range, 2019-2032 (USD Billion)
10. Global Long Range, 3D Scanning Market, By Region, 2019-2032 (USD Billion)
11. Global Medium Range, 3D Scanning Market, By Region, 2019-2032 (USD Billion)
12. Global Short Range, 3D Scanning Market, By Region, 2019-2032 (USD Billion)
13. Global 3D Scanning Market, By Application, 2019-2032 (USD Billion)
14. Global Quality Control, 3D Scanning Market, By Region, 2019-2032 (USD Billion)
15. Global Reverse Engineering, 3D Scanning Market, By Region, 2019-2032 (USD Billion)
16. Global Others 3D Scanning Market, By Region, 2019-2032 (USD Billion)
17. Global 3D Scanning Market, By End User, 2019-2032 (USD Billion)
18. Global Architecture and Construction, 3D Scanning Market, By Region, 2019-2032 (USD Billion)
19. Global Aerospace and Defence, 3D Scanning Market, By Region, 2019-2032 (USD Billion)
20. Global Healthcare, 3D Scanning Market, By Region, 2019-2032 (USD Billion)
21. Global Automotive, 3D Scanning Market, By Region, 2019-2032 (USD Billion)
22. Global Others, 3D Scanning Market, By Region, 2019-2032 (USD Billion)
23. North America 3D Scanning Market, By Technology, 2019-2032 (USD Billion)
24. North America 3D Scanning Market, By Scanner Type, 2019-2032 (USD Billion)
25. North America 3D Scanning Market, By Range, 2019-2032 (USD Billion)
26. North America 3D Scanning Market, By Application, 2019-2032 (USD Billion)
27. North America 3D Scanning Market, By End User, 2019-2032 (USD Billion)
28. U.S. 3D Scanning Market, By Technology, 2019-2032 (USD Billion)
29. U.S. 3D Scanning Market, By Scanner Type, 2019-2032 (USD Billion)
30. U.S. 3D Scanning Market, By Range, 2019-2032 (USD Billion)
31. U.S. 3D Scanning Market, By Application, 2019-2032 (USD Billion)
32. U.S. 3D Scanning Market, By End User, 2019-2032 (USD Billion)
33. Canada 3D Scanning Market, By Technology, 2019-2032 (USD Billion)
34. Canada 3D Scanning Market, By Scanner Type, 2019-2032 (USD Billion)
35. Canada 3D Scanning Market, By Range, 2019-2032 (USD Billion)
36. Canada 3D Scanning Market, By Application, 2019-2032 (USD Billion)
37. Canada 3D Scanning Market, By End User, 2019-2032 (USD Billion)
38. Mexico 3D Scanning Market, By Technology, 2019-2032 (USD Billion)
39. Mexico 3D Scanning Market, By Scanner Type, 2019-2032 (USD Billion)
40. Mexico 3D Scanning Market, By Range, 2019-2032 (USD Billion)
41. Mexico 3D Scanning Market, By Application, 2019-2032 (USD Billion)
42. Mexico 3D Scanning Market, By End User, 2019-2032 (USD Billion)
43. Europe 3D Scanning Market, By Technology, 2019-2032 (USD Billion)
44. Europe 3D Scanning Market, By Scanner Type, 2019-2032 (USD Billion)
45. Europe 3D Scanning Market, By Range, 2019-2032 (USD Billion)
46. Europe 3D Scanning Market, By Application, 2019-2032 (USD Billion)
47. Europe 3D Scanning Market, By End User, 2019-2032 (USD Billion)
48. Germany 3D Scanning Market, By Technology, 2019-2032 (USD Billion)
49. Germany 3D Scanning Market, By Scanner Type, 2019-2032 (USD Billion)
50. Germany 3D Scanning Market, By Range, 2019-2032 (USD Billion)
51. Germany 3D Scanning Market, By Application, 2019-2032 (USD Billion)
52. Germany 3D Scanning Market, By End User, 2019-2032 (USD Billion)
53. France 3D Scanning Market, By Technology, 2019-2032 (USD Billion)
54. France 3D Scanning Market, By Scanner Type, 2019-2032 (USD Billion)
55. France 3D Scanning Market, By Range, 2019-2032 (USD Billion)
56. France 3D Scanning Market, By Application, 2019-2032 (USD Billion)
57. France 3D Scanning Market, By End User, 2019-2032 (USD Billion)
58. U.K. 3D Scanning Market, By Technology, 2019-2032 (USD Billion)
59. U.K. 3D Scanning Market, By Scanner Type, 2019-2032 (USD Billion)
60. U.K. 3D Scanning Market, By Range, 2019-2032 (USD Billion)
61. U.K. 3D Scanning Market, By Application, 2019-2032 (USD Billion)
62. U.K. 3D Scanning Market, By End User, 2019-2032 (USD Billion)
63. Italy 3D Scanning Market, By Technology, 2019-2032 (USD Billion)
64. Italy 3D Scanning Market, By Scanner Type, 2019-2032 (USD Billion)
65. Italy 3D Scanning Market, By Range, 2019-2032 (USD Billion)
66. Italy 3D Scanning Market, By Application, 2019-2032 (USD Billion)
67. Italy 3D Scanning Market, By End User, 2019-2032 (USD Billion)
68. Spain 3D Scanning Market, By Technology, 2019-2032 (USD Billion)
69. Spain 3D Scanning Market, By Scanner Type, 2019-2032 (USD Billion)
70. Spain 3D Scanning Market, By Range, 2019-2032 (USD Billion)
71. Spain 3D Scanning Market, By Application, 2019-2032 (USD Billion)
72. Spain 3D Scanning Market, By End User, 2019-2032 (USD Billion)
73. Asia Pacific 3D Scanning Market, By Technology, 2019-2032 (USD Billion)
74. Asia Pacific 3D Scanning Market, By Scanner Type, 2019-2032 (USD Billion)
75. Asia Pacific 3D Scanning Market, By Range, 2019-2032 (USD Billion)
76. Asia Pacific 3D Scanning Market, By Application, 2019-2032 (USD Billion)
77. Asia Pacific 3D Scanning Market, By End User, 2019-2032 (USD Billion)
78. Japan 3D Scanning Market, By Technology, 2019-2032 (USD Billion)
79. Japan 3D Scanning Market, By Scanner Type, 2019-2032 (USD Billion)
80. Japan 3D Scanning Market, By Range, 2019-2032 (USD Billion)
81. Japan 3D Scanning Market, By Application, 2019-2032 (USD Billion)
82. Japan 3D Scanning Market, By End User, 2019-2032 (USD Billion)
83. China 3D Scanning Market, By Technology, 2019-2032 (USD Billion)
84. China 3D Scanning Market, By Scanner Type, 2019-2032 (USD Billion)
85. China 3D Scanning Market, By Range, 2019-2032 (USD Billion)
86. China 3D Scanning Market, By Application, 2019-2032 (USD Billion)
87. China 3D Scanning Market, By End User, 2019-2032 (USD Billion)
88. India 3D Scanning Market, By Technology, 2019-2032 (USD Billion)
89. India 3D Scanning Market, By Scanner Type, 2019-2032 (USD Billion)
90. India 3D Scanning Market, By Range, 2019-2032 (USD Billion)
91. India 3D Scanning Market, By Application, 2019-2032 (USD Billion)
92. India 3D Scanning Market, By End User, 2019-2032 (USD Billion)
93. South America 3D Scanning Market, By Technology, 2019-2032 (USD Billion)
94. South America 3D Scanning Market, By Scanner Type, 2019-2032 (USD Billion)
95. South America 3D Scanning Market, By Range, 2019-2032 (USD Billion)
96. South America 3D Scanning Market, By Application, 2019-2032 (USD Billion)
97. South America 3D Scanning Market, By End User, 2019-2032 (USD Billion)
98. Brazil 3D Scanning Market, By Technology, 2019-2032 (USD Billion)
99. Brazil 3D Scanning Market, By Scanner Type, 2019-2032 (USD Billion)
100. Brazil 3D Scanning Market, By Range, 2019-2032 (USD Billion)
101. Brazil 3D Scanning Market, By Application, 2019-2032 (USD Billion)
102. Brazil 3D Scanning Market, By End User, 2019-2032 (USD Billion)
103. Middle East and Africa 3D Scanning Market, By Technology, 2019-2032 (USD Billion)
104. Middle East and Africa 3D Scanning Market, By Scanner Type, 2019-2032 (USD Billion)
105. Middle East and Africa 3D Scanning Market, By Range, 2019-2032 (USD Billion)
106. Middle East and Africa 3D Scanning Market, By Application, 2019-2032 (USD Billion)
107. Middle East and Africa 3D Scanning Market, By End User, 2019-2032 (USD Billion)
108. UAE 3D Scanning Market, By Technology, 2019-2032 (USD Billion)
109. UAE 3D Scanning Market, By Scanner Type, 2019-2032 (USD Billion)
110. UAE 3D Scanning Market, By Range, 2019-2032 (USD Billion)
111. UAE 3D Scanning Market, By Application, 2019-2032 (USD Billion)
112. UAE 3D Scanning Market, By End User, 2019-2032 (USD Billion)
113. South Africa 3D Scanning Market, By Technology, 2019-2032 (USD Billion)
114. South Africa 3D Scanning Market, By Scanner Type, 2019-2032 (USD Billion)
115. South Africa 3D Scanning Market, By Range, 2019-2032 (USD Billion)
116. South Africa 3D Scanning Market, By Application, 2019-2032 (USD Billion)
117. South Africa 3D Scanning Market, By End User, 2019-2032 (USD Billion)
List of Figures
1. Global 3D Scanning Market Segmentation
2. Global 3D Scanning Market: Research Methodology
3. Market Size Estimation Methodology: Bottom-Up Approach
4. Market Size Estimation Methodology: Top-Down Approach
5. Data Triangulation
6. Porter’s Five Forces Analysis
7. Value Chain Analysis
8. Global 3D Scanning Market Attractiveness Analysis By Technology
9. Global 3D Scanning Market Attractiveness Analysis By Scanner Type
10. Global 3D Scanning Market Attractiveness Analysis By Range
11. Global 3D Scanning Market Attractiveness Analysis By Application
12. Global 3D Scanning Market Attractiveness Analysis By End User
13. Global 3D Scanning Market Attractiveness Analysis By Region
14. Global 3D Scanning Market: Dynamics
15. Global 3D Scanning Market Share By Technology (2023 & 2032)
16. Global 3D Scanning Market Share By Scanner Type (2023 & 2032)
17. Global 3D Scanning Market Share By Range (2023 & 2032)
18. Global 3D Scanning Market Share By Application (2023 & 2032)
19. Global 3D Scanning Market Share By End User (2023 & 2032)
20. Global 3D Scanning Market Share By Regions (2023 & 2032)
21. Global 3D Scanning Market Share By Company (2022)
This study forecasts revenue at global, regional, and country levels from 2019 to 2030. The Brainy Insights has segmented the global 3D Scanning based on below mentioned segments:
Global 3D Scanning Market by Technology:
Global 3D Scanning Market by Scanner Type:
Global 3D Scanning Market by Range:
Global 3D Scanning Market by Application:
Global 3D Scanning Market by End User:
Global 3D Scanning by Region:
Research has its special purpose to undertake marketing efficiently. In this competitive scenario, businesses need information across all industry verticals; the information about customer wants, market demand, competition, industry trends, distribution channels etc. This information needs to be updated regularly because businesses operate in a dynamic environment. Our organization, The Brainy Insights incorporates scientific and systematic research procedures in order to get proper market insights and industry analysis for overall business success. The analysis consists of studying the market from a miniscule level wherein we implement statistical tools which helps us in examining the data with accuracy and precision.
Our research reports feature both; quantitative and qualitative aspects for any market. Qualitative information for any market research process are fundamental because they reveal the customer needs and wants, usage and consumption for any product/service related to a specific industry. This in turn aids the marketers/investors in knowing certain perceptions of the customers. Qualitative research can enlighten about the different product concepts and designs along with unique service offering that in turn, helps define marketing problems and generate opportunities. On the other hand, quantitative research engages with the data collection process through interviews, e-mail interactions, surveys and pilot studies. Quantitative aspects for the market research are useful to validate the hypotheses generated during qualitative research method, explore empirical patterns in the data with the help of statistical tools, and finally make the market estimations.
The Brainy Insights offers comprehensive research and analysis, based on a wide assortment of factual insights gained through interviews with CXOs and global experts and secondary data from reliable sources. Our analysts and industry specialist assume vital roles in building up statistical tools and analysis models, which are used to analyse the data and arrive at accurate insights with exceedingly informative research discoveries. The data provided by our organization have proven precious to a diverse range of companies, facilitating them to address issues such as determining which products/services are the most appealing, whether or not customers use the product in the manner anticipated, the purchasing intentions of the market and many others.
Our research methodology encompasses an idyllic combination of primary and secondary initiatives. Key phases involved in this process are listed below:

The phase involves the gathering and collecting of market data and its related information with the help of different sources & research procedures.

The data procurement stage involves in data gathering and collecting through various data sources.
This stage involves in extensive research. These data sources includes:
Purchased Database: Purchased databases play a crucial role in estimating the market sizes irrespective of the domain. Our purchased database includes:
Primary Research: The Brainy Insights interacts with leading companies and experts of the concerned domain to develop the analyst team’s market understanding and expertise. It improves and substantiates every single data presented in the market reports. Primary research mainly involves in telephonic interviews, E-mail interactions and face-to-face interviews with the raw material providers, manufacturers/producers, distributors, & independent consultants. The interviews that we conduct provides valuable data on market size and industry growth trends prevailing in the market. Our organization also conducts surveys with the various industry experts in order to gain overall insights of the industry/market. For instance, in healthcare industry we conduct surveys with the pharmacists, doctors, surgeons and nurses in order to gain insights and key information of a medical product/device/equipment which the customers are going to usage. Surveys are conducted in the form of questionnaire designed by our own analyst team. Surveys plays an important role in primary research because surveys helps us to identify the key target audiences of the market. Additionally, surveys helps to identify the key target audience engaged with the market. Our survey team conducts the survey by targeting the key audience, thus gaining insights from them. Based on the perspectives of the customers, this information is utilized to formulate market strategies. Moreover, market surveys helps us to understand the current competitive situation of the industry. To be precise, our survey process typically involve with the 360 analysis of the market. This analytical process begins by identifying the prospective customers for a product or service related to the market/industry to obtain data on how a product/service could fit into customers’ lives.

Secondary Research: The secondary data sources includes information published by the on-profit organizations such as World bank, WHO, company fillings, investor presentations, annual reports, national government documents, statistical databases, blogs, articles, white papers and others. From the annual report, we analyse a company’s revenue to understand the key segment and market share of that organization in a particular region. We analyse the company websites and adopt the product mapping technique which is important for deriving the segment revenue. In the product mapping method, we select and categorize the products offered by the companies catering to domain specific market, deduce the product revenue for each of the companies so as to get overall estimation of the market size. We also source data and analyses trends based on information received from supply side and demand side intermediaries in the value chain. The supply side denotes the data gathered from supplier, distributor, wholesaler and the demand side illustrates the data gathered from the end customers for respective market domain.

The supply side for a domain specific market is analysed by:
The demand side for the market is estimated through:
In-house Library: Apart from these third-party sources, we have our in-house library of qualitative and quantitative information. Our in-house database includes market data for various industry and domains. These data are updated on regular basis as per the changing market scenario. Our library includes, historic databases, internal audit reports and archives.
Sometimes there are instances where there is no metadata or raw data available for any domain specific market. For those cases, we use our expertise to forecast and estimate the market size in order to generate comprehensive data sets. Our analyst team adopt a robust research technique in order to produce the estimates:
Data Synthesis: This stage involves the analysis & mapping of all the information obtained from the previous step. It also involves in scrutinizing the data for any discrepancy observed while data gathering related to the market. The data is collected with consideration to the heterogeneity of sources. Robust scientific techniques are in place for synthesizing disparate data sets and provide the essential contextual information that can orient market strategies. The Brainy Insights has extensive experience in data synthesis where the data passes through various stages:


Market Deduction & Formulation: The final stage comprises of assigning data points at appropriate market spaces so as to deduce feasible conclusions. Analyst perspective & subject matter expert based holistic form of market sizing coupled with industry analysis also plays a crucial role in this stage.
This stage involves in finalization of the market size and numbers that we have collected from data integration step. With data interpolation, it is made sure that there is no gap in the market data. Successful trend analysis is done by our analysts using extrapolation techniques, which provide the best possible forecasts for the market.
Data Validation & Market Feedback: Validation is the most important step in the process. Validation & re-validation via an intricately designed process helps us finalize data-points to be used for final calculations.

The Brainy Insights interacts with leading companies and experts of the concerned domain to develop the analyst team’s market understanding and expertise. It improves and substantiates every single data presented in the market reports. The data validation interview and discussion panels are typically composed of the most experienced industry members. The participants include, however, are not limited to:
Moreover, we always validate our data and findings through primary respondents from all the major regions we are working on.


Free Customization
Fortune 500 Clients
Free Yearly Update On Purchase Of Multi/Corporate License
Companies Served Till Date