- +1-315-215-1633
- sales@thebrainyinsights.com

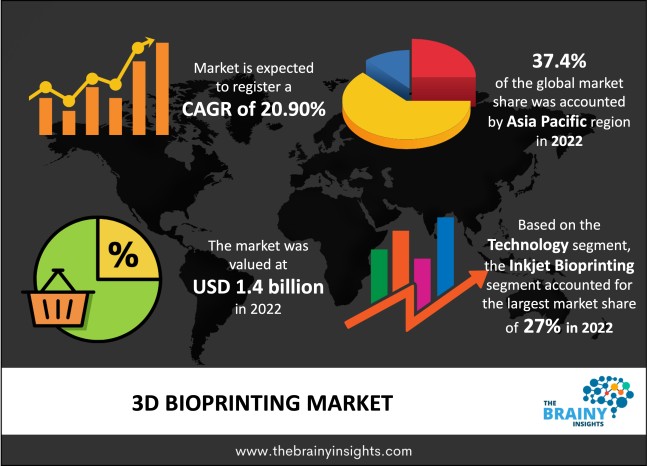
The global 3D bioprinting market was valued at USD 1.4 billion in 2022 and growing at a CAGR of 20.90% from 2023 to 2032. The market is expected to reach USD 9.3 billion by 2032. Various pharmaceutical firms use 3D bioprinting technology in drug development procedure. Assuming 3D bioprinting helps pharmaceutical businesses to test drugs at a less price. Regardless, 3D bioprinting permits pharma companies to test a drug within a few hours corresponding to the conventional method, which takes longer. Apart from that, using 3D printing medical devices quickly lessens the usage of animals for drug testing.
3D bioprinting is an additive manufacturing technique that uses bio-inks to print living cells, creating forms layer-by-layer that imitate natural tissues' behaviour and structures. Bioinks used as a material in bioprinting are created of natural or synthetic biomaterials that can be combined with living cells. The technology and bioprinted systems allow researchers to explore the functions of the human body in vitro. 3D bioprinted structures are more biologically appropriate than in vitro studies performed in 2D. Especially, 3D bioprinting can be used for different biological applications in the fields of tissue engineering, materials science, and bioengineering. The technology is also growing and used for pharmaceutical development and drug validation. Clinical backgrounds like 3D-printed skin and bone grafts, implants and even full 3D-printed organs are presently at the center of bioprinting research. 3D bioprinters and 3D printers are like each other, but 3D printers are formed to print solid materials, whereas 3D bioprinters are prepared to print liquid or gel. 3D bioprinters are also planned to take sensitive material that includes living cells without forming too much damage to the result. Bioprinters can be inkjet-based, laser-assisted, or extrusion based. Each printer type has its pros and cons when it reaches to cost, cell density, resolution, cell viability, etc. Bioprinters’ compatibility with bio-inks also differs, and thus it is necessary to provide the bioprinter and bio-ink work combined. Similarly, in simple words, 3D bioprinting is the deposit of biological material in a layer-by-layer fashion to form 3D structures like organs and tissues.
Get an overview of this study by requesting a free sample
Bioprinting Could Control Cell Rejection- Human tissue printing is usually a difficult task, but the possibility of discovering a donor that gives constant tissue cells is low. Incompatibility can trigger the immune system to strike the body if a foreign cell is located. It means that organ transplants can be tough. If the body refuses the new addition, difficulties may arise. The patient will either require a recent transplant or live on immunosuppressants for the rest of their lives. But with 3D bioprinting, the sophisticated cells may be taken from the patient. This would ensure the body won’t leave the transplant after the operation.
Fixed Materials- While 3D Printing can make items in a selection of metals and plastics, the open choice for raw materials is not exhaustive, which is because not all metals or plastics can be temperature controlled adequately to enable 3D Printing due to which, many of these printable materials cannot be recycled, and not all material is food safe.
Reduced Animal Killing- As animal testing has been reduced with the use of 3D bioprinting. The number of animals killed yearly to serve clinical studies and trials has also decreased. Indirectly, this technology protects the ecosystem, bringing favorable prospects to the market.
The regions analyzed for the market include North America, Europe, South America, Asia Pacific, the Middle East, and Africa. Asia Pacific emerged as the largest market for the global 3D bioprinting market, with a 37.4% share of the market revenue in 2022.
Asia-Pacific is the fastest-growing market for 3D bioprinting, owing to a robust customer base that may push the need for 3D bioprinting, the vast scope of 3D printing in medical benefits, rising research and development for 3D printing, and government subsidy and tax incentives. 3D printing in China is picking up speed associated with other advanced economies, like Europe and North America. The primary factor pushing the growth is the support from the Chinese government in the invention, growth, and adoption of the technology among end-user industries in the country, which leads to the expansion of the market in the region.
Asia Pacific Region 3D Bioprinting Market Share in 2022 - 37.4%
www.thebrainyinsights.com
Check the geographical analysis of this market by requesting a free sample
The technology segment is divided into magnetic levitation bioprinting, inkjet bioprinting, syringe/extrusion bioprinting, and laser-assisted bioprinting. The inkjet bioprinting segment dominated the market, with a market share of around 27% in 2022. The technology allows the printing of complex tissues or living organs on the culture substrates with the use of biomaterials like bio-inks. The broad usage of inkjet-based printing in the medical area is contributing to the segment’s development.
The application segment is divided into drug testing and development, regenerative medicine, clinical application, food testing, and research. The clinical application bioprinting segment dominated the market, with a market share of around 25% in 2022. The blood vessels, skin, bone and cartilage, and different clinical applications make up the clinical applications domain. The clinical applications segment is predicted to dominate the global market in terms of revenue. Making skin tissues that are not only directly implantable but also skilled in stimulating skin rejuvenation and scar reduction in trauma care has been the focus of research into a new, portable 3D bioprinting technique.
| Attribute | Description |
|---|---|
| Market Size | Revenue (USD Billion) |
| Market size value in 2022 | USD 1.4 Billion |
| Market size value in 2032 | USD 9.3 Billion |
| CAGR (2023 to 2032) | 20.90% |
| Historical data | 2019-2021 |
| Base Year | 2022 |
| Forecast | 2023-2032 |
| Regional Segments | The regions analyzed for the market are Asia Pacific, Europe, South America, North America, and Middle East & Africa. Furthermore, the regions are further analyzed at the country level. |
| Segments | Technology, Application |
As per The Brainy Insights, the size of the 3D Bioprinting market was valued at USD 1.4 billion in 2022to USD 9.3 billion by 2032.
Global 3D Bioprinting market is growing at a CAGR of 20.90% during the forecast period 2023-2032.
Asia-Pacific region emerged as the largest market for the 3D Bioprinting market.
Bioprinting could control cell rejection which propels market growth.
1. Introduction
1.1. Objectives of the Study
1.2. Market Definition
1.3. Research Scope
1.4. Currency
1.5. Key Target Audience
2. Research Methodology and Assumptions
3. Executive Summary
4. Premium Insights
4.1. Porter’s Five Forces Analysis
4.2. Value Chain Analysis
4.3. Top Investment Pockets
4.3.1. Market Attractiveness Analysis by Technology
4.3.2. Market Attractiveness Analysis by Application
4.3.3. Market Attractiveness Analysis by Region
4.4. Industry Trends
5. Market Dynamics
5.1. Market Evaluation
5.2. Drivers
5.2.1. Bioprinting Could Control Cell Rejection
5.3. Restraints
5.3.1. Fixed Materials
5.4. Opportunities
5.4.1. Reduced Animal Killing
6. Global 3D Bioprinting Market Analysis and Forecast, By Technology:
6.1. Segment Overview
6.2. Magnetic Levitation Bioprinting
6.3. Inkjet Bioprinting
6.4. Syringe/Extrusion Bioprinting
6.5. Laser-Assisted Bioprinting
7. Global 3D Bioprinting Market Analysis and Forecast, By Application
7.1. Segment Overview
7.2. Drug Testing and Development
7.3. Regenerative Medicine
7.4. Clinical Application
7.5. Food Testing
7.6. Research
8. Global 3D Bioprinting Market Analysis and Forecast, By Regional Analysis
8.1. Segment Overview
8.2. North America
8.2.1. U.S.
8.2.2. Canada
8.2.3. Mexico
8.3. Europe
8.3.1. Germany
8.3.2. France
8.3.3. U.K.
8.3.4. Italy
8.3.5. Spain
8.4. Asia-Pacific
8.4.1. Japan
8.4.2. China
8.4.3. India
8.5. South America
8.5.1. Brazil
8.6. Middle East and Africa
8.6.1. UAE
8.6.2. South Africa
9. Global 3D Bioprinting Market-Competitive Landscape
9.1. Overview
9.2. Market Share of Key Players in the 3D Bioprinting Market
9.2.1. Global Company Market Share
9.2.2. North America Company Market Share
9.2.3. Europe Company Market Share
9.2.4. APAC Company Market Share
9.3. Competitive Situations and Trends
9.3.1. Product Launches and Developments
9.3.2. Partnerships, Collaborations, and Agreements
9.3.3. Mergers & Acquisitions
9.3.4. Expansions
10. Company Profiles
10.1. 3D Bioprinting Solutions.
10.1.1. Business Overview
10.1.2. Company Snapshot
10.1.3. Company Market Share Analysis
10.1.4. Company Product Portfolio
10.1.5. Recent Developments
10.1.6. SWOT Analysis
10.2. Allevi
10.2.1. Business Overview
10.2.2. Company Snapshot
10.2.3. Company Market Share Analysis
10.2.4. Company Product Portfolio
10.2.5. Recent Developments
10.2.6. SWOT Analysis
10.3. Cellink Global
10.3.1. Business Overview
10.3.2. Company Snapshot
10.3.3. Company Market Share Analysis
10.3.4. Company Product Portfolio
10.3.5. Recent Developments
10.3.6. SWOT Analysis
10.4. Cyfuse Biomedical K.K.
10.4.1. Business Overview
10.4.2. Company Snapshot
10.4.3. Company Market Share Analysis
10.4.4. Company Product Portfolio
10.4.5. Recent Developments
10.4.6. SWOT Analysis
10.5. EnvisionTEC, Inc.
10.5.1. Business Overview
10.5.2. Company Snapshot
10.5.3. Company Market Share Analysis
10.5.4. Company Product Portfolio
10.5.5. Recent Developments
10.5.6. SWOT Analysis
10.6. Inventia Life Science PTY LTD
10.6.1. Business Overview
10.6.2. Company Snapshot
10.6.3. Company Market Share Analysis
10.6.4. Company Product Portfolio
10.6.5. Recent Developments
10.6.6. SWOT Analysis
10.7. Organovo Holdings, Inc.
10.7.1. Business Overview
10.7.2. Company Snapshot
10.7.3. Company Market Share Analysis
10.7.4. Company Product Portfolio
10.7.5. Recent Developments
10.7.6. SWOT Analysis
10.8. Poietis
10.8.1. Business Overview
10.8.2. Company Snapshot
10.8.3. Company Market Share Analysis
10.8.4. Company Product Portfolio
10.8.5. Recent Developments
10.8.6. SWOT Analysis
10.9. Regemat 3D S.L.
10.9.1. Business Overview
10.9.2. Company Snapshot
10.9.3. Company Market Share Analysis
10.9.4. Company Product Portfolio
10.9.5. Recent Developments
10.9.6. SWOT Analysis
10.10. Vivax Bio, LLC
10.10.1. Business Overview
10.10.2. Company Snapshot
10.10.3. Company Market Share Analysis
10.10.4. Company Product Portfolio
10.10.5. Recent Developments
10.10.6. SWOT Analysis
List of Table
1. Global 3D Bioprinting Market, By Technology, 2019-2030 (USD Billion)
2. Global Magnetic Levitation Bioprinting 3D Bioprinting Market, By Region, 2019-2030 (USD Billion)
3. Global Inkjet Bioprinting 3D Bioprinting Market, By Region, 2019-2030 (USD Billion)
4. Global Syringe/Extrusion Bioprinting 3D Bioprinting Market, By Region, 2019-2030 (USD Billion)
5. Global Laser-Assisted Bioprinting 3D Bioprinting Market, By Region, 2019-2030 (USD Billion)
6. Global 3D Bioprinting Market, By Application, 2019-2030 (USD Billion)
7. Global Drug Testing and Development 3D Bioprinting Market, By Region, 2019-2030 (USD Billion)
8. Global Regenerative Medicine 3D Bioprinting Market, By Region, 2019-2030 (USD Billion)
9. Global Clinical Application 3D Bioprinting Market, By Region, 2019-2030 (USD Billion)
10. Global Food Testing 3D Bioprinting Market, By Region, 2019-2030 (USD Billion)
11. Global Research 3D Bioprinting Market, By Region, 2019-2030 (USD Billion)
12. North America 3D Bioprinting Market, By Technology, 2019-2030 (USD Billion)
13. North America 3D Bioprinting Market, By Application, 2019-2030 (USD Billion)
14. U.S. 3D Bioprinting Market, By Technology, 2019-2030 (USD Billion)
15. U.S. 3D Bioprinting Market, By Application, 2019-2030 (USD Billion)
16. Canada 3D Bioprinting Market, By Technology, 2019-2030 (USD Billion)
17. Canada 3D Bioprinting Market, By Application, 2019-2030 (USD Billion)
18. Mexico 3D Bioprinting Market, By Technology, 2019-2030 (USD Billion)
19. Mexico 3D Bioprinting Market, By Application, 2019-2030 (USD Billion)
20. Europe 3D Bioprinting Market, By Technology, 2019-2030 (USD Billion)
21. Europe 3D Bioprinting Market, By Application, 2019-2030 (USD Billion)
22. Germany 3D Bioprinting Market, By Technology, 2019-2030 (USD Billion)
23. Germany 3D Bioprinting Market, By Application, 2019-2030 (USD Billion)
24. France 3D Bioprinting Market, By Technology 2019-2030 (USD Billion)
25. France 3D Bioprinting Market, By Application, 2019-2030 (USD Billion)
26. U.K. 3D Bioprinting Market, By Technology, 2019-2030 (USD Billion)
27. U.K. 3D Bioprinting Market, By Application, 2019-2030 (USD Billion)
28. Italy 3D Bioprinting Market, By Technology, 2019-2030 (USD Billion)
29. Italy 3D Bioprinting Market, By Application, 2019-2030 (USD Billion)
30. Spain 3D Bioprinting Market, By Technology, 2019-2030 (USD Billion)
31. Spain 3D Bioprinting Market, By Application, 2019-2030 (USD Billion)
32. Asia Pacific 3D Bioprinting Market, By Technology, 2019-2030 (USD Billion)
33. Asia Pacific 3D Bioprinting Market, By Application, 2019-2030 (USD Billion)
34. Japan 3D Bioprinting Market, By Technology, 2019-2030 (USD Billion)
35. Japan 3D Bioprinting Market, By Application, 2019-2030 (USD Billion)
36. China 3D Bioprinting Market, By Technology 2019-2030 (USD Billion)
37. China 3D Bioprinting Market, By Application, 2019-2030 (USD Billion)
38. India 3D Bioprinting Market, By Technology 2019-2030 (USD Billion)
39. India 3D Bioprinting Market, By Application, 2019-2030 (USD Billion)
40. South America 3D Bioprinting Market, By Technology, 2019-2030 (USD Billion)
41. South America 3D Bioprinting Market, By Application, 2019-2030 (USD Billion)
42. Brazil 3D Bioprinting Market, By Technology 2019-2030 (USD Billion)
43. Brazil 3D Bioprinting Market, By Application, 2019-2030 (USD Billion)
44. Middle East and Africa 3D Bioprinting Market, By Technology, 2019-2030 (USD Billion)
45. Middle East and Africa 3D Bioprinting Market, By Application, 2019-2030 (USD Billion)
46. UAE 3D Bioprinting Market, By Technology, 2019-2030 (USD Billion)
47. UAE 3D Bioprinting Market, By Application, 2019-2030 (USD Billion)
48. South Africa 3D Bioprinting Market, By Technology 2019-2030 (USD Billion)
49. South Africa 3D Bioprinting Market, By Application, 2019-2030 (USD Billion)
List of Figures
1. Global 3D Bioprinting Market Segmentation
2. 3D Bioprinting Market: Research Methodology
3. Market Size Estimation Methodology: Bottom-Up Approach
4. Market Size Estimation Methodology: Top-Down Approach
5. Data Triangulation
6. Porter’s Five Forces Analysis
7. Value Chain Analysis
8. Global 3D Bioprinting Market Attractiveness Analysis by Technology
9. Global 3D Bioprinting Market Attractiveness Analysis by Application
10. Global 3D Bioprinting Market Attractiveness Analysis by Region
11. Global 3D Bioprinting Market: Dynamics
12. Global 3D Bioprinting Market Share by Technology (2022 & 2030)
13. Global 3D Bioprinting Market Share by Application (2022 & 2030)
14. Global 3D Bioprinting Market Share by Regions (2022 & 2030)
15. Global 3D Bioprinting Market Share by Company (2021)
This study forecasts revenue at global, regional, and country levels from 2019 to 2032. The Brainy Insights has segmented the global 3D Bioprinting market based on below mentioned segments:
Global 3D Bioprinting Market Technology:
Global 3D Bioprinting Market Application:
Global 3D Bioprinting Market by Region:
Research has its special purpose to undertake marketing efficiently. In this competitive scenario, businesses need information across all industry verticals; the information about customer wants, market demand, competition, industry trends, distribution channels etc. This information needs to be updated regularly because businesses operate in a dynamic environment. Our organization, The Brainy Insights incorporates scientific and systematic research procedures in order to get proper market insights and industry analysis for overall business success. The analysis consists of studying the market from a miniscule level wherein we implement statistical tools which helps us in examining the data with accuracy and precision.
Our research reports feature both; quantitative and qualitative aspects for any market. Qualitative information for any market research process are fundamental because they reveal the customer needs and wants, usage and consumption for any product/service related to a specific industry. This in turn aids the marketers/investors in knowing certain perceptions of the customers. Qualitative research can enlighten about the different product concepts and designs along with unique service offering that in turn, helps define marketing problems and generate opportunities. On the other hand, quantitative research engages with the data collection process through interviews, e-mail interactions, surveys and pilot studies. Quantitative aspects for the market research are useful to validate the hypotheses generated during qualitative research method, explore empirical patterns in the data with the help of statistical tools, and finally make the market estimations.
The Brainy Insights offers comprehensive research and analysis, based on a wide assortment of factual insights gained through interviews with CXOs and global experts and secondary data from reliable sources. Our analysts and industry specialist assume vital roles in building up statistical tools and analysis models, which are used to analyse the data and arrive at accurate insights with exceedingly informative research discoveries. The data provided by our organization have proven precious to a diverse range of companies, facilitating them to address issues such as determining which products/services are the most appealing, whether or not customers use the product in the manner anticipated, the purchasing intentions of the market and many others.
Our research methodology encompasses an idyllic combination of primary and secondary initiatives. Key phases involved in this process are listed below:

The phase involves the gathering and collecting of market data and its related information with the help of different sources & research procedures.

The data procurement stage involves in data gathering and collecting through various data sources.
This stage involves in extensive research. These data sources includes:
Purchased Database: Purchased databases play a crucial role in estimating the market sizes irrespective of the domain. Our purchased database includes:
Primary Research: The Brainy Insights interacts with leading companies and experts of the concerned domain to develop the analyst team’s market understanding and expertise. It improves and substantiates every single data presented in the market reports. Primary research mainly involves in telephonic interviews, E-mail interactions and face-to-face interviews with the raw material providers, manufacturers/producers, distributors, & independent consultants. The interviews that we conduct provides valuable data on market size and industry growth trends prevailing in the market. Our organization also conducts surveys with the various industry experts in order to gain overall insights of the industry/market. For instance, in healthcare industry we conduct surveys with the pharmacists, doctors, surgeons and nurses in order to gain insights and key information of a medical product/device/equipment which the customers are going to usage. Surveys are conducted in the form of questionnaire designed by our own analyst team. Surveys plays an important role in primary research because surveys helps us to identify the key target audiences of the market. Additionally, surveys helps to identify the key target audience engaged with the market. Our survey team conducts the survey by targeting the key audience, thus gaining insights from them. Based on the perspectives of the customers, this information is utilized to formulate market strategies. Moreover, market surveys helps us to understand the current competitive situation of the industry. To be precise, our survey process typically involve with the 360 analysis of the market. This analytical process begins by identifying the prospective customers for a product or service related to the market/industry to obtain data on how a product/service could fit into customers’ lives.

Secondary Research: The secondary data sources includes information published by the on-profit organizations such as World bank, WHO, company fillings, investor presentations, annual reports, national government documents, statistical databases, blogs, articles, white papers and others. From the annual report, we analyse a company’s revenue to understand the key segment and market share of that organization in a particular region. We analyse the company websites and adopt the product mapping technique which is important for deriving the segment revenue. In the product mapping method, we select and categorize the products offered by the companies catering to domain specific market, deduce the product revenue for each of the companies so as to get overall estimation of the market size. We also source data and analyses trends based on information received from supply side and demand side intermediaries in the value chain. The supply side denotes the data gathered from supplier, distributor, wholesaler and the demand side illustrates the data gathered from the end customers for respective market domain.

The supply side for a domain specific market is analysed by:
The demand side for the market is estimated through:
In-house Library: Apart from these third-party sources, we have our in-house library of qualitative and quantitative information. Our in-house database includes market data for various industry and domains. These data are updated on regular basis as per the changing market scenario. Our library includes, historic databases, internal audit reports and archives.
Sometimes there are instances where there is no metadata or raw data available for any domain specific market. For those cases, we use our expertise to forecast and estimate the market size in order to generate comprehensive data sets. Our analyst team adopt a robust research technique in order to produce the estimates:
Data Synthesis: This stage involves the analysis & mapping of all the information obtained from the previous step. It also involves in scrutinizing the data for any discrepancy observed while data gathering related to the market. The data is collected with consideration to the heterogeneity of sources. Robust scientific techniques are in place for synthesizing disparate data sets and provide the essential contextual information that can orient market strategies. The Brainy Insights has extensive experience in data synthesis where the data passes through various stages:


Market Deduction & Formulation: The final stage comprises of assigning data points at appropriate market spaces so as to deduce feasible conclusions. Analyst perspective & subject matter expert based holistic form of market sizing coupled with industry analysis also plays a crucial role in this stage.
This stage involves in finalization of the market size and numbers that we have collected from data integration step. With data interpolation, it is made sure that there is no gap in the market data. Successful trend analysis is done by our analysts using extrapolation techniques, which provide the best possible forecasts for the market.
Data Validation & Market Feedback: Validation is the most important step in the process. Validation & re-validation via an intricately designed process helps us finalize data-points to be used for final calculations.

The Brainy Insights interacts with leading companies and experts of the concerned domain to develop the analyst team’s market understanding and expertise. It improves and substantiates every single data presented in the market reports. The data validation interview and discussion panels are typically composed of the most experienced industry members. The participants include, however, are not limited to:
Moreover, we always validate our data and findings through primary respondents from all the major regions we are working on.


Free Customization
Fortune 500 Clients
Free Yearly Update On Purchase Of Multi/Corporate License
Companies Served Till Date